

Abstract
Objective
Young men who have sex with men (YMSM) bear a disproportionate burden of HIV infection in the United States and their risks of acquiring HIV may be shaped by complex multi-layer social networks. These networks are formed through not only direct contact with social/sex partners but also indirect anonymous contacts encountered when attending social venues. We introduced a new application of a state-of-the-art graph-based deep learning method to predict HIV infection that can identify influential neighbors within these multiple network contexts.
Design and Methods
We used empirical network data among YMSM aged 16–29 years old collected from Houston and Chicago in the U.S. between 2014 and 2016. A computational framework GAT-HIV (Graph Attention Networks for HIV) was proposed to predict HIV infections by identifying influential neighbors within social networks. These networks were formed by multiple relations comprised of social/sex partners and shared venue attendances, and using individual-level variables. Further, GAT-HIV was extended to combine multiple social networks using multi-graph GAT methods. A visualization tool was also developed to highlight influential network members for each individual within the multiple social networks.
Results
The multi-graph GAT-HIV models obtained average AUC values of 0.776 and 0.824 for Chicago and Houston respectively, performing better than empirical predictive models (e.g. AUCs of random forest: 0.758 and 0.798). GAT-HIV on single networks also delivered promising prediction performances.
Conclusions
The proposed methods provide a comprehensive and interpretable framework for graph-based modeling that may inform effective HIV prevention intervention strategies among populations most vulnerable to HIV.
Keywords: deep learning, mathematical models, young men who have sex with men, sexually transmitted infections, social networking, social networks, venue affiliation
Introduction
Men who have sex with men (MSM) are most affected by HIV in the United States [1]. Among them, younger MSM (YMSM, 13–34), accounted for the largest proportion of new HIV diagnoses in 2017 [2]. Not only individuals’ characteristics and behaviors [3], but also structural factors and social contexts characterized by sexual/social network patterns [4], impact HIV risk among these vulnerable populations [5,6].
Social and sexual networks play a key role in HIV risk [7,8] through patterns in sexual partner selection, including preferences in ethnicity and age [9], diffusion of group norms regarding HIV risk [10–12], presence of network members with HIV [13] and other sexually transmitted infections (STIs) [11,14–17], and engagement in risk behavior [18]. Therefore, prevention efforts that target social and sexual networks combined with individual behaviors show promise in reducing disease transmission among the MSM population [19]. However, collecting sexual network data is challenging due to missing data or sampling biases [20]. In many studies, sexual networks are collected as egocentric network data to compute network measures (such as network size, density, etc.) [5]. A previous study found that simply using egocentric networks may have limitations in modeling contextual information, and may underestimate the impacts of network structures in determining each individual’s HIV infection status [21].
Social networks and sexual networks tend to overlap with each other[22,23]. Such overlapping networks have stronger influences on changing the behavior of network members [5], on forming shared life experiences, group norms, attitudes, and sexual preferences upon which sexual networks are built, and on increasing the knowledge of partners’ HIV status [24].
Social networks can be formed not only by direct contacts but also by indirect contacts through attending social venues (e.g. bars and clubs) [25], where MSM meet their sex partners or interact with their peers. HIV risk may be shaped by the patterns of individuals’ venue affiliation through which sexual or social networks could be formed [20,26–30]. Existing studies have applied social network analysis to describe individual, partner, and network characteristics and dynamics of HIV/STI and sexual behavior among the young MSM population [31,32]. Some network studies have applied stochastic agent-based network models to evaluate multiple mechanisms that account for racial disparities in HIV prevalence [33] and to evaluate multiple PrEP intervention strategies to compare future projections of HIV incidence [34] through simulation of dynamic networks involving the young MSM population. Other network studies have applied variants of exponential random graph models to model multilevel networks including one-mode social networks, two-mode venue affiliation networks, and two-mode venue avoidance networks in relation to HIV risk and PrEP uptake by estimating exponential random graph models [26,35,36].
Although these network modeling methodologies are considered as state-of-the-art network methodology in the network epidemiologic analytic arsenal, they are not designed to predict HIV infection at the levels of individuals and sub-networks surrounding individuals. They have limitations in modeling potential “hidden” connections between network members, e.g. two individuals connected by neighbors of neighbors but without direct ties, or the HIV statuses of the direct neighbors are unknown but indirect neighbors’ statuses are known.
Machine learning flexibly integrates multi-source data and makes predictions on unobserved samples [37]. It allows modeling of complex and multi-dimensional data structures and complements traditional statistical analysis such as logistic regression [38]. In particular, deep learning-based approaches have been successful with many biomedical problems including cancer screening and medication recommendation [39–41]. However, the application of these deep learning methods to HIV prevention intervention research remains fledging [42], and they are rarely used to model social network contexts in HIV research. One exception is an empirical study that demonstrated the utility of graph-based deep learning by applying a novel algorithm, Graph Convolutional Networks (GCN), to evaluate the risk of HIV infections within the social network context [21]. However, this methodology is not capable of identifying and keeping track of influential network members who may help shape one’s risk.
We addressed these limitations by proposing GAT-HIV (Graph Attention Networks for HIV), applying a state-of-the-art graph-based deep learning algorithm GAT [43], capable of modeling comprehensive networks to increase the performance of HIV infection prediction. Empirical data on peer-referrals were combined with social and sexual partners, venue attendance records, and individuals’ attributes/behaviors for 755 YMSM aged 16 to 29. They were recruited through respondent-driven sampling (RDS) [44,45] from two U.S. cities, Houston and Chicago, as part of the Young Men’s Affiliation Project (YMAP) [46]. Two networks were constructed for each city: a person-person one-mode social network comprising social/referral/sexual connections, and a person-person one-mode venue co-attendance network that was projected using the person-venue two-mode affiliation network. Based on a study that applied multilayered graph attention models [47], we took an integrated approach combining these two networks and predicted HIV infections applying two integration architectures: (1) Multiplex Fusion architecture I (Multi-Fusion-I) and (2) Multi-Fusion-II. We hypothesized that the network modeling capacity of GAT-HIV would improve HIV infection prediction within the network context, compared with conventional models only considering individual-level variables. We further hypothesized that a combination of multiple distinct networks provides enhanced performance in HIV prediction. A visualization tool was also developed to display and keep track of influential neighbors at the individual level that could inform effective network-based HIV prevention intervention strategies [48].
Method
Problem Definition
Given a set of individuals I with their variables, the social network S and the venue co-attendance network C, if the HIV infection status of a proportion of I is known, predict the HIV infection status of the remaining individuals.
Study Population
YMAP is a prospective cohort study examining the impact of factors associated with multiple networks on HIV risk and prevention among YMSM aged 16 to 29 in two U.S. cities, Houston and Chicago. The data used in this study were collected from YMAP between 2014 and 2016 through the RDS method and followed up during 2014–2017. The RDS method is based on the link-tracing chain referral recruitment method that has been widely employed to recruit hard-to-reach populations such as MSM or drug users. In RDS, individuals were purposively selected as “seeds”, which were then used to recruit up to four of their contacts (or recruits). Survey data were collected once a year and based on computer-assisted personal interviews that included sociodemographic characteristics, HIV/STI risk/protective behaviors, social and sexual networks, and venue attendance or affiliation information.
Determination of HIV Infection Status
Biological data were also collected. This study used the test results for HIV infections based on the Alere Determine TMHIV-1/2 Combo antigen/antibody test. Participants with reactive samples were confirmed using HIV-1/HIV-2 multi-spot differentiation and HIV RNA (viral load) tests. HIV seropositivity was defined based on the confirmatory test results. Since data was collected over two years, a participant’s HIV infection status was tagged as positive if the status of the first year or the second year was positive, given that infection might occur after a latent period and HIV testings were not frequent enough to capture immediate status changes. Among the 377 and 378 YMSMs in Chicago and Houston, 130 and 149 were tagged as HIV seropositive status, respectively.
Network Building
The aggregated one-mode social network data was constructed based on nominations from the surveys and peer-referral network first generated by RDS, and further combined using a fuzzy matching algorithm [17,21,46]. Every two network participants (individuals) having a social/referral/sexual relationship form a tie in the network S.
The venue affiliation records contain times of attendance at each venue each year for each individual. The venues were manually categorized into social/entertainment, e.g. bars/clubs, and health/promotion service, e.g. clinics/community centers. Only the affiliation records of the social venues were used in this study as they are more associated with HIV transmission [25]. Attendance was binarized, i.e. 1 if one attended a certain venue, and 0 otherwise. Using the person-venue two-mode network data, we generated the person-person one-model venue co-attendance network C (see Supplement: Venue_Co-attendance). We further leveraged a threshold t as the cut-off value of C, s.t. if Ci×j > t, Ci×j = 1, else Ci×j = 0. The value t was optimized using a stepwise grid search during model training.
The original value in the venue co-attendance network only represents the total number of co-attended venues for every two individuals but it is not associated with any temporal information that could indicate whether individuals met physically at certain venues at a certain time. However, intuitively, the larger the value is, the higher the chance that people could meet there. By using the threshold t as a cut-off, we assume that only when individuals have over t overlapping venue co-attendances might they have met.
In this study, we define individuals as nodes, their connections as edges, and two nodes connected by an edge as neighbors. The binary matrices S and C, which convey the connected information between nodes, are stored using adjacency matrices. The adjacency matrices and the individual-level variables of each node are the primary model inputs.
Variables
We used the variables1 collected in the first year (2014) for data analysis and we made predictions at the end of the first year. The variables include sociodemographic, personal sexual behaviors, personal drug usage, social variables, network variables, and other variables (see Supplement: Individual-level_Variables). Network variables were calculated according to the network structure of S or C together with the known HIV infection status. For example, the ratio of HIV positive neighbors was calculated as the number of known HIV positive neighbors (i.e. known as the training data) divided by the total number of neighbors in a specific network.
Graph Attention Networks
Graph Neural Networks (GNN) are a family of graph-based deep learning models [49,50] that can be used for the prediction of node attributes; GAT is a variation of the classic GNN that adds an attention mechanism [43]. In GAT-HIV, the evidence for determining the HIV infection of each node not only comes from the individual-level variables but also from evidence from its neighbors,. These pieces of evidence are weighted by a mechanism called “attention”[51]. The attention weight of each neighbor is computed by a neural network layer whose parameters are optimized during the model training process. Therefore, the final evidence for each node is the weighted average of its neighbors. The attention weights can be used to evaluate the importance of each neighbor. GAT-HIV is capable of collecting evidence from the 1st, 2nd, …, and k-th order neighbors using iterations so that the impact information from influential neighbors can be accumulated even when some attributes of direct neighbors are unknown. A detailed introduction of the GAT-HIV model is shown in Supplement: Graph_Attention_Networks.
Integration models
Inspired by a study on multilayered networks [47], we used two data integration architectures based on GAT-HIV, Multi-Fusion-I and Multi-Fusion-II (Fig. 1), enabling evidence collection from both the social network S and the venue co-attendance network C. Specifically, in Multi-Fusion-I, two GAT-HIV models were applied to S and C first, and instead of making predictions directly from each, the output representations from both networks were combined for the final prediction.
Fig. 1.
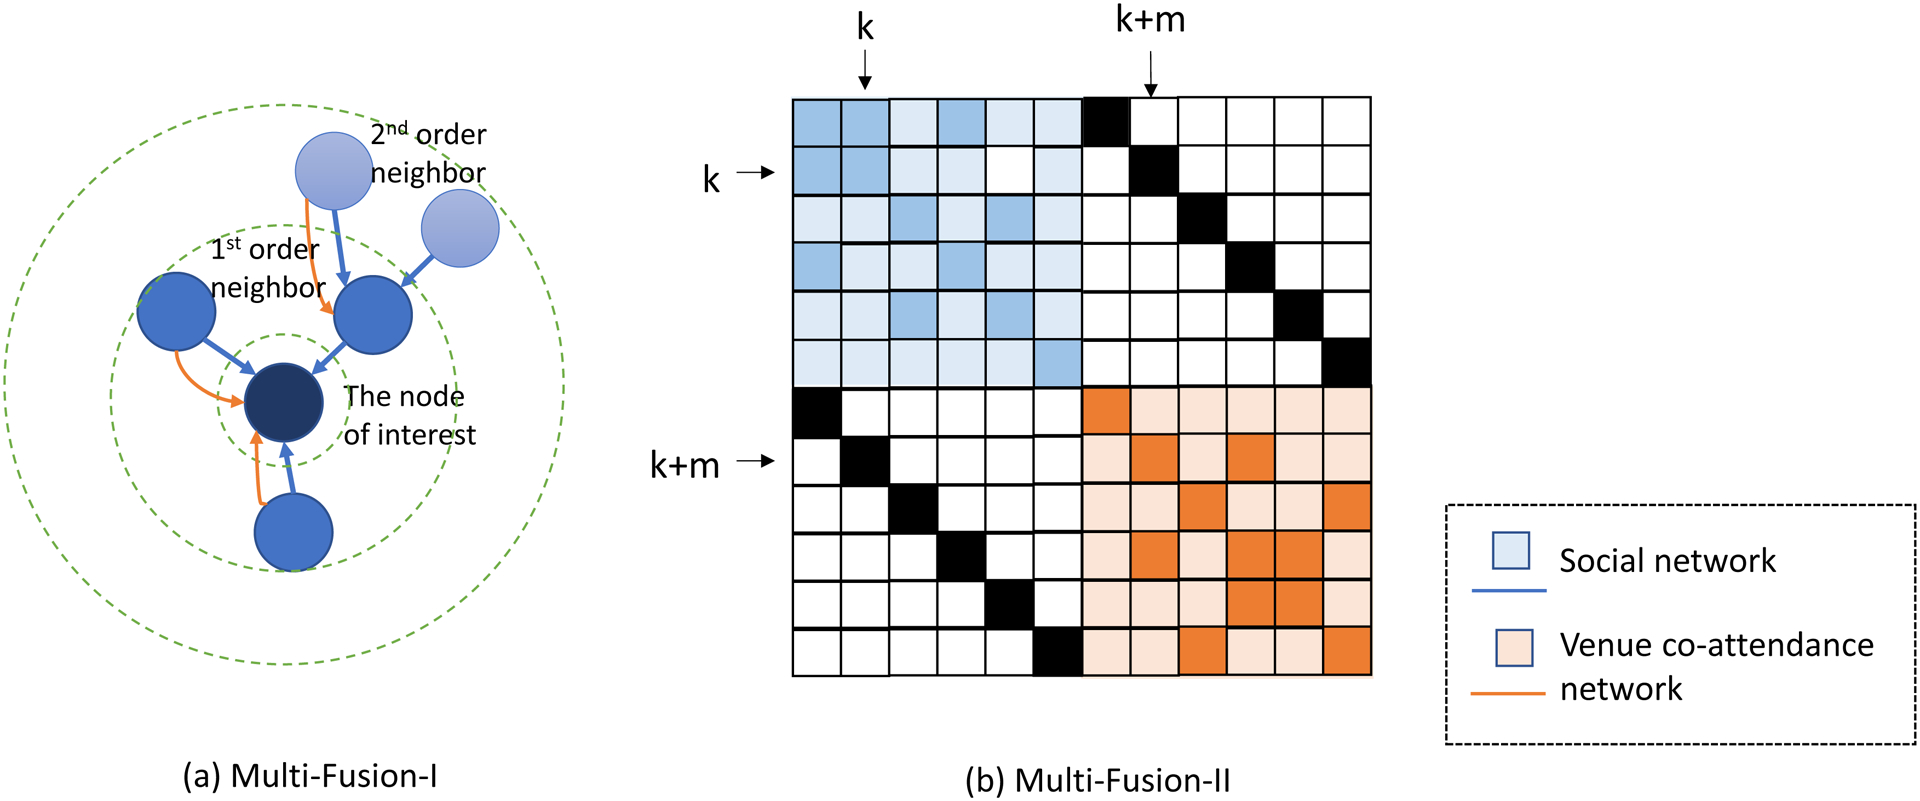
The illustration of two integration architectures. The arrows in Multi-Fusion-I show the information flow from the two networks.
Multi-Fusion-II introduced a novel data structure called Supra Graph, which can be conceptualized as an enlarged adjacency matrix. If there are m nodes in each network, the shape of the Supra Graph is 2m×2m, in which the top left quartile stores the adjacency matrix of S and the bottom right quartile stores the adjacency matrix of C. “Factor” markers (black in [Fig. 1] whose value is 1) are placed in the diagonal of the other two quartiles of the graph to connect the two networks. For example, in Figure 1 (b), when dealing with the kth row (the kth individual), the factor marker from the (k+m)th column will enable the connection between the kth row of the blue part and the (k+m)th column of the orange part. Given the symmetry characteristic of the adjacency matrices, for each node, information from the two networks will be consequently connected. The details of these models are introduced in Supplement: Graph_Attention_Networks.
Experiments
Experiments were conducted to validate the hypotheses and the effectiveness of the proposed methods, including comparisons with baseline methods on each network (S and C), and results by integrating multiple networks using the two integration architectures. The Area Under the Receiver Operating Curve (AUC), broadly used as an evaluation metric for predictive models reflecting a balance between sensitivity and specificity [46], was adopted as the primary evaluation metric. We used three models as baselines for comparison, Graph Convolutional Networks (GCN) [50], logistic regression (LR) [52], and random forest (RF) [53], which were also previously used as baselines [21]. Logistic regression is a traditional statistical model that has been widely adopted as a standard in data analysis [54]. Random forest is an ensemble of decision trees and also a benchmark algorithm for many tasks that rely on pre-defined features [55]. AUCs of both with (denoted by +net in Table 1) and without network variables for LR and RF were reported along with the optimal results of the ensemble approach proposed in [21] by combining GATs and RF. 10-fold cross-validation was used to evaluate the robustness of the models and the average AUCs were compared. During each fold, 70% nodes were randomly selected for training and the rest 30% nodes were for testing. Implementation details are described in Supplement: Implementation_Details.
Table 1.
AUCs and standard deviations for different models on HIV prediction.
| social | venue | social | venue | |
|---|---|---|---|---|
| GCN | 0.591 (0.054) | 0.589 (0.051) | 0.639 (0.033) | 0.690 (0.062) |
| LR | 0.718 (0.037) | -* | 0.771 (0.033) | - |
| RF | 0.758 (0.050) | - | 0.798 (0.053) | - |
| GAT-HIV | 0.755 (0.052) | 0.636 (0.049) | 0.810 (0.041) | 0.679 (0.022) |
| Multi-Fusion-I | 0.776 (0.044) | - | 0.817 (0.036) | - |
LR and RF are instance-based machine learning models, their results are not affected by network structure. Similarly, the Multi-Fusion models consider both networks. The optimal AUCs in each column are marked using different colors, i.e. top-1, top-2, and top-3.
Results
Descriptive Analysis
A descriptive analysis of the network-oriented variables used in this study was conducted (Supplement: Descriptive_Analysis_of_Network_Variables) by using the Wilcoxon Rank Sum Test for the network-oriented variables between cities to see if any structural differences between the two cities might result in different prediction performances. YMSM in Chicago tended to have more sex partners than those in Houston, but only significant in # sex partners drugs, and # neighbors in both networks. For other network-oriented variables, significant differences were observed in # health venues attended and some ratios of HIV+/− neighbors. The HIV positive rates were between 0.3 and 0.4 in both cities.
Prediction Performance
AUC values of different machine learning models in the prediction of HIV infection status in both cities for both networks were shown in (Table 1). Focusing on social network-related results only, GAT-HIV works well among the single models and generally performs comparable or better than baselines. It works best on Houston’s data, outperforming RF by 1.2%, while on Chicago’s data, GAT-HIV is also comparable with RF. For GAT-HIV, the AUCs using social were consistently better than those using venue, which is particularly obvious on Houston’s data. Adding network features did not bring obvious performance gains on data from both the two cities. Using the integration models, Multi-Fusion-I and -II further boosted the AUC of GAT-HIV for both cities, and the best prediction performances were generated. Comparisons demonstrated the effectiveness of combining both networks.
Inspired by previous research that an ensemble of several strong methods could achieve further performance gains [21], we developed similar models to combine RF and GAT models. We found that combining RF and Multi-Fusion-I produced the best results, improving the AUCs of the optimal baseline integration model (Multi-Fusion-II) by 1% and 1.1% on Chicago and Houston, obtaining 0.785 (0.053) and 0.835 (0.046) respectively. This ensemble also delivered the best prediction performance among all methods. A sensitivity analysis was conducted by applying different cut-offs for thresholding t using GAT-HIV (on venue only) and using Multi-Fusion-II, and the results are shown in Supplement: Sensitivity_Analysis. This showed that different thresholds will generate diverse AUCs, with t=20 and t=5 as the best choices for Chicago and Houston in GAT-HIV, and t=10 and t=15 in Multi-Fusion-II.
Visualization
Focused on each individual, it would be meaningful and interesting to determine which network and which neighbors contribute more to the prediction of their HIV infection status, i.e. shape their risk. Identifying effective media and influential neighbors would be extremely helpful in conducting early interventions to reduce HIV transmissions. We developed an interactive tool based on Neo4j [56] and Cytoscape [57] for the visualization of effective network and influential neighbors for each individual using the parameters from the integration models. Supplement: Visualization describes details of the tool and shows several screenshots.
Discussion
GAT-HIV has produced promising performances in HIV predictions in both Houston and Chicago. Integration models showed the effectiveness of combining the social and venue co-attendance network and further boosted the prediction performances.
Benchmark statistical machine learning models such as LR and RF have been used widely in many predictive modeling tasks. These instance-level models (taking each input sample independently), especially RF, excel in feature selection and can generate promising prediction performances. In comparison, GNN models such as GCN and GAT are not as powerful in instance-level feature modeling in many cases, especially on small training samples. However, from Table 1, we noticed that although GCN performs worse than LR and RF, GAT has comparable or better results. One possible reason is that GAT is better at modeling contextual characteristics than GCN, with the addition of attention mechanism, which compensates for GCN’s insufficiency in individual-level feature engineering. By using the attention mechanism, GAT evaluates the importance of neighbors and assigns different weights to them, which might be a more realistic modeling strategy. In comparison, GCN simply averages information from multiple neighbors but is weak in modeling their different contributions, which could introduce biases.
A drawback of conventional models such as LR and RF is that they have difficulty in modeling relations between different samples. Therefore, it is almost impossible to comprehensively model network contexts, which is quite useful if the targeted samples are in a context-sensitive environment. On the contrary, it is possible that adding network features will not have much impact on improving the performance, if not in a context-sensitive case, reflected by the results of LR+net and RF+net. Another drawback of these methods is that they cannot offer sufficient outcomes for modeling each individual’s influential contexts (neighbors), which limits their functionality in real-world decision making, e.g. conducting personalized recommendation.
The results of fusion models in Table 1 demonstrate the importance of combining information from both networks and also the effectiveness of both integration architectures. In real-world data collection, sometimes it is difficult to guarantee the quality and completeness of a single-source dataset, e.g. the social network in this study. Therefore, combining evidence from multiple sources would usually be helpful. For example, adding the venue network brings 0.21 performance gains on Chicago’s data and 0.14 on Houston’s data, comparing the fusion models with GAT-HIV.
A use case shows different influential weights (normalized so they sum up to 1) of the neighbors as well as their personal profiles (individual-level variables), generated by the parameters of Multi-Fusion-II (Fig. 1 [b]). In this case, the node as an HIV positive individual with a weight of 0.47 had the largest contribution. This was determined by both individual-level variables and network connections from both the social network and venue co-attendance network. For this node of interest, the contribution from itself is pretty low, i.e. only 0.08, which could be quite different from the determination process of conventional models such as LR and RF, which might focus primarily on individual-level variables.
The sensitivity analysis implies there are some cut-offs to decide whether two individuals may have co-attended at a venue. We show the performances of thresholding on both the uni-fold GAT-HIV on the venue network only and those on Multi-Fusion II in Supplement: Sensitivity_Analysis. There are obvious peaks on curves in both models on data from both cities.
Limitation and Future Work
Several limitations remain for the current study. Firstly, although GAT-based models have the natural advantage of weighting neighbor nodes, additional exploration for the weighting of each individual-level variable is needed to further evaluate the importance of each individual characteristic. Secondly, deep learning models still face the “black box” problem, which means interpretation is still difficult, unlike statistical methods that can output odds and P-values. Although we tried to use the attention weights as contribution values, there remained complex factors that can affect the prediction and its interpretation. By using GAT and visualizing the influences of different neighbors, we were attempting to make some special “interpretability” that traditional statistical methods cannot deal with, i.e. identifying influential neighbors. We also believe that our method can serve as a good compensation to the traditional statistical models in decision making, and perhaps the two methods can be used jointly for interpretability in further researches. Thirdly, a prerequisite of deep learning models is a large training dataset. However, the current network size may weaken the advantage of GAT models, which would affect their performance. In the future, we plan to include data from other sources or use other data augmentation techniques to enlarge the dataset.
Conclusion
We introduced GAT-HIV, a novel graph-based deep learning method, to make predictions of HIV infection status from network data. Two integration models were proposed to combine both social and venue co-attendance networks. Results demonstrated the effectiveness of GAT-HIV and the integration models. The visualization tool helps identify the influential neighbors in the determination of HIV status for each individual, which offers a better understanding of HIV transmission, and will benefit early prevention intervention.
Supplementary Material
Fig. 2.

A use case showing contributions from different neighbors for the HIV status determination according to the parameters of Multi-Fusion-II running on Chicago’s data. The node whose HIV infection status is to be determined is marked with a yellow dotted circle with its personal profile listed in an orange rectangle. We show the contribution of each neighbor using different degrees of width and distinguish the social network and venue co-attendance network using blue and orange colors.
Funding sources and other acknowledgment
This study was supported by the National Institutes of Health (R56AI150272, R01MH100021, R21AI139480, R01DA039934). We thank Dr. Irmgard Willcockson for proofreading. We gratefully acknowledge the Nvidia Corporation with their donation of Titan XP and Quadro P6000 GPUs used for this research.
Footnotes
Conflicts of Interest and Source of Funding
There are no conflicts of interest.
Variables/attributes are also called “features” in machine learning. So, we used them interchangeably in this paper.
References
- 1.U.S. Statistics: HIV Diagnoses. HIV.gov. https://www.hiv.gov/hiv-basics/overview/data-and-trends/statistics. Published 2020. Accessed October 20th, 2020.
- 2.HIV and Gay and Bisexual Men. CDC. https://www.cdc.gov/hiv/group/msm/index.html. Published 2020. Accessed May 20th, 2020.
- 3.Koblin BA, Husnik MJ, Colfax G, et al. Risk factors for HIV infection among men who have sex with men. AIDS. 2006;20(5):731–739. [DOI] [PubMed] [Google Scholar]
- 4.Rothenberg R HIV transmission networks. Curr Opin HIV AIDS. 2009;4(4):260. [DOI] [PMC free article] [PubMed] [Google Scholar]
- 5.Amirkhanian YA. Social networks, sexual networks and HIV risk in men who have sex with men. Curr HIV/AIDS Rep. 2014;11(1):81–92. [DOI] [PMC free article] [PubMed] [Google Scholar]
- 6.De Santis JP. HIV infection risk factors among male-to-female transgender persons: a review of the literature. J Assoc Nurses AIDS Care. 2009;20(5):362–372. [DOI] [PubMed] [Google Scholar]
- 7.Adimora AA, Schoenbach VJ, Doherty IA. HIV and African Americans in the southern United States: sexual networks and social context. Sex Transm Dis. 2006;33(7 Suppl):S39–45. [DOI] [PubMed] [Google Scholar]
- 8.Oster AM, Dorell CG, Mena LA, Thomas PE, Toledo CA, Heffelfinger JD. HIV risk among young African American men who have sex with men: a case–control study in Mississippi. Am J Public Health. 2011;101(1):137–143. [DOI] [PMC free article] [PubMed] [Google Scholar]
- 9.Berry M, Raymond HF, McFarland W. Same race and older partner selection may explain higher HIV prevalence among black men who have sex with men. AIDS. 2007;21(17):2349–2350. [DOI] [PubMed] [Google Scholar]
- 10.Peterson JL, Rothenberg R, Kraft JM, Beeker C, Trotter R. Perceived condom norms and HIV risks among social and sexual networks of young African American men who have sex with men. Health Educ Res. 2009;24(1):119–127. [DOI] [PubMed] [Google Scholar]
- 11.Adimora AA, Schoenbach VJ. Social context, sexual networks, and racial disparities in rates of sexually transmitted infections. The Journal of infectious diseases. 2005;191(Supplement_1):S115–S122. [DOI] [PubMed] [Google Scholar]
- 12.Schneider JA, Cornwell B, Ostrow D, et al. Network mixing and network influences most linked to HIV infection and risk behavior in the HIV epidemic among black men who have sex with men. Am J Public Health. 2013;103(1):e28–36. [DOI] [PMC free article] [PubMed] [Google Scholar]
- 13.Kohler H-P, Behrman JR, Watkins SC. Social networks and HIV/AIDS risk perceptions. Demography. 2007;44(1):1–33. [DOI] [PubMed] [Google Scholar]
- 14.Doherty IA, Padian NS, Marlow C, Aral SO. Determinants and consequences of sexual networks as they affect the spread of sexually transmitted infections. The Journal of infectious diseases. 2005;191(Supplement_1):S42–S54. [DOI] [PubMed] [Google Scholar]
- 15.Liljeros F, Edling CR, Amaral LAN. Sexual networks: implications for the transmission of sexually transmitted infections. Microbes and infection. 2003;5(2):189–196. [DOI] [PubMed] [Google Scholar]
- 16.Maulsby C, Millett G, Lindsey K, et al. HIV among Black men who have sex with men (MSM) in the United States: a review of the literature. AIDS Behav. 2014;18(1):10–25. [DOI] [PubMed] [Google Scholar]
- 17.Fujimoto K, Flash CA, Kuhns LM, Kim JY, Schneider JA. Social networks as drivers of syphilis and HIV infection among young men who have sex with men. Sex Transm Infect. 2018;94(5):365–371. [DOI] [PubMed] [Google Scholar]
- 18.Fu Z, He N, Duan S, et al. HIV infection, sexual behaviors, sexual networks, and drug use among rural residents in Yunnan Province, China. AIDS Behav. 2011;15(5):1017–1025. [DOI] [PubMed] [Google Scholar]
- 19.Wohlfeiler D, Potterat JJ. Using gay men’s sexual networks to reduce sexually transmitted disease (STD)/human immunodeficiency virus (HIV) transmission. Sex Transm Dis. 2005;32:S48–S52. [DOI] [PubMed] [Google Scholar]
- 20.Frost SD. Using sexual affiliation networks to describe the sexual structure of a population. Sex Transm Infect. 2007;83 Suppl 1:i37–42. [DOI] [PubMed] [Google Scholar]
- 21.Xiang Y, Fujimoto K, Schneider J, Jia Y, Zhi D, Tao C. Network context matters: graph convolutional network model over social networks improves the detection of unknown HIV infections among young men who have sex with men. J Am Med Inform Assoc. 2019;26(11):1263–1271. [DOI] [PMC free article] [PubMed] [Google Scholar]
- 22.Tieu HV, Liu TY, Hussen S, et al. Sexual Networks and HIV Risk among Black Men Who Have Sex with Men in 6 U.S. Cities. PLoS One. 2015;10(8):e0134085. [DOI] [PMC free article] [PubMed] [Google Scholar]
- 23.Buzi RS, Madanay FL, Fujimoto K. Sexual and social networks, venue attendance, and HIV risk among young men who have sex with men. AIDS Care. 2020:1–6. [DOI] [PubMed] [Google Scholar]
- 24.Imahashi M, Fujimoto K, Kuhns LM, Amith M, Schneider JA. Network overlap and knowledge of a partner’s HIV status among young men who have sex with men. AIDS Care. 2019;31(12):1533–1539. [DOI] [PMC free article] [PubMed] [Google Scholar]
- 25.Fujimoto K, Williams ML, Ross MW. Venue-based affiliation networks and HIV risk-taking behavior among male sex workers. Sex Transm Dis. 2013;40(6):453–458. [DOI] [PMC free article] [PubMed] [Google Scholar]
- 26.Fujimoto K, Wang P, Ross MW, Williams ML. Venue-mediated weak ties in multiplex HIV transmission risk networks among drug-using male sex workers and associates. Am J Public Health. 2015;105(6):1128–1135. [DOI] [PMC free article] [PubMed] [Google Scholar]
- 27.Holloway IW, Rice E, Kipke MD. Venue-based network analysis to inform HIV prevention efforts among young gay, bisexual, and other men who have sex with men. Prevention Science. 2014;15(3):419–427. [DOI] [PMC free article] [PubMed] [Google Scholar]
- 28.Zhao J, Cai WD, Chen L, et al. A comparison of HIV infection and related risks among male sex workers in different venues in Shenzhen, China. AIDS Behav. 2011;15(3):635–642. [DOI] [PubMed] [Google Scholar]
- 29.Toledo CA, Varangrat A, Wimolsate W, et al. Examining HIV infection among male sex workers in Bangkok, Thailand: a comparison of participants recruited at entertainment and street venues. AIDS Educ Prev. 2010;22(4):299–311. [DOI] [PubMed] [Google Scholar]
- 30.Drumright LN, Weir SS, Frost SDW. The role of venues in structuring HIV, sexually transmitted infections, and risk networks among men who have sex with men. BMC Public Health. 2018;18(1):225. [DOI] [PMC free article] [PubMed] [Google Scholar]
- 31.Oster AM, Wejnert C, Mena LA, Elmore K, Fisher H, Heffelfinger JD. Network analysis among HIV-infected young black men who have sex with men demonstrates high connectedness around few venues. Sex Transm Dis. 2013;40(3):206. [DOI] [PMC free article] [PubMed] [Google Scholar]
- 32.Birkett M, Kuhns LM, Latkin C, Muth S, Mustanski B. The sexual networks of racially diverse young men who have sex with men. Arch Sex Behav. 2015;44(7):1787–1797. [DOI] [PMC free article] [PubMed] [Google Scholar]
- 33.Goodreau SM, Rosenberg ES, Jenness SM, et al. Sources of racial disparities in HIV prevalence in men who have sex with men in Atlanta, GA, USA: a modelling study. The lancet HIV. 2017;4(7):e311–e320. [DOI] [PMC free article] [PubMed] [Google Scholar]
- 34.Khanna AS, Schneider JA, Collier N, et al. A modeling framework to inform preexposure prophylaxis initiation and retention scale-up in the context of ‘Getting to Zero’initiatives. AIDS. 2019;33(12):1911–1922. [DOI] [PMC free article] [PubMed] [Google Scholar]
- 35.Fujimoto K, Wang P, Li DH, Kuhns LM, Amith M, Schneider JA. Collective Avoidance of Social and Health Venues and HIV Racial Inequities: Network Modeling of Venue Avoidance on Venue Affiliation, Social Networks, and HIV Risk. Health Educ Behav. 2020;47(2):202–212. [DOI] [PubMed] [Google Scholar]
- 36.Fujimoto K, Wang P, Flash CA, et al. Network modeling of PrEP uptake on referral networks and health venue utilization among young men who have sex with men. AIDS Behav. 2019;23(7):1698–1707. [DOI] [PubMed] [Google Scholar]
- 37.Alpaydin E Introduction to machine learning. MIT press; 2020. [Google Scholar]
- 38.Bzdok D, Altman N, Krzywinski M. Statistics versus machine learning. Nat Methods. 2018;15(4):233–234. [DOI] [PMC free article] [PubMed] [Google Scholar]
- 39.Baldi P Deep Learning in Biomedical Data Science. Annual Review of Biomedical Data Science. 2018;1(1):181–205. [Google Scholar]
- 40.Mamoshina P, Vieira A, Putin E, Zhavoronkov A. Applications of Deep Learning in Biomedicine. Mol Pharm. 2016;13(5):1445–1454. [DOI] [PubMed] [Google Scholar]
- 41.Min S, Lee B, Yoon S. Deep learning in bioinformatics. Brief Bioinform. 2017;18(5):851–869. [DOI] [PubMed] [Google Scholar]
- 42.Wang G, Wei W, Jiang J, et al. Application of a long short-term memory neural network: a burgeoning method of deep learning in forecasting HIV incidence in Guangxi, China. Epidemiol Infect. 2019;147:e194. [DOI] [PMC free article] [PubMed] [Google Scholar]
- 43.Veličković P, Cucurull G, Casanova A, Romero A, Lio P, Bengio Y. Graph attention networks. arXiv preprint arXiv:171010903. 2017. [Google Scholar]
- 44.Heckathorn DD. Respondent-driven sampling: a new approach to the study of hidden populations. Social problems. 1997;44(2):174–199. [Google Scholar]
- 45.Heckathorn DD. Respondent-driven sampling II: deriving valid population estimates from chain-referral samples of hidden populations. Social problems. 2002;49(1):11–34. [Google Scholar]
- 46.Fujimoto K, Cao M, Kuhns LM, Li D, Schneider JA. Statistical adjustment of network degree in respondent-driven sampling estimators: venue attendance as a proxy for network size among young MSM. Soc Networks. 2018;54:118–131. [DOI] [PMC free article] [PubMed] [Google Scholar]
- 47.Shanthamallu US, Thiagarajan JJ, Song H, Spanias A. GrAMME: Semisupervised Learning Using Multilayered Graph Attention Models. IEEE Trans Neural Netw Learn Syst. 2019. [DOI] [PubMed] [Google Scholar]
- 48.Valente TW. Network interventions. Science. 2012;337(6090):49–53. [DOI] [PubMed] [Google Scholar]
- 49.Wu Z, Pan S, Chen F, Long G, Zhang C, Philip SY. A comprehensive survey on graph neural networks. IEEE Transactions on Neural Networks and Learning Systems. 2020. [DOI] [PubMed] [Google Scholar]
- 50.Kipf TN, Welling M. Semi-supervised classification with graph convolutional networks. arXiv preprint arXiv:160902907. 2016. [Google Scholar]
- 51.Bahdanau D, Cho K, Bengio Y. Neural machine translation by jointly learning to align and translate. arXiv preprint arXiv:14090473. 2014. [Google Scholar]
- 52.Hosmer DW Jr, Lemeshow S, Sturdivant RX. Applied logistic regression. Vol 398: John Wiley & Sons; 2013. [Google Scholar]
- 53.Liaw A, Wiener M. Classification and regression by randomForest. R news. 2002;2(3):18–22. [Google Scholar]
- 54.Paul RH, Cho KS, Belden AC, et al. Machine-learning classification of neurocognitive performance in children with perinatal HIV initiating de novo antiretroviral therapy. AIDS. 2020;34(5):737–748. [DOI] [PMC free article] [PubMed] [Google Scholar]
- 55.Young SD, Yu W, Wang W. Toward automating HIV identification: machine learning for rapid identification of HIV-related social media data. Journal of acquired immune deficiency syndromes (1999). 2017;74(Suppl 2):S128. [DOI] [PMC free article] [PubMed] [Google Scholar]
- 56.Webber J A programmatic introduction to neo4j. Paper presented at: Proceedings of the 3rd annual conference on Systems, programming, and applications: software for humanity2012. [Google Scholar]
- 57.Shannon P, Markiel A, Ozier O, et al. Cytoscape: a software environment for integrated models of biomolecular interaction networks. Genome research. 2003;13(11):2498–2504. [DOI] [PMC free article] [PubMed] [Google Scholar]
Associated Data
This section collects any data citations, data availability statements, or supplementary materials included in this article.