

Abstract
Chimeric antigen receptor (CAR) T cell therapy has yielded unprecedented outcomes in some patients with hematological malignancies; however, inhibition by the tumor microenvironment has prevented the broader success of CART cell therapy. We used chronic lymphocytic leukemia (CLL) as a model to investigate the interactions between the tumor microenvironment and CART cells. CLL is characterized by an immunosuppressive microenvironment, an abundance of systemic extracellular vesicles (EVs), and a relatively lower durable response rate to CART cell therapy. In this study, we characterized plasma EVs from untreated CLL patients and identified their leukemic cell origin. CLL-derived EVs were able to induce a state of CART cell dysfunction characterized by phenotypical, functional, and transcriptional changes of exhaustion. We demonstrate that, specifically, PD-L1+ CLL-derived EVs induce CART cell exhaustion. In conclusion, we identify an important mechanism of CART cell exhaustion induced by EVs from CLL patients.
Keywords: chimeric antigen receptor T cells, extracellular vesicles, CART cell exhaustion, chronic lymphocytic leukemia, microenvironment
Graphical abstract
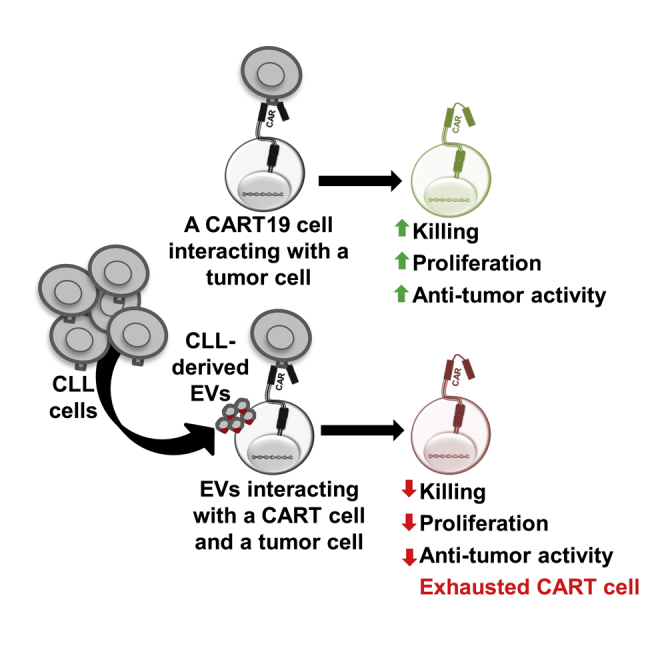
Broad application of chimeric antigen receptor (CAR) T cell therapy is limited by T cell dysfunction, development of T cell exhaustion, and inhibition by the tumor microenvironment. Cox et al. demonstrate that leukemic-derived extracellular vesicles (EVs) interact with CART cells and induce phenotypical, functional, and transcriptional changes of T cell exhaustion.
Introduction
CD19-directed chimeric antigen receptor T (CART19) cell therapy has resulted in remarkable outcomes in B cell malignancies.1, 2, 3 However, durable remissions are achieved in 30%–40% of patients, and most patients relapse within the first 1–2 years.4 Similarly, the initial response rates are 70%–80% in patients with chronic lymphocytic leukemia (CLL),5,6 but the durable responses are only 20%–40%.7 Furthermore, CART cell activity is significantly limited in solid tumors, and objective responses are rarely reported.8 Several key factors have been identified that limit CART cell activity, including tumor antigen escape,9 T cell defects,10 and an immunosuppressive tumor microenvironment.10,11 The last factor is a complex matrix capable of potently inhibiting CART cells and includes myeloid-derived suppressor cells (MDSCs),12 immunosuppressive macrophages,12 regulatory T cells, and cancer-associated fibroblasts.13
We have focused on the CLL immunosuppressive microenvironment in this study since it plays a prominent role in induction of resistance to CART cell therapy. Of importance to our study, CLL is characterized by the abundance of circulating extracellular vesicles (EVs) bearing immunomodulatory properties.14 EVs have been shown to promote leukemic survival in CLL patients, likely facilitated by the interaction between EVs and non-malignant cellular microenvironmental components.14 EVs are known to have robust capabilities to modify host cell function. They have also been found to augment regulatory T cell function, promote MDSCs, and block the maturation of dendritic cells and macrophages.15, 16, 17, 18, 19, 20 In addition, direct mechanisms by which EVs interfere with T cell functions are identified through expression of FasL, resulting in T cell apoptosis in patients with oral cancer.21,22 While the diverse EV interactions between myeloid cells, MSDCs, and regulatory T cells are identified, the effect of tumor-derived EVs on CART cell functions remains largely unknown. Recognizing that CLL is an ideal disease model to study EV impact on CART cells, and given the suboptimal activity of CART cell therapy in CLL, we hypothesized that CLL-derived EVs available to us from patient plasma contribute to CART cell dysfunction. We aimed to interrogate the nature and mechanisms of these interactions using primary EV samples obtained from the blood of CLL patients.
Results
Identification of CLL-derived EVs in patients with CLL
To isolate primary EVs from the plasma of CLL patients (Table S1), we used the guidelines of the International Society of Extracellular Vesicles (ISEV)23 established for the isolation of EVs from blood (see details in Materials and methods). To characterize and enumerate circulating EVs in platelet-poor plasmas of CLL patients, we used nanoscale flow cytometry, which allows for multiparametric detection of submicron particles using fluorescent antibodies. Nanoscale flow cytometry allows for resolution of particles scattering light similarly to polystyrene and silica beads ranging from 110 to 1,000 nm (Figure S1A). By using fluorescent antibodies, EVs can be characterized and enumerated for specific surface markers from platelet-poor plasma. Marker-positive EVs were detected by nanoscale flow cytometry with a size distribution in the same area as 110-nm polystyrene/180-nm silica beads and 300-nm silica beads (Figures S1B–S1I). Total plasma particles and CD5+, CD19+, CD45+, and PD-L1+ EVs were enumerated from the plasma of CLL patients (n = 50) and age-matched healthy individuals (n = 10) (Figures 1A–1E). Figures S1B–S1I depict the EV antigen expression and titration of the specific antibodies by nanoscale flow cytometry. As a positive control for PD-L1 expression on EVs, we used our established PD-L1GFP-expressing cell line 786-O to generate EVs expressing PD-L1.24 Linear quantification of PD-L1+ EVs was observed from concentrations ranging from 1,280 to 256,093 PD-L1+ EVs per microliter (Figure S2).
Figure 1.

Identification of CLL-derived extracellular vesicles (EVs) in patients with CLL
(A–E) Dot plots showing total particle number (A) and EV levels (B–E) measured by nanoscale flow cytometry in platelet-poor plasma isolated from normal individuals (n = 10) and CLL patients (n = 50). (B–E) A panel of fluorescent antibodies was used to enumerate levels of EVs for (B) CD45+, (C) CD19+, (D) CD5+CD19+, and (E) PD-L1+. Values represent number of EVs per microliter transformed in a logarithmic scale (Mann-Whitney test; error bars, SD). (F) Correlation analysis of levels of CLL-derived CD5+CD19+ EVs and PD-L1+ EVs in CLL patients. Pearson correlation coefficient was calculated with a two-tailed p value. (G) Western blot showing expression of three EV-enriched markers (TSG101, CD9, CD81) and PD-L1 in a panel of six EV lysates obtained from platelet-poor plasma of CLL patients. A second band at higher molecular weight was detected for PD-L1 that corresponds to a glycosylated form of the protein. (H) Relative intensity of gel bands for total PD-L1 (left panel) and glycosylated PD-L1 (right panel). Levels of PD-L1 were increased by 1.4-fold (minimum [min]-maximum [max], 1.17–1.77). The glycosylated form of PD-L1 was markedly increased in PD-L1high patients with a 3.0-fold increase (min-max, 1.78–4.37) compared to PD-L1low patients. (I) Correlation analysis of levels of total PD-L1 (left panel) and glycosylated PD-L1 (right panel) between western blot and nanoscale flow cytometric quantification methods. Pearson correlation coefficient was calculated with a two-tailed p value.
No differences were observed for total particle counts in patients with CLL versus normal, age-matched controls (Figure 1A). However, we discovered an abundance of CD45+ EVs (Figure 1B), CD19+ EVs (Figure 1C), and CD5+CD19+ EVs (Figure 1D) in CLL patients. Given that CLL B cells are characterized as CD5+CD19+, the marked increase in levels of double-positive CD5+CD19+ EVs suggested CLL origins (Figure 1D). Additionally, there was a significantly higher concentration of PD-L1+ EVs in CLL patients versus healthy controls (Figure 1E). Importantly, in CLL patients, levels of PD-L1+ EVs were positively correlated with levels of CLL-derived CD5+CD19+ EVs (Pearson r = 0.320, p value = 0.028) (Figure 1F).
To further confirm the phenotype of EVs measured by nanoscale flow cytometry, we selected six CLL patient plasmas with high EV particle counts, and we measured protein expression by western blot. EVs were selected for further analysis from three patients with low levels of PD-L1 (PD-L1low) and three patients with high levels of PD-L1 (PD-L1high). We used a combination of size-exclusion chromatography, ultracentrifugation, and lyophilization prior to lysis and protein extraction and performed immunoblotting for three EV-enriched proteins: CD9, CD81, and TSG10123 (Figure 1G). All samples showed detectable levels for these three EV markers and, importantly, confirmed the presence of PD-L1 in CLL patient-derived EVs (Figures 1G and 1H). Differential expression of PD-L1 was observed in the samples, and densitometry analysis revealed high and low levels of expression correlating positively with our nanoscale flow cytometric findings (Figure 1I).
Altogether, our results demonstrate that EV subpopulations can be detected and enumerated from platelet-poor plasma by nanoscale flow cytometry as verified by immunoblotting. Levels of CLL-derived CD5+CD19+ EVs were positively correlated with levels of PD-L1+ EVs in plasma of CLL patients, suggesting the presence of an immunosuppressive EV phenotype.25
CLL-derived EVs induce a state of CART cell dysfunction
We then sought to determine the direct effect of CLL-derived EVs on CART19 cell effector functions upon stimulation through the CAR with CD19+ target cells.26, 27, 28 To assess these effects, CART19 cells were cultured in increasing concentrations of EVs in platelet-poor plasma from CLL patients (CLL-derived EVs) with the CD19+ mantle cell lymphoma cell line, JeKo-1. We detected a significant alteration of surface inhibitory receptors including increased expression of CTLA-4 and TIM-3 on activated CART19 cells within 24 h of EV co-culture (Figures 2A and 2B). We also noted similar modulation of inhibitory receptors when CART19 cells were stimulated through their T cell receptor (TCR) with CD3/CD8 beads (Figure S3). There was a significant impairment of CART19 cell antigen-specific proliferation (Figure 2C) and antigen-specific killing (Figure 2D) in the presence of CLL-derived EVs. A dose-dependent inhibition of CART cell antigen-specific proliferation was noted when CLL-derived EVs were co-cultured with CART19 cells. Inhibition was significant at EV/CART cell ratios of 100:1 (Figures 2C and 2D) and more profound when higher ratios were used (Figure 2E). Of note, EV/CART cell ratios of 10,000:1 are closer to actual concentrations in patients treated with CART19 cell therapy (see Discussion). This inhibition of CART cell effector functions by CLL-derived EVs was also observed whether CART19 cells were stimulated with the CD19+ JeKo-1 cell line or with CD19+ leukemic cells isolated from CLL patients (Figure S4). Therefore, we used JeKo-1 cells as a surrogate for the remaining experiments.
Figure 2.

CLL-derived EVs induce a state of CART cell dysfunction
(A and B) Inhibitory receptor expression on activated CART cells is upregulated by CLL-derived EVs. CART19 cells were co-cultured for 24 h with JeKo-1 cells with different concentrations of EVs (∗p < 0.05, ∗∗p < 0.01, ∗∗∗p < 0.001, ∗∗∗∗p < 0.0001, one-way ANOVA; error bars, SEM; three biological and two technical replicates, two experiments). (C and D) CART19 cell antigen-specific proliferation and killing of CD19+ JeKo-1 cells were decreased in the presence of CLL-derived EVs (blue triangles) compared to controls (orange squares). EVs/CART19 cells at a 100:1 ratio were co-cultured for 6 h and plated at a 5:1 effector-to-target ratio (E:T ratio) with JeKo-1 cells (∗∗∗∗p < 0.0001, one-way ANOVA; error bars, SEM; three biological and two technical replicates, three experiments). (E) CART19 cell antigen-specific proliferation was further decreased in the presence of CLL-derived EVs at 1,000:1 and 10,000:1 compared to 100:1. EVs/CART cells were co-cultured for 6 h and plated at a 5:1 E:T ratio with JeKo-1 cells (∗p < 0.05, ∗∗∗∗p < 0.0001, one-way ANOVA; error bars, SEM; three biological and two technical replicates, one experiment). (F) Treatment of JeKo-1 cell xenografts with CART19 cells alone (red squares) improved survival compared to CART19 cells co-cultured with CLL-derived EVs (purple triangles) or untransduced (UTD) T cells (blue circles). NOD-SCID-γ−/− mice were engrafted with the CD19+ luciferase+ cell line JeKo-1 (1 × 10⁶ cells intravenous [i.v.] via tail vein injection), and engraftment was confirmed through bioluminescence imaging (total flux, photons [p]/s). Mice were randomized to treatment with (1) UTD T cells, (2) CART19 cells, and (3) CART19 cells co-cultured ex vivo with CLL-derived EVs for 6 h prior to injection. All T cells were washed prior to injection. A single low dose of CART19 cells (2.5 × 10⁵) was injected to induce relapse (∗p = 0.0198, log-rank test; five mice per group).
To validate these findings in vivo, we performed an ex vivo co-culture of CLL-derived EVs with CART19 cells immediately prior to injection in a JeKo-1 xenograft model for relapsed disease. We first determined the duration of co-culture required to induce CART19 cell dysfunction. Our results indicate that EVs are taken by T cells within 4 h (Figure S5A) and that a co-culture of 6 h is sufficient to suppress CART19 cell antigen-specific proliferation (Figure S5B). Longer co-cultures led to more profound inhibition of CART cells. We therefore used a 6-h ex vivo co-culture as the most suitable co-culture setting for the in vivo experiment. In this JeKo-1 xenograft experiment, EV-exposed CART19 cells resulted in significantly decreased survival when compared to control CART19 cells (p = 0.0198, Figure 2F).
EVs from CLL patients induce phenotypical, functional, and transcriptomic changes of exhaustion in T cells
A potential mechanism for the impact of EVs on CART cells is a direct competition between the CD19+ EVs and the CD19+ tumor cells for the CD19-targeted single-chain variable fragment (scFv) on CART19 cells. To exclude effects from this potential competition, we studied the modulation of E-cadherin-directed CART cell functions by CD19+ EVs. We confirmed the lack of E-cadherin expression on CLL-derived EVs using nanoscale flow cytometry (Figure 3A). EVs from CLL patients led to a significant inhibition of E-cadherin-directed CART cell antigen-specific proliferation in the presence of the E-cadherin+ cell line, MCF-7 (Figure 3B). This suggested to us that CLL-EV-induced CART cell inhibition is not mediated by direct engagement of CART19 cell scFv with the CD19 ligand expressed on the surface of EVs.
Figure 3.

EVs from CLL patients induce phenotypical, functional, and transcriptomic changes of exhaustion in T cells
(A) CLL-derived EVs do not express E-cadherin. E-cadherin was measured on EVs derived from normal donor (ND) and CLL patients by nanoscale flow cytometry compared to measurements of CD19 on CLL-derived EVs (∗p < 0.05, one-way ANOVA; error bars, SEM; three to five biological replicates, two technical replicates, one experiment). (B) CLL-derived EVs decrease E-cadherin CART cell antigen-specific proliferation. EVs/CART cells at a ratio of 100:1 were co-cultured for 6 h and plated at an E:T ratio of 5:1 with the E-cadherin+ breast cancer cell line MCF-7 (∗∗∗∗p < 0.0001, one-way ANOVA; error bars, SEM; three biological replicates, two technical replicates). The absolute number of live T cells significantly decreased when E-cadherin CART cells were co-cultured with MCF-7 cells in the presence of CLL-derived EVs (blue triangles) compared to E-cadherin CART cells co-cultured with MCF-7 alone (orange squares). The UTD negative control (pink circles) shows background proliferation. (C and D) CART19 cell transcriptome is modulated by CLL-derived EVs. CART19 cells were co-cultured with irradiated JeKo-1 cells for 24 h at a ratio of 10:1, 1:1, or 0:1 EVs/CART19 cells and then isolated by magnetic sorting (three biological replicates, adjusted p value < 0.05). Gene expression with 10:1 EVs/CART19 cells (green columns) and 1:1 EVs/CART19 cells (blue columns) compared to CART19 cells alone (salmon column). EVs increase the expression of AP-1 (FOS-JUN) and YY1. (E) Principal component analysis of CART19 cell RNA-sequencing samples. Similar gene expression patterns were noted between both 1:1 EV/CART19 cell (blue circles) and 10:1 EVs/CART19 cells (red circles). (F) Ingenuity Pathway Analysis predicts increased activation of the AP-1 pathway (FOS-JUN, orange) in CART19 cells co-cultured with CLL-derived EVs. (G) Gene set enrichment analysis for significantly upregulated genes shows enrichment for pathways associated with CD4 (p = 0.037) and CD8 (p = 0.0033) T cell signaling as well as AP-1 transcription factors (p = 0.0445) (red bars, p < 0.05).
This latter finding as well as increased inhibitory receptor expression on CART cells led us to postulate that EVs induce a state of CART cell dysfunction through modulation of exhaustion pathways. To investigate this mechanism more directly, we interrogated the transcriptome of stimulated CART19 cells in the presence or absence of CLL-derived EVs. CART19 cells were stimulated through the CAR by co-culturing with irradiated JeKo-1 cells. Total RNA sequencing (RNA-seq) of activated CART19 cells highlighted a significant enhanced expression of AP-1 (FOS-JUN) and YY1 gene pathways in EV-exposed antigen-stimulated CART19 cells compared to antigen-stimulated CART19 cells alone (Figures 3C–3F). There were no clear differences between a high or low EV/CART19 cell ratio (Figure 3D). Notably, the AP-1 (FOS-JUN) and YY1 gene pathways are known critical pathways in induction of T cell exhaustion.29,30
We also performed gene set enrichment analysis on the significantly upregulated genes, which was highly robust for pathways such as CD4 and CD8 signaling and AP-1 transcriptional targets (Figure 3G). These findings (Figures 2 and 3) suggest that EVs significantly induce known phenotypical, functional, and transcriptional hallmarks of T cell exhaustion.
CART cell dysfunction is more specific to PD-L1+ CLL-derived EVs
Next, we focused on determining the specific characteristics of CLL-derived EVs that resulted in CART cell dysfunction. Since CART19 cells exhibited an exhausted phenotype after interacting with CLL-derived EVs, we examined the specific effects on anti-tumor efficacy of CART cells induced by PD-L1+ CLL-derived EVs using our JeKo-1 xenograft model (Figures 4A and 4B). An ex vivo co-culture of CART19 cells with PD-L1high CLL-derived EVs resulted in significantly inferior (p = 0.0088) in vivo anti-tumor activity (Figure 4B), whereas an ex vivo co-culture of CART19 cells with PD-L1low CLL-derived EVs did not result in a significant impairment of anti-tumor activity. These experiments indicate that EV-induced CART cell dysfunction may be associated more specifically with PD-L1+ EVs. Finally, to examine whether the interaction between PD-L1 on CLL-derived EVs and PD-1 on CART cells is responsible for CART cell dysfunction, we measured the antigen-specific proliferation of CART19 cells in the presence of PD-L1high CLL-derived EVs with or without PD-L1 blocking antibodies. There was no statistically significant reversal of EV-mediated inhibition of CART19 cells (Figure 4C), suggesting that the interaction is not the predominant mechanism of CART cell dysfunction.
Figure 4.

CART cell dysfunction is facilitated by PD-L1+ CLL-derived EVs
(A and B) CART19 cells alone (red squares) control tumor burden better compared to CART19 cells co-cultured ex vivo with PD-L1high CLL-derived EVs (purple triangles) (∗∗p = 0.0088, two-way ANOVA; error bars, SEM; five mice per group). NOD-SCID-γ−/− mice engrafted with the CD19+luciferase+ cell line JeKo-1 Luc-ZsGreen (1 × 10⁶ cells i.v. via tail vein injection) and engraftment confirmed through bioluminescent imaging (total flux, p/s). Mice were then randomized for treatment with (1) UTD T cells, (2) CART19 cells, (3) CART19 cells co-cultured ex vivo with PD-L1high CLL-derived EVs for 6 h prior to injection, or (4) CART19 cells co-cultured ex vivo with PD-L1low CLL-derived EVs for 6 h prior to injection. A single low dose of CART19 cells (2.5 × 10⁵) was injected to induce relapse. Mice treated with UTD T cells (blue squares) had continued progression of disease. Mice treated with CART19 cells that were pre-cultured with PD-L1low CLL-EVs had a non-statistically significant impairment of anti-tumor activity (green triangles). Mice treated with CART19 cells that were pre-cultured with PD-L1high CLL-EVs had significant impairment of anti-tumor activity. (C) CLL-derived PD-L1high EV impairment of CART19 cells is not significantly reversed by PD-L1 blockade. CART19 cells were co-cultured for 6 h with and without PD-L1high CLL-derived EVs (100:1 EV/CART cell ratio) and with and without anti-PD-L1 antibody. CD19+ JeKo-1 cells were added at an E:T ratio of 5:1. CART19 cell antigen-specific proliferation was significantly impaired in the presence of PD-L1high CLL-derived EVs (p < 0.01, two-way ANOVA). This inhibited CART19 cell antigen-specific proliferation did not improve following a co-culture with anti-PD-L1 antibody (n = 11 biological replicates, two technical replicates, four experiments).
Discussion
CART cell immunotherapy is a highly promising and unique approach to treat human malignancies, but it has been shown to be suboptimal in most patients, especially those with solid tumors.8,31 CART cell exhaustion is an increasingly recognized mechanism of treatment failure.10,32, 33, 34 Herein, we report the relevant finding that CLL-derived EVs from patient plasma are highly potent systemic factors that directly induce features of exhaustion as documented by immunophenotypic, transcriptional, and functional alterations in CART cells. In addition, we show that EV-exposed CART cells result in impaired anti-tumor activity. An important correlated finding is that a subset of CLL-derived EVs (PD-L1high) is highly robust in the induction of CART cell dysfunction in vivo.
Unlike prior reports that suggest tumor-derived EVs mediate apoptosis of T cells upon TCR stimulation,21,35 our experiments suggest that, rather than inducing apoptosis, EVs derived from CLL patients predominantly induce CART cell exhaustion. In particular, one strength of our study is the ability to perform next-generation sequencing on EV-exposed CART cells to uncover the T cell-specific exhaustion pathways modulated by the EVs. YY1 has been shown to bind to the promoter of inhibitory receptors such as PD-1, LAG-3, and TIM-3, as well as associate with the AP-1 pathway, which contributes to T cell exhaustion.30 The growing advancements in genome engineering tools will allow for future studies and strategies to alleviate these EV-induced immunosuppressive effects.
EVs should have a strong potential to play a major role in the disruption of CART cell function based on our observed pre-clinical modulation of CART cell function. It is estimated that there are 1 × 10¹⁰/mL circulating EVs in the blood36 and between 1 × 10³ and 1 × 10⁶ circulating CART cells in the peripheral blood during CART cell expansion.37,38 This suggests that a ratio of up to 10 million EVs to CART cells can exist in CLL patients, providing an abundance of EVs capable of modifying CART cell function.
In these experiments, we used both primary leukemic CD19+ cells from CLL patients as well as the CD19+ mantle cell lymphoma cell line JeKo-1 as a modality to stimulate CART19 cells. We observed that the EV-induced upregulation of inhibitory receptors on CART cells and inhibition of antigen-specific proliferation were similar whether they were stimulated via CLL leukemic B cells or JeKo-1 cells (Figure S4). This suggested to us that EV-induced CART cell dysfunction is not mediated by leukemic cells, but rather by antigen-specific stimulation of CART19 cells when in the presence of EVs. This was also corroborated by our finding that antigen-specific stimulation of E-cadherin-directed CART cells was similarly inhibited in the presence of EVs from CLL patients (Figures 3A and 3B).
The main strength of our experiments is the use of primary blood EVs isolated from patients with CLL as opposed to EVs derived from cell lines. These primary samples more closely mimic the leukemic microenvironment in CLL. We did show that EV/CART cell ratios of 1,000:1 and 10,000:1 induce more profound inhibition of CART cell function. However, since these are primary samples with limited volumes available to us, we used ratios of 10:1 to 100:1 through the experiments in this study and observed CART cell modulation of exhaustion pathways at these lower ratios. In fact, we observed informative modulation of CART cell transcriptome at an EV/CART19 cell ratio of only 1:1.
The exact mechanisms by which CLL-derived EVs induce CART cell dysfunction remain largely unknown. Our study indicates that PD-L1high CLL-derived EVs induce more profound CART cell dysfunction compared to PD-L1low CLL-derived EVs. The lack of significant reversal of CART cell inhibition following PD-L1 blockade suggested to us that intrinsic properties of CLL-derived EVs, rather than inhibitory receptors/ligands interactions, are the predominant drivers of this dysfunction. Experiments to elucidate these mechanisms are ongoing and will be reported in a follow-up study.
Our knowledge of EV influence on the microenvironment, and of immunosuppression in particular, has been advancing. It has been shown previously that EVs isolated from patients with various tumors interact with and promote immunosuppressive properties of MDSCs, regulatory T cells, mesenchymal stromal cells,39,40 and tumor-associated macrophages to generate impaired immune responses.41 Most recently, EVs were found to impair CD4+ CART cell functions against neuroblastoma.42 However, no mechanistic studies were performed, and this report did not describe any in vivo data or characterization of the EVs. Our studies reveal that EVs from CLL patients impair antigen-specific functions of CART cells by inducing their exhaustion pathways. Our future work will include profiling of CLL-derived EVs to identify immunomodulatory proteins that modulate CART cell activity and to develop a strategy to block these interactions.
In summary, these studies illuminate an important mechanism by which circulating CLL-derived EVs lead to CART cell dysfunction in CLL. We speculate that the CLL model for EV suppression of CART cell function extends to other malignancies and that further study with both appropriate pre-clinical tumor models and utilization of other unique human malignancies will more precisely define mechanisms of EV-mediated CART cell dysfunction.
Materials and methods
Preparation of platelet-poor plasma for EVs
Platelet-poor plasma (PPP) samples were prepared following the International Society on Thrombosis and Hemostasis (ISTH), International Society for the Advancement of Science (ISAC), and ISEV recommendations.23 Briefly, 10 mL of peripheral blood was collected in EDTA-coated vacutainers. Centrifugation was performed twice at 2,500 × g at room temperature using lowest deceleration for 15 min to remove platelets and cellular debris. Plasma was aliquoted and stored at −80°C. These PPP preparations from the peripheral blood of untreated CLL patients are the source of the samples called CLL-derived EVs throughout the text.
Immunophenotyping of circulating EVs from human plasma
PPP samples were thawed at 37°C, and 10 μL of PPP was incubated with the following fluorescent antibodies or antibody-matched isotypes for 30 min at room temperature and in the dark: anti-CD45 (304002, BioLegend, San Diego, CA, USA), anti-CD5 (364002, BioLegend, San Diego, CA, USA), anti-CD19 (363002, BioLegend, San Diego, CA, USA), anti-PD-L1 (13684S, Cell Signaling Technology, Danvers, MA, USA), and anti-E-cadherin (147303, BioLegend, San Diego, CA, USA). Following EV labeling, samples were resuspended in filtered PBS (0.22 μm) and analyzed by nanoscale flow cytometry.43
Optimal concentrations for each antibody were determined by antibody titration using two to four PPP samples (Figure S1). All antibodies were conjugated with fluorescent dyes using antibody labeling kits (Thermo Fisher Scientific, Waltham, MA, USA) and according to the manufacturer’s instructions. Final conjugated antibody concentration and degree of labeling were determined by using the NanoDrop One (Thermo Fisher Scientific, Waltham, MA, USA).
Nanoscale flow cytometry
All PPP samples were analyzed by using an A60-Micro-PLUS nanoscale flow cytometer (Apogee Flow Systems, Hemel Hempstead, Hertfordshire, UK). The A60-Micro-PLUS is equipped with a 405-nm laser for light-scatter measurement and two 488- and 638-nm lasers for fluorescence measurements. Before sample analysis, the A60-Micro-PLUS was calibrated using a reference bead mix, as described previously.43 Briefly, polystyrene and silica beads with diameters ranging from 110 to 1,300 nm (Apogee bead mix #1493) were used to evaluate A60-Micro-PLUS sensitivity for light-scatter detection (Figure S1). Light-scatter triggering thresholds were set such that all events falling between 110 and 800 nm were gated as EVs. Non-specific fluorescent backgrounds produced by plasmas incubated with isotype controls were used to gate on antibody-positive EVs. Samples were run in duplicates at a flow rate of 1.5 μL/min for 1 min, resulting in an event rate below 10,000 events per second to avoid coincident particle detection and swarm effect. Quantification of total particles and marker-positive EVs was performed using FlowJo v10 software (FlowJo, Ashland, OR, USA). Particles (including EVs) were gated on large-angle light scattering (LALS) and small-angle light scattering (SALS), and then EV subpopulations were gated on LALS (x axis) and fluorescence intensity (y axis). For sample detection, laser powers were set at 70 mW (405-nm laser), 53 mW (488-nm laser), and 43 mW (638-nm laser). Photomultiplier tube detector voltages for LALS and SALS were set at 300 and 320, respectively. Triggering thresholds for LALS and SALS were set at 20 and 25 (arbitrary units). This methodology was specifically used for the experiments reported in Figure 1. Figure S1 represents the gating strategy used for nanoscale flow cytometry of EVs.
To assess the sensitivity of nanoscale flow cytometry for detection and enumeration of PD-L1+ EVs, 786-O kidney cancer cells were stably transduced with a lentiviral construct expressing PD-L1 tagged with the fluorescent reporter GFP in C terminus (Origene, Rockville, MD, USA).24 After sorting of PD-L1GFP-overexpressing cells, cells were incubated in culture medium supplemented with exosome-depleted FBS (Gibco, Gaithersburg, MD, USA) for 48 h. Culture medium was collected and centrifuged at 2,500 × g for 15 min to remove dead cells and debris. PD-L1GFP+ EVs were concentrated using ultrafiltration centrifugal columns with a cutoff of 100 kDa and following the manufacturer’s instructions (Amicon, Miami, FL, USA). Several dilutions of PD-L1GFP+ EVs were spiked-in PPP of three normal donors followed by incubation with PD-L1 antibodies or antibody-matched isotype. After analysis by nanoscale flow cytometry, PD-L1GFP+ EVs and PD-L1+ EVs detected by anti-PD-L1 were quantified and compared. EVs isolated from 786-O cells genetically knocked out for PD-L1 expression by CRISPR-Cas9 technology were used as negative controls for PD-L1 staining.
EV capture assay
To estimate EV uptake by T cells, an EV capture assay was performed. EVs were thawed at 37°C and concentrated to 2 × 10⁶ EVs/μL. The concentration was measured using nanoscale flow cytometry. 200,000 untransduced (UTD) T cells or CART19 cells were cultured with 20 × 106 EVs per well in a 96-well plate, with a replicate for each collection time point (0, 2, 4, and 6 h). At time of collection, the sample was centrifuged at 300 × g for 5 min to pellet CART19 and UTD T cells. Supernatants were collected and centrifuged at 2,000 × g for 10 min to remove cellular debris and aggregates. Supernatants were analyzed by nanoscale flow cytometry. This methodology was specifically used for the experiments reported in Figure S5.
EV characterization by western blot
To characterize plasma EVs isolated from CLL patient blood (Table S1), we followed the recommendations provided by ISEV.23 Five hundred microliters of PPP was centrifuged at high speed using a Beckman Coulter Optima XPN ultracentrifuge equipped with a Beckman Coulter SW55-Ti rotor. Samples were centrifuged at 100,000 × g for 3 h at 4°C, washed with PBS, and centrifuged again following the same conditions. Pellets were resuspended in 100 μL of radioimmunoprecipitation assay (RIPA) buffer, and protein concentration was measured by a bicinchoninic acid (BCA) protein assay (23225, Thermo Fisher Scientific, Waltham, MA, USA). Thirty micrograms of protein lysates was used for SDS-PAGE electrophoresis. Following transfer, nitrocellulose membranes were blocked with 5% BSA in Tris-buffered saline with Tween 20 (TBST) for 1 h at room temperature. Membranes were incubated overnight at 4°C with the following antibodies: rabbit PD-L1 (E1L3N) XP (13684, Cell Signaling Technology, Danvers, MA, USA) (dilution 1:1,000), rabbit CD81 (H-121) (sc-9158, Abcam, Cambridge, MA, USA) (dilution 1:1,000), rabbit CD9 (EPR2949) (ab195422, Abcam, Cambridge, MA, USA) (dilution 1:1,000), and rabbit TSG101 (EPR7130(B)) (ab125011, Abcam, Cambridge, MA, USA) (dilution 1:1,000). Membranes were washed with TBST and incubated with horseradish peroxidase (HRP)-conjugated secondary antibodies at a dilution of 1:10,000 for 1 h at room temperature followed by revelation using the SuperSignal West Pico Plus chemiluminescence substrate (Thermo Fisher Scientific, Waltham, MA, USA).
Generation of CART19 cells and E-cadherin-directed CART cells
T cells from normal donors were transduced with a replication-incompetent lentiviral vector expressing a second-generation CAR consisting of an anti-CD19 scFv (FMC63) fused to 4-1BB and CD3ζ intracellular domains as previously described27 or encoding a second-generation anti-E-cadherin (clone SC10.178) fused to CD28 and CD3ζ intracellular domains.
Cell lines
The mantle cell lymphoma cell line JeKo-1 was purchased from ATCC (CRL-3006, Manassas, VA, USA). For in vivo experiments, JeKo-1 cells were transduced with a luciferase-ZsGreen lentivirus (Addgene, Cambridge, MA, USA) and sorted to 100% purity. JeKo-1 and JeKo-1 Luc-ZsGreen tested negative for mycoplasma (IDEXX, Columbia, MO, USA). The MCF-7 cell line was a kind gift from the Weroha laboratory, Mayo Clinic. MCF-7 tested negative for mycoplasma (IDEXX, Columbia, MO, USA). Cell lines were cultured in R20 made with RPMI 1640 (Gibco, Gaithersburg, MD, USA), 20% FBS (Corning Life Sciences, Corning, NY, USA), and 1% penicillin-streptomycin-glutamine (Gibco, Gaithersburg, MD, USA). Fresh aliquots of cell lines were thawed at least every 8 weeks (used approximately between passages 2 and 20). The use of recombinant DNA in the laboratory was approved by the Institutional Biosafety Committee (IBC no. HIP00000252).
T cell functional assays
CART19 and JeKo-1 or JeKo-1 cells irradiated at 120 Gy were co-cultured at a 1:1 ratio with or without CLL-derived EVs. T cells for functional assays were cultured in T cell medium containing X-VIVO 15 (Lonza, Walkersville, MD, USA), 10% human serum albumin (Innovative Research, Novi, MI, USA), and 1% penicillin-streptomycin-glutamine (Gibco, Gaithersburg, MD, USA). EVs were co-cultured with CART19 cells at 100:1, 10:1, 5:1, and 1:1 EV/CART cell ratios using three biological replicates of CLL-derived EVs at 37°C, 5% CO2, and then co-cultured with primary CLL cells or JeKo-1 cells as indicated in the specific experiment. Cell supernatant was collected at 24 h, and cells were analyzed by flow cytometry. To assess killing and proliferation, UTD T cells, CART19 cells, and CART19 cells co-cultured with CLL-derived EVs at a 100:1 EV/CART cell ratio were incubated at 37°C, 5% CO2 for 6 h before adding JeKo-1 target cells. To assess proliferation with PD-L1 blockade, CART19 cells were co-cultured with and without CLL-derived EVs at a 100:1 EV/CART cell ratio with and without anti-PD-L1 antibody (atezolizumab, 20 μg/mL) at 37°C, 5% CO2 for 6 h before adding JeKo-1 target cells. Atezolizumab44 was a kind gift from the Haidong Dong laboratory.45 Cells were analyzed by flow cytometry after 48 h of incubation.
Flow cytometric analysis
Extracellular staining was performed by washing cells with flow buffer (PBS, 2% fetal bovine serum [FBS] [v/v], and 1% sodium azide [v/v]) and staining with antibodies for 15 min. Cells were washed again with flow buffer, and cytometric data were acquired using a CytoFLEX flow cytometer (Beckman Coulter, Chaska, MN, USA). Gating was performed using Kaluza version 2.1 (Beckman Coulter, Chaska, MN, USA). Cells were gated by singlet discrimination, and live cells were determined by Live/Dead Aqua staining (L34966, Thermo Fisher Scientific, Waltham, MA, USA). Surface expression of CAR was detected by staining with a goat anti-mouse F(ab′)2 antibody (A21235, Invitrogen, Carlsbad, CA, USA). The following antibodies were used: CD279 (clone EH12.2H7) Brilliant Violet 421 (BV421) (329920, BioLegend, San Diego, CA, USA), CD366 (clone F38-2E2) phycoerythrin (PE) (345006, BioLegend, San Diego, CA, USA), CD223 (clone 3DS223H) fluorescein isothiocyanate (FITC) (11-2239-42, eBioscience, San Diego, CA, USA), CD152 (BNI3) PE-Cy7 (369614, BioLegend, San Diego, CA, USA), and CD3 (clone SK7) allophycocyanin (APC)-H7 (560176, BD Pharmingen, San Diego, CA, USA). Absolute quantification was obtained using volumetric measurement. Figure S6 represents the gating and quantification strategy used for flow cytometric analysis of T cells.
RNA isolation
CART19 and irradiated JeKo-1 cells were co-cultured at a 1:1 ratio for 24 h with CLL-derived EVs at 10:1 and 1:1 EV/CART19 cell ratios. Three biological replicates of CLL-derived EVs were included as well as stimulated and unstimulated CART19 cell controls. CART19 cells were isolated using magnetic sorting with CD4 and CD8 microbeads (catalog nos. 130-045-101 and 130-045-201, Miltenyi Biotec, Auburn, CA, USA). RNA was isolated from the CART19 cells using a QIAGEN miRNeasy micro kit (217084, QIAGEN, Germantown, MD, USA). To account for donor-donor variability, we performed RNA-seq on CART19 cells generated from a specific donor and cultured with EVs derived from multiple CLL patients.
RNA-seq and analysis
Total RNA was prepped with a SMARTer stranded total RNA-seq kit v2, Pico input mammalian (Takara, Mountain View, CA, USA). Total RNA (three samples per lane) was sequenced on an Illumina HiSeq 4000 (Illumina, San Diego, CA, USA). Library preparation and sequencing were performed by the Medical Genome Facility Genome Analysis Core (Mayo Clinic, Rochester, MN, USA). Fastq files were viewed in FastQC v0.11.8 to check for quality. Adaptor sequences were removed using Cutadapt v1.18.46 Output files were re-checked for quality and adaptor removal using FastQC v0.11.8. Raw sequencing data are available at the Gene Expression Omnibus (GEO: GSE147046).
The latest human reference genome (GRCh38) was downloaded from NCBI for this report. Genome index files were generated using STAR v2.5.4b. Paired end reads from the trimmed fastq files were mapped to the genome. HTSeq (Python 3.6.5) was used to generate expression counts for each gene. DESeq2 (R v3.6.1, https://www.R-project.org/) was used to normalize gene counts (geometric mean) and calculate differential expression using adjusted p values <0.05. Heatmap was created using pheatmap (https://cran.r-project.org/web/packages/pheatmap/index.html). Networks were generated using Ingenuity Pathway Analysis v49932394 (QIAGEN, https://www.qiagenbioinformatics.com/products/ingenuity-pathway-analysis). Gene set enrichment analyses were performed using Enrichr (https://maayanlab.cloud/Enrichr/).
In vivo mouse experiments
6- to 8-week-old non-obese diabetic (NOD)-severe combined immunodeficiency (SCID)-interleukin (IL)-2rγ−/− (NSG) mice were purchased from Jackson Laboratory (Bar Harbor, ME, USA) and injected intravenously with 1 × 10⁶ cells from the JeKo-1 Luc-ZsGreen mantle cell lymphoma cell line. Upon engraftment, mice were randomized to receive either (1) UTD T cells, (2) CART19 cells, or (3) CART19 cells co-cultured ex vivo with CLL-derived EVs for 6 h (100:1 EV/CART cell ratio). All conditions were co-cultured for 6 h, washed, and injected at a dose of 2.5 × 10⁵ cells intravenously. Mice were followed with serial bioluminescence imaging to measure tumor burden.
Statistical analyses
All statistics were performed using GraphPad Prism version 7.05 for Windows (GraphPad, La Jolla, CA, USA) or DESeq2. Statistical tests are described in detail in the figure legends. Briefly, a Mann-Whitney test was used to test the hypotheses for EV immunophenotype. One-way ANOVA was used to test the hypotheses for inhibitory receptor expression, proliferation, and killing. Two-way ANOVA was used to test the hypotheses for in vivo tumor burden, and a log-rank test was used to test the hypotheses for in vivo survival. mRNA differential expression multiple hypothesis correction was performed using Benjamini-Hochberg procedure within DESeq2.
Study approvals
Samples were obtained from untreated patients with CLL under an Institutional Review Board (IRB)-approved protocol (IRB no. 1827-00). Animal experimental protocols were approved by the Institutional Animal Care and Use Committee (IACUC no. A1767).
Acknowledgments
This work was supported through grants from the Mayo Clinic Center for Biomedical Discovery (to F.L., N.E.K., and S.S.K.), K12CA090628 (to S.S.K.), the Mayo Clinic K2R Career Development Program (to S.S.K.), the National Comprehensive Cancer Network (to S.S.K.), the Mayo Clinic Center for Individualized Medicine (to S.S.K.), the Foundation Predolin (to S.S.K.), and by the Exact Foundation (to S.S.K.). F.L. is funded by a postdoctoral fellowship from the Fonds de Recherche du Québec - Santé (FRQS). This work was supported in part by the Henry J. Predolin Foundation (to Biobank).
Author contributions
S.S.K. formulated the initial concept. M.J.C., F.L., and S.S.K. designed experiments. M.J.C., R.S., J.C.B., P.H., C.M.R., M.J.H., S.B.C., and M.H. performed CART cell experiments. F.L. and Y.K. performed nanoflow experiments. N.E.K. and S.S.K. supervised the study. M.J.C. and S.S.K. wrote the manuscript. All authors edited and approved the final version of the manuscript.
Declaration of interests
S.S.K. is an inventor on patents in the field of CAR immunotherapy that are licensed to Novartis (through an agreement between the Mayo Clinic, the University of Pennsylvania, and Novartis). M.J.C., R.S., and S.S.K. are inventors on patents in the field of CAR immunotherapy that are licensed to Humanigen (through the Mayo Clinic). S.S.K. is an inventor on patents in the field of CAR immunotherapy that are licensed to Mettaforge (through the Mayo Clinic). S.S.K. receives research funding from Kite, Gilead, Juno, Celgene, Novartis, Humanigen, MorphoSys, Tolero, Sunesis, Leahlabs, and Lentigen. M.J.C., F.L., N.E.K., and S.S.K. are inventors on patents related to this work. N.E.K. receives research funding from Acerta Pharma, BMS, Pharmacyclics, MEI Pharma, and Sunesis. N.E.K. has participated in Advisory Board meetings of Cytomx Therapy, Janssen, Juno Therapeutics, AstraZeneca, and Oncotracker, and on the DSMC for Agios and Cytomx Therapeutics. S.A.P. receives research funding from Pharmacyclics, MorphoSys, Janssen, AstraZeneca, TG Therapeutics, Bristol Myers Squibb, AbbVie, and Ascentage Pharma. S.A.P. has participated in Advisory Board meetings of Pharmacyclics, AstraZeneca, Genentech, Gilead, GlaxoSmithKline, Verastem Oncology, and AbbVie (he was not personally compensated for his participation).
Footnotes
Supplemental information can be found online at https://doi.org/10.1016/j.ymthe.2020.12.033.
Supplemental information
References
- 1.Neelapu S.S., Locke F.L., Bartlett N.L., Lekakis L.J., Miklos D.B., Jacobson C.A., Braunschweig I., Oluwole O.O., Siddiqi T., Lin Y. Axicabtagene ciloleucel CAR T-cell therapy in refractory large B-cell lymphoma. N. Engl. J. Med. 2017;377:2531–2544. doi: 10.1056/NEJMoa1707447. [DOI] [PMC free article] [PubMed] [Google Scholar]
- 2.Porter D.L., Levine B.L., Kalos M., Bagg A., June C.H. Chimeric antigen receptor-modified T cells in chronic lymphoid leukemia. N. Engl. J. Med. 2011;365:725–733. doi: 10.1056/NEJMoa1103849. [DOI] [PMC free article] [PubMed] [Google Scholar]
- 3.Maude S.L., Laetsch T.W., Buechner J., Rives S., Boyer M., Bittencourt H., Bader P., Verneris M.R., Stefanski H.E., Myers G.D. Tisagenlecleucel in children and young adults with B-cell lymphoblastic leukemia. N. Engl. J. Med. 2018;378:439–448. doi: 10.1056/NEJMoa1709866. [DOI] [PMC free article] [PubMed] [Google Scholar]
- 4.Locke F.L., Ghobadi A., Jacobson C.A., Miklos D.B., Lekakis L.J., Oluwole O.O., Lin Y., Braunschweig I., Hill B.T., Timmerman J.M. Long-term safety and activity of axicabtagene ciloleucel in refractory large B-cell lymphoma (ZUMA-1): a single-arm, multicentre, phase 1-2 trial. Lancet Oncol. 2019;20:31–42. doi: 10.1016/S1470-2045(18)30864-7. [DOI] [PMC free article] [PubMed] [Google Scholar]
- 5.Siddiqi T., Soumerai J.D., Dorritie K.A., Stephens D.M., Riedell P.A., Arnason J.E., Kipps J.K., Gillenwater H.H., Gong L., Dubovsky J.A. Rapid undetectable MRD (uMRD) responses in patients with relapsed/refractory (R/R) chronic lymphocytic leukemia/small lymphocytic lymphoma (CLL/SLL) treated with lisocabtagene maraleucel (liso-cel), a CD19-directed CAR T cell product: updated results from Transcend CLL 004, a phase 1/2 study including patients with high-risk disease previously treated with ibrutinib. Blood. 2019;134(Suppl 1):503. [Google Scholar]
- 6.Gauthier J., Hirayama A.V., Hay K.A., Li D., Lymp J., Sheih A. Efficacy and toxicity of CD19-specific chimeric antigen receptor T cells alone or in combination with ibrutinib for relapsed and/or refractory CLL. Biol. Blood Marrow Transplant. 2019;25:S9–S10. [Google Scholar]
- 7.Porter D.L., Hwang W.T., Frey N.V., Lacey S.F., Shaw P.A., Loren A.W., Bagg A., Marcucci K.T., Shen A., Gonzalez V. Chimeric antigen receptor T cells persist and induce sustained remissions in relapsed refractory chronic lymphocytic leukemia. Sci. Transl. Med. 2015;7:303ra139. doi: 10.1126/scitranslmed.aac5415. [DOI] [PMC free article] [PubMed] [Google Scholar]
- 8.June C.H., Sadelain M. Chimeric antigen receptor therapy. N. Engl. J. Med. 2018;379:64–73. doi: 10.1056/NEJMra1706169. [DOI] [PMC free article] [PubMed] [Google Scholar]
- 9.Sotillo E., Barrett D.M., Black K.L., Bagashev A., Oldridge D., Wu G., Sussman R., Lanauze C., Ruella M., Gazzara M.R. Convergence of acquired mutations and alternative splicing of CD19 enables resistance to CART-19 immunotherapy. Cancer Discov. 2015;5:1282–1295. doi: 10.1158/2159-8290.CD-15-1020. [DOI] [PMC free article] [PubMed] [Google Scholar]
- 10.Long A.H., Haso W.M., Shern J.F., Wanhainen K.M., Murgai M., Ingaramo M., Smith J.P., Walker A.J., Kohler M.E., Venkateshwara V.R. 4-1BB costimulation ameliorates T cell exhaustion induced by tonic signaling of chimeric antigen receptors. Nat. Med. 2015;21:581–590. doi: 10.1038/nm.3838. [DOI] [PMC free article] [PubMed] [Google Scholar]
- 11.Stroncek D.F., Ren J., Lee D.W., Tran M., Frodigh S.E., Sabatino M., Khuu H., Merchant M.S., Mackall C.L. Myeloid cells in peripheral blood mononuclear cell concentrates inhibit the expansion of chimeric antigen receptor T cells. Cytotherapy. 2016;18:893–901. doi: 10.1016/j.jcyt.2016.04.003. [DOI] [PMC free article] [PubMed] [Google Scholar]
- 12.Sterner R.M., Kenderian S.S. Myeloid cell and cytokine interactions with chimeric antigen receptor-T-cell therapy: implication for future therapies. Curr. Opin. Hematol. 2020;27:41–48. doi: 10.1097/MOH.0000000000000559. [DOI] [PubMed] [Google Scholar]
- 13.Sakemura R., Cox M.J., Hansen M.J., Hefazi M., Manriquez Roman C., Schick K.J., Tapper E.E., Roman Moreno P., Ruff M.W., Walters D.K. Targeting cancer associated fibroblasts in the bone marrow prevents resistance to chimeric antigen receptor T cell therapy in multiple myeloma. Blood. 2019;134(Suppl 1):865. [Google Scholar]
- 14.Boysen J., Nelson M., Magzoub G., Maiti G.P., Sinha S., Goswami M., Vesely S.K., Shanafelt T.D., Kay N.E., Ghosh A.K. Dynamics of microvesicle generation in B-cell chronic lymphocytic leukemia: implication in disease progression. Leukemia. 2017;31:350–360. doi: 10.1038/leu.2016.217. [DOI] [PMC free article] [PubMed] [Google Scholar]
- 15.Robbins P.D., Morelli A.E. Regulation of immune responses by extracellular vesicles. Nat. Rev. Immunol. 2014;14:195–208. doi: 10.1038/nri3622. [DOI] [PMC free article] [PubMed] [Google Scholar]
- 16.Taylor D.D., Gerçel-Taylor C. Tumour-derived exosomes and their role in cancer-associated T-cell signalling defects. Br. J. Cancer. 2005;92:305–311. doi: 10.1038/sj.bjc.6602316. [DOI] [PMC free article] [PubMed] [Google Scholar]
- 17.Mohammadi S., Yousefi F., Shabaninejad Z., Movahedpour A., Mahjoubin Tehran M., Shafiee A., Moradizarmehri S., Hajighadimi S., Savardashtaki A., Mirzaei H. Exosomes and cancer: from oncogenic roles to therapeutic applications. IUBMB Life. 2020;72:724–748. doi: 10.1002/iub.2182. [DOI] [PubMed] [Google Scholar]
- 18.Wu M., Wang G., Hu W., Yao Y., Yu X.F. Emerging roles and therapeutic value of exosomes in cancer metastasis. Mol. Cancer. 2019;18:53. doi: 10.1186/s12943-019-0964-8. [DOI] [PMC free article] [PubMed] [Google Scholar]
- 19.Li X., Wang X. The emerging roles and therapeutic potential of exosomes in epithelial ovarian cancer. Mol. Cancer. 2017;16:92. doi: 10.1186/s12943-017-0659-y. [DOI] [PMC free article] [PubMed] [Google Scholar]
- 20.Tickner J.A., Urquhart A.J., Stephenson S.A., Richard D.J., O’Byrne K.J. Functions and therapeutic roles of exosomes in cancer. Front. Oncol. 2014;4:127. doi: 10.3389/fonc.2014.00127. [DOI] [PMC free article] [PubMed] [Google Scholar]
- 21.Kim J.W., Wieckowski E., Taylor D.D., Reichert T.E., Watkins S., Whiteside T.L. Fas ligand-positive membranous vesicles isolated from sera of patients with oral cancer induce apoptosis of activated T lymphocytes. Clin. Cancer Res. 2005;11:1010–1020. [PubMed] [Google Scholar]
- 22.Smallwood D.T., Apollonio B., Willimott S., Lezina L., Alharthi A., Ambrose A.R., De Rossi G., Ramsay A.G., Wagner S.D. Extracellular vesicles released by CD40/IL-4-stimulated CLL cells confer altered functional properties to CD4+ T cells. Blood. 2016;128:542–552. doi: 10.1182/blood-2015-11-682377. [DOI] [PubMed] [Google Scholar]
- 23.Théry C., Witwer K.W., Aikawa E., Alcaraz M.J., Anderson J.D., Andriantsitohaina R., Antoniou A., Arab T., Archer F., Atkin-Smith G.K. Minimal information for studies of extracellular vesicles 2018 (MISEV2018): a position statement of the International Society for Extracellular Vesicles and update of the MISEV2014 guidelines. J. Extracell. Vesicles. 2018;7:1535750. doi: 10.1080/20013078.2018.1535750. [DOI] [PMC free article] [PubMed] [Google Scholar]
- 24.Orme J.J., Jazieh K.A., Xie T., Harrington S., Liu X., Ball M., Madden B., Charlesworth M.C., Azam T.U., Lucien F. ADAM10 and ADAM17 cleave PD-L1 to mediate PD-(L)1 inhibitor resistance. OncoImmunology. 2020;9:1744980. doi: 10.1080/2162402X.2020.1744980. [DOI] [PMC free article] [PubMed] [Google Scholar]
- 25.Lawler S.E., Nowicki M.O., Ricklefs F.L., Chiocca E.A. Immune escape mediated by exosomal PD-L1 in cancer. Adv. Biosyst. 2020;4:e2000017. doi: 10.1002/adbi.202000017. [DOI] [PMC free article] [PubMed] [Google Scholar]
- 26.Kenderian S.S., Ruella M., Shestova O., Klichinsky M., Aikawa V., Morrissette J.J., Scholler J., Song D., Porter D.L., Carroll M. CD33-specific chimeric antigen receptor T cells exhibit potent preclinical activity against human acute myeloid leukemia. Leukemia. 2015;29:1637–1647. doi: 10.1038/leu.2015.52. [DOI] [PMC free article] [PubMed] [Google Scholar]
- 27.Sterner R.M., Sakemura R., Cox M.J., Yang N., Khadka R.H., Forsman C.L., Hansen M.J., Jin F., Ayasoufi K., Hefazi M. GM-CSF inhibition reduces cytokine release syndrome and neuroinflammation but enhances CAR-T cell function in xenografts. Blood. 2018;133:697–709. doi: 10.1182/blood-2018-10-881722. [DOI] [PMC free article] [PubMed] [Google Scholar]
- 28.Kenderian S.S., Ruella M., Gill S., Kalos M. Chimeric antigen receptor T-cell therapy to target hematologic malignancies. Cancer Res. 2014;74:6383–6389. doi: 10.1158/0008-5472.CAN-14-1530. [DOI] [PubMed] [Google Scholar]
- 29.Atsaves V., Leventaki V., Rassidakis G.Z., Claret F.X. AP-1 transcription factors as regulators of immune responses in cancer. Cancers (Basel) 2019;11:1037. doi: 10.3390/cancers11071037. [DOI] [PMC free article] [PubMed] [Google Scholar]
- 30.Balkhi M.Y., Wittmann G., Xiong F., Junghans R.P. YY1 upregulates checkpoint receptors and downregulates type I cytokines in exhausted, chronically stimulated human T cells. iScience. 2018;2:105–122. doi: 10.1016/j.isci.2018.03.009. [DOI] [PMC free article] [PubMed] [Google Scholar]
- 31.Martinez M., Moon E.K. CAR T cells for solid tumors: new strategies for finding, infiltrating, and surviving in the tumor microenvironment. Front. Immunol. 2019;10:128. doi: 10.3389/fimmu.2019.00128. [DOI] [PMC free article] [PubMed] [Google Scholar]
- 32.Lynn R.C., Weber E.W., Sotillo E., Gennert D., Xu P., Good Z., Anbunathan H., Lattin J., Jones R., Tieu V. c-Jun overexpression in CAR T cells induces exhaustion resistance. Nature. 2019;576:293–300. doi: 10.1038/s41586-019-1805-z. [DOI] [PMC free article] [PubMed] [Google Scholar]
- 33.Brown C.E., Mackall C.L. CAR T cell therapy: inroads to response and resistance. Nat. Rev. Immunol. 2019;19:73–74. doi: 10.1038/s41577-018-0119-y. [DOI] [PubMed] [Google Scholar]
- 34.Yin Y., Boesteanu A.C., Binder Z.A., Xu C., Reid R.A., Rodriguez J.L., Cook D.R., Thokala R., Blouch K., McGettigan-Croce B. Checkpoint blockade reverses anergy in IL-13Rα2 humanized scFv-based CAR T cells to treat murine and canine gliomas. Mol. Ther. Oncolytics. 2018;11:20–38. doi: 10.1016/j.omto.2018.08.002. [DOI] [PMC free article] [PubMed] [Google Scholar]
- 35.Wieckowski E.U., Visus C., Szajnik M., Szczepanski M.J., Storkus W.J., Whiteside T.L. Tumor-derived microvesicles promote regulatory T cell expansion and induce apoptosis in tumor-reactive activated CD8+ T lymphocytes. J. Immunol. 2009;183:3720–3730. doi: 10.4049/jimmunol.0900970. [DOI] [PMC free article] [PubMed] [Google Scholar]
- 36.Johnsen K.B., Gudbergsson J.M., Andresen T.L., Simonsen J.B. What is the blood concentration of extracellular vesicles? Implications for the use of extracellular vesicles as blood-borne biomarkers of cancer. Biochim. Biophys. Acta Rev. Cancer. 2019;1871:109–116. doi: 10.1016/j.bbcan.2018.11.006. [DOI] [PubMed] [Google Scholar]
- 37.Kalos M., Levine B.L., Porter D.L., Katz S., Grupp S.A., Bagg A., June C.H. T cells with chimeric antigen receptors have potent antitumor effects and can establish memory in patients with advanced leukemia. Sci. Transl. Med. 2011;3:95ra73. doi: 10.1126/scitranslmed.3002842. [DOI] [PMC free article] [PubMed] [Google Scholar]
- 38.Turtle C.J., Hanafi L.A., Berger C., Gooley T.A., Cherian S., Hudecek M., Sommermeyer D., Melville K., Pender B., Budiarto T.M. CD19 CAR-T cells of defined CD4+:CD8+ composition in adult B cell ALL patients. J. Clin. Invest. 2016;126:2123–2138. doi: 10.1172/JCI85309. [DOI] [PMC free article] [PubMed] [Google Scholar]
- 39.Gai C., Pomatto M.A.C., Grange C., Deregibus M.C., Camussi G. Extracellular vesicles in onco-nephrology. Exp. Mol. Med. 2019;51:1–8. doi: 10.1038/s12276-019-0213-7. [DOI] [PMC free article] [PubMed] [Google Scholar]
- 40.Maacha S., Bhat A.A., Jimenez L., Raza A., Haris M., Uddin S., Grivel J.C. Extracellular vesicles-mediated intercellular communication: roles in the tumor microenvironment and anti-cancer drug resistance. Mol. Cancer. 2019;18:55. doi: 10.1186/s12943-019-0965-7. [DOI] [PMC free article] [PubMed] [Google Scholar]
- 41.Muller L., Mitsuhashi M., Simms P., Gooding W.E., Whiteside T.L. Tumor-derived exosomes regulate expression of immune function-related genes in human T cell subsets. Sci. Rep. 2016;6:20254. doi: 10.1038/srep20254. [DOI] [PMC free article] [PubMed] [Google Scholar]
- 42.Ali S., Toews K., Schwiebert S., Klaus A., Winkler A., Grunewald L., Oevermann L., Deubzer H.E., Tüns A., Jensen M.C. Tumor-derived extracellular vesicles impair CD171-specific CD4+ CAR T cell efficacy. Front. Immunol. 2020;11:531. doi: 10.3389/fimmu.2020.00531. [DOI] [PMC free article] [PubMed] [Google Scholar]
- 43.Gomes J., Lucien F., Cooper T.T., Kim Y., Williams K.C., Liao X., Kaufman L., Lagugné-Labarthet F., Kenyon O., Boysen J. Analytical considerations in nanoscale flow cytometry of extracellular vesicles to achieve data linearity. Thromb. Haemost. 2018;118:1612–1624. doi: 10.1055/s-0038-1668544. [DOI] [PubMed] [Google Scholar]
- 44.McGregor B.A., McKay R.R., Braun D.A., Werner L., Gray K., Flaifel A., Signoretti S., Hirsch M.S., Steinharter J.A., Bakouny Z. Results of a multicenter phase II study of atezolizumab and bevacizumab for patients with metastatic renal cell carcinoma with variant histology and/or sarcomatoid features. J. Clin. Oncol. 2020;38:63–70. doi: 10.1200/JCO.19.01882. [DOI] [PMC free article] [PubMed] [Google Scholar]
- 45.Yan Y., Cao S., Liu X., Harrington S.M., Bindeman W.E., Adjei A.A., Jang J.S., Jen J., Li Y., Chanana P. CX3CR1 identifies PD-1 therapy-responsive CD8+ T cells that withstand chemotherapy during cancer chemoimmunotherapy. JCI Insight. 2018;3:e97828. doi: 10.1172/jci.insight.97828. [DOI] [PMC free article] [PubMed] [Google Scholar]
- 46.Martin M. Cutadapt removes adapter sequences from high-throughput sequencing reads. EMBnet J. 2011;17:10–12. [Google Scholar]
Associated Data
This section collects any data citations, data availability statements, or supplementary materials included in this article.