

Abstract
IoT (Internet of Things) devices and smart sensors are used in different life sectors, including industry, business, surveillance, healthcare, transportation, communication, and many others. These IoT devices and sensors produce tons of data that might be valued and beneficial for healthcare organizations if it becomes subject to analysis, which brings big data analytics into the picture. Recently, the novel coronavirus pandemic (COVID-19) outbreak is seriously threatening human health, life, production, social interactions, and international relations. In this situation, the IoT and big data technologies have played an essential role in fighting against the pandemic. The applications might include the rapid collection of big data, visualization of pandemic information, breakdown of the epidemic risk, tracking of confirmed cases, tracking of prevention levels, and adequate assessment of COVID-19 prevention and control. In this paper, we demonstrate a health monitoring framework for the analysis and prediction of COVID-19. The framework takes advantage of Big data analytics and IoT. We perform descriptive, diagnostic, predictive, and prescriptive analysis applying big data analytics using a novel disease real data set, focusing on different pandemic symptoms. This work's key contribution is integrating Big Data Analytics and IoT to analyze and predict a novel disease. The neural network-based model is designed to diagnose and predict the pandemic, which can facilitate medical staff. We predict pandemic using neural networks and also compare the results with other machine learning algorithms. The results reveal that the neural network performs comparatively better with an accuracy rate of 99%.
Keywords: IoT, Big data analytics, Healthcare, Neural network, COVID-19
1. Introduction
In today's world, the data consumed and produced by IoT devices keeps growing exponentially [1]. The interconnected devices are employed in different life sectors and have succeeded by providing considerable benefits to users such as industry, business, finance, transportation, health care, communication, and networks. It is increasingly deployed in healthcare facilities to obtain the use of ever more data from different systems, sources, devices/sensors, and assist through computer vision, artificial intelligence, machine, and deep learning techniques [1]. In this regard, big data analytic makes health services more sustainable and efficient for gearing health services towards early intervention, prevention, and optimal management. Some applications of IoT and big data analytics are depicted in Fig. 1 . In healthcare, big data is concerned with varied and vast meaningful data sets. It is not easy for healthcare providers to process and interpret these massive amounts of data sets using existing tools [2].
Fig. 1.

Applications of big data analytics and IoT in healthcare.
IoT, along with big data analytics, is considered one of the growing technologies in the world. It gives rise to numerous medical applications including medical staff and resource allocation, remote health monitoring, diagnosis, and prediction of diseases at early stages, emergency care services, elderly care, and many others, as illustrated in Fig. 1. Big data analytics helps to analyze patient's information, including past medical issues and upcoming complications. It also yields information about the person's medication previously and likewise helps with continuous disease management. Advancements in data management, particularly cloud computing and visualization, also facilitate health organizations in developing platforms that capture, store, and manipulates large volumes of data more effectively.
The current global challenge of the novel pandemic, i.e., COVID-19, has overtaken the provincial, social, spiritual, conceptual, radical, and pedagogical boundaries [3]. The medical sector is searching for innovative technologies and techniques to control and manage the pandemic's spread. IoT, along with big data analytics, cloud computing, artificial intelligence, machine, and deep learning methods, might empower and sustain the healthcare system and organizations for proper monitoring of pandemic patients. This technology serves to reduce readmission rates in the hospital and increases patient satisfaction. It also assists in identifying high-risk patients, tracking the virus spread, and controlling infection in real-time. Furthermore, it might help to predict fatality risk by effectively examining the patients' prior data. IoT and big data analytics support us in fighting this virus through population screening, notification, medical assistance, and recommendations regarding infection control [4]. This technology can improve the planning, treatment, reported problems of the pandemic patient and serve as an evidence-based medical tool [5].
This paper presented an IoT-based healthcare framework for analysis, prediction, and detection of the pandemic disease, i.e., COVID-19. The framework takes advantage of big data analytic and performs four types of analysis, including descriptive, diagnostic, predictive, and prescriptive. The application of the framework is to give an in-depth analysis of recent pandemic in order to obtain useful information. For prediction and detection purposes, a neural network-based model is used, that might help in the decision making processes for healthcare organizations. The key contribution of this paper is provided as follows:
-
–
An IoT-based health care framework is introduced to analyze, predict, and detect the novel pandemic.
-
–
We have explored four different types of data analysis techniques, including descriptive, diagnostic, predictive, and prescriptive, and provide insight and foresight information of pandemic that might be helpful for physicians.
-
–
We utilized data visualization methods for descriptive and diagnostic analysis and provide insight information about different symptoms of the pandemic.
-
–
For predictive analysis, a Neural network-based method is employed to predict diseases using different symptom attributes that help in decision making.
-
–
We also compare the results of the neural network with different machine learning algorithms.
-
–
Using the results of predictive analysis, prescriptive analysis is provided or users.
The work addressed in this paper is structured as follows: a summary of different IoT and big data analytics based healthcare systems used in Literature is provided in Section 2. Section 3 provides a concise summary of the data sets utilized in this work. The IoT-based framework developed for pandemic analysis, prediction, and detection is also discussed in Section 3. The detail about experimental results is elaborated in Section 4. In Section 5, the general discussion is made above discussed method and different experimental results. The conclusion of the work with future guidelines is provided in Section 6.
2. Literature review
This section offers a brief overview of various works done in the past few years. Sakr et al. [6] provided data analytics based structure for intelligent healthcare services. Their study focused on cloud computing, IoT, sensing technologies, and big data analytics. The authors also discussed different challenges of innovative technology and proposed an architectural framework for smart healthcare. [7] presented a review of several big data frameworks based on analytical capability, information sources, and application areas in healthcare.
Pashazadeh et al. [8] offered a comprehensive study of big data tools used in healthcare applications. Their study included machine learning, cloud-based, agent-based, heuristic-based, and hybrid mechanisms. Abusharekh et al. [9] introduced a specialized analytic framework using health information. [10] used a wireless body area network and proposed an extensive data processing system. The system used wireless body sensors data and achieved the outcomes by utilizing specific features of big data.
Kim et al. [11] investigates different constituents for the regulation of big data in the area of healthcare. They also studied different circumstances to promote the implementation of big data in health maintenance. The authors developed a research framework by considering four areas and collected data from different experts engaged in healthcare IT and big data.
Shahbaz et al. [12] discovered the adoption of big data analytics techniques in healthcare systems and examine factors associated with altruistic intention utilizing the technology acquisition system and task-technology paradigm. The authors employed a questionnaire study and examined 224 valid answers in AMOS v21.
Kamble et al. [13] provided a survey of big data analytics applications in health care management. They analyze the existing literature classified into five research categories: clinical diagnosis and study, global healthcare assistance control system, the transmission of disease, prevention, and health insurance and identifying sectors wherever big data analytics are being implemented in healthcare management.
Milenkovic et al. [14] provided a detailed review indicating the influence of processing and analyzing large quantities of data in the health division. The authors discussed several characteristics of data, including volume, velocity, and variety. Furthermore, they discussed various structures, data analysis, big data concepts, and their importance in health care. [15] provided a comprehensive review of the IoT utilization in healthcare services. [16] studied out recently introduced mechanisms of cloud computing and data handling and processing in healthcare. The authors also discussed the shortcomings and advantages of the different mechanisms and challenges highlighted in need to develop efficient large data processing techniques in healthcare using cloud computing.
Byrne et al. [17] developed a cloud and IoT-based conceptual framework for remote monitoring. [18] presented a review of ten years of big data, data analytics, and healthcare literature. The authors compiled a data set and analyzed the data using the hermeneutic approach. From the analysis, the authors found that big data and analytics tools are useful and suggested a framework that contributed to information systems and technology personnel, health practitioners, and academics.
Santana et al. [19] presented the Internet of Medical Things (IoMT) method for elderly adults. The authors used a heuristic method to assess potential problems and institute an effective system to detect issues along with the design's application. [20] performed empirical and theoretical research on wearable IoMT sensor devices for health monitoring. [21] performed a comprehensive survey on healthcare analysis in big data management, scientific programming, and analytics. [22], presented a cloud computing system for high-end processing hospital information.
Thomas et al. [23] introduced a framework to accurately predict heart disease using a KNN classifier. [24], provide a survey of different data mining methods used in health informatics. [25] suggested a machine learning-based model named Intelligent Heart Disease Prediction System. They used data mining techniques, like Neural networks, Naive-Bayes, and Decision Trees.
[26], used different machine learning methods. In their work, they used Decision Tree, K-Nearest Neighbor, Naive Bayes, Single Conjunctive Rule Learner, Radial Basis Function, Multilayer Perceptron, and Support Vector Machine, independently and in combination with others, via utilizing ensemble machine learning method. [27] also provide a survey about different big data analytics techniques used in health care.
From the literature study [22], [28], [29], [30], [31] researchers presented various IoT and big data analytics methods using wireless sensor-based data. Some provide a survey of different methods such as cloud-based, machine learning-based, utilized in different healthcare frameworks. Few researchers also conduct surveys to promote big data techniques in order to promote IoT and big data applications in healthcare organizations. Numerous discussed different drawbacks and limitations of the developed framework and focused on IoT and big data-based framework for processing a large amount of data. Inspired from these, in this work, we also present an IoT and big data analytics based framework for a healthcare organization that might help pandemic situations.
3. Proposed IoT-based data analytics framework for pandemic analysis and prediction
In this work, an IoT-based healthcare framework is presented for pandemic analysis, prediction, and detection. For experimentation purposes, we used the COVID-19 pandemic data set as a case study. We explored four different types of data analytics techniques for data analysis, including descriptive, diagnostic, predictive, and prescriptive analysis. The overall framework for pandemic analysis and prediction is shown in Fig. 2 . It can be seen that the overall framework is divided into four different analysis modules. The data set has been collected from different hospitals; then, the descriptive analysis is performed that involves the study of general information about different attributes of the data set. In the diagnostic analysis relationship between different attributes is explored using data visualization methods.
Fig. 2.

An IoT based data analytics framework for pandemic analysis, detection, and prediction. The data set is collected from different hospitals, data for analysis four different data analytics techniques are used. The results of the analysis may be sent to experts and finally transmitted to users through server clouds.
For prediction purposes, predictive analysis is performed using different machine learning methods. In this work, we used a neural network model to analyze the data set and build a model that might help medical experts detect and diagnose the virus using symptoms information. In the predictive analysis, the evaluation of the results is performed, and finally, using different techniques, the prediction results are visualized. Prescriptive analysis is performed with the help of expert opinions. It can be seen that the data set is analyzed using different data analytics techniques. The results of different analysis techniques are further sent to medical experts for expert opinions and then may transmit using server clouds to the users. In the following subsections, we provide the detail of the data set and each analysis technique.
3.1. Data set
In this work, we used a structured data set obtained from different hospitals of Khyber-Pakhtunkhwa, Pakistan. It contains almost 26000 records of different patients (males and females) of different age groups. Different attributes or symptoms are used for analysis, prediction, and detection of a pandemic. The target attribute of the data set is the Lab Results and survival of patients after the diagnosis of the virus. A detailed description of each attribute is provided in Table 1 . It can be seen from the table that most attributes are the common symptoms of the disease such as Flu, Fever, Sore throat, Cough, etc. Most of the data set attributes are categorical, e.g., yes is equal to 1 and no is equal to 0; similarly, for Lab results, we used 1 for positive lab test and 0 for negative results. The age attribute is numeric, and the final patient status is the categorical attribute.
Table 1.
Detailed description of collected data set.
| S. No. | Attribute | Attribute information |
|---|---|---|
| 1 | Age | In Years |
| 2 | Gender | Male & Female |
| 3 | Is Patient symptomatic? | Yes & No |
| 4 | Flu | Yes & No |
| 5 | Fever | Yes & No |
| 6 | Fever History | Yes & No |
| 7 | Sore Throat | Yes & No |
| 8 | Cough | Yes & No |
| 9 | Diarrhea | Yes & No |
| 10 | Breathing issue | Yes & No |
| 11 | Headache | Yes & No |
| 12 | Cardiovascular & hypertension | Yes & No |
| 14 | Diabetes | Yes & No |
| 15 | Any travel history in 14 days while symptomatic? | Yes & No |
| 16 | Foreign Travel History | Yes & No |
| 17 | Specimen information | Nasopharyngeal & Oropharyngeal swab |
| 18 | Lab Results | Positive & Negative |
| 19 | Is Home Quarantine? | Yes & No |
| 20 | ICU Admission | Yes & No |
| 21 | Put On Ventilator | Yes & No |
| 22 | Patient Final Status | Expired & Recovered & Active |
3.2. Descriptive analysis
In the descriptive analysis, detailed information about every attribute present in the data set is provided, including the number of attributes, each attribute's feature, and the population size of attributes in the data set. Using visual graphs, the summary or detailed description of the raw data is made that is interpretable by humans. Descriptive analysis is likewise known as the simplest type of analysis. In healthcare, it merely identifies the standard statistics of data; for example, a total number of laboratory tests performed, the average age of patients, the number of males and females suffering from particular diseases, or the average duration/period of stay in the hospital for patients or the number of people recovered from particular diseases. For descriptive analytics, bar or column charts & tables, pie charts, or written narratives are used. The general flow of descriptive analysis is shown in Fig. 3 .
Fig. 3.

Descriptive analysis of data set: the insight information about each attribute is studied using common statistics and different data visualization techniques.
The example of descriptive analysis is shown in Fig. 4 and Fig. 5 . We used the pie graph in order to show the distribution of different attributes of the collected data set. It can be seen from Fig. 4a that most of the patients have positive lab results in the data set. Similarly, the gender distribution information is also depicted in Fig. 4b, it can be analyzed that most patients are male. The final patient status is also depicted in Fig. 4c. Most patients have an active status in the data set; the recovered status of the patients is relatively high compared to expired patients' status.
Fig. 4.

Distribution of attributes. (a) Number of reported positive (1) and negative (0) lab results, (b) number of cases reported in male (0) and female (1), (c) number of cases recovered (0), expired (1) and active (2).
Fig. 5.

Distribution of pandemic symptoms in recorded data set. In the overall data set, mostly records are of symptomatic patients (a). Patients are mostly suffering from different symptoms such as headache flue, fever, fever history, sore throat, cough, and breathing issues.
The distribution of different symptoms attributes of the pandemic, including flu, fever history, sore throat, cough, and breathing issues, is also depicted in Fig. 5. It can be seen from Fig. 5 that most patients are suffered from these symptoms. The visualization of these graphs is beneficial for a medical expert in order to see what is inside the data. It can be seen that the patients having hospital visits during pandemic have the following common symptoms. In Fig. 5a that most patients are symptomatic when reported to hospitals. From Fig. 5, the population size of those patients who have issues of fever, headache, flu, cough, sore throat, and breathing can be easily analyzed.
3.3. Diagnostic analysis
The diagnostic analysis is also considered as an advanced form of data analytics. It helps to examine insight of data that answers the question “Why did it happen?”. It considers different attributes and features information in order to discover the relations. It is likewise known as data discovery, data mining, and correlation techniques. It helps to analyze insight of data and attempts to interpret the causes of events and behaviors. In health care, diagnostic analytics explore the information and make correlations using different attribute information. For example, it may help determine that all of the patients' symptoms, such as high fever, dry cough, flu, and fatigue, point to the same virus agent. In the diagnostic analysis, the symptoms and causes behind the diseases are explored. In Fig. 6 , the general flow of diagnostic analysis is shown. It can be seen that from data, different symptoms of information are gathered in order to find the correlation between different attributes. The diagnostic analysis examples are shown in Fig. 7 . In Fig. 7, we analyzed the Lab results against different attributes; it can be seen that the disease is mostly found in male patients as the positive status (1) of the lab results is high. From Fig. 7a, it can be seen that most of the results for male patients are positive as compared to females. In Fig. 7b, the patient's symptomatic attribute is analyzed against the Lab results. From visualization results, we analyzed that the patients who are symptomatic do not mean they are suffering from pandemic as the number of positive cases is also high in those who are not symptomatic. From visualization results, it can be seen that most of the time, the patients' results are positive (1). In Fig. 7a, the relation between fever and positive and negative lab results is explored. From visualization results, it can be seen that the patients who are suffering from fever have reported positive lab tests. Furthermore, in Fig. 7, the positive lab tests are reported in patients suffering from flu, cough, and sore throat. The patients with past fever history also reported positive pandemic symptoms. From visualization results, we observed that mostly the results of those patients are positive, which are suffering from fever, flu, headache, breathing issues, cough, and sore throat. Fig. 8 shows the distribution of male and female patients having positive and negative lab results. On the y-axis, the number of cases is shown, while on the x-axis, the age distribution can be seen. From visualization results of Fig. 8a and Fig. 8b, it can be analyzed that mostly males and females with the positive lab results are age 40 to 60. Similarly, from Fig. 8c and Fig. 8d, we see that there are a lot of male and female patients have negative lab results are of young between age of 20 to 40. There may be complex and unknown relationships between the variables in the data set. It is essential to discover and quantify the degree to which data set variables are dependent upon each other. To show the relationship between different attributes, we used the correlation graph shown in Fig. 9 . A correlation could be positive if both variables move in the same direction or negative when there is an increase in one variable's value decrease in other variables' values.
Fig. 6.

Diagnostic analysis of data set: involving data discovery and data mining techniques. The relationship between different attributes is analyzed; in our case, we examined the relationship between different symptoms of COVID-19.
Fig. 7.

In the sample figure, using multi-variate analysis method, relation between lab results is analyzed against different attributes. (a) shows the relation between lab results, number of cases, and gender, in (b) the relationship between lab results, the number of reported cases, and the patient who is symptomatic or not. In the rest sample images, the relation between “lab results,” the number of cases, and different disease symptoms are shown. (For interpretation of the colors in the figure(s), the reader is referred to the web version of this article.)
Fig. 8.

Relation between lab results, patient's age and gender. The positive results mean the patient who has been diagnosed with COVID-19. In (a) and (b), the relation between age, gender, and positive lab results can be seen. While in (c) and (d), the negative lab results, gender, and age is shown. It can be seen that the number of positive results in male patients is high.
Fig. 9.

Correlation between different attributes. The relation of each attribute is shown in the form of a matrix. It describes the density or intensity of variables and visualizes each attribute's patterns and variance in the data set. The high-intensity values are shown with blue color.
3.4. Predictive analysis
Predictive analysis helps in the “Prediction” of what might happen in the future using existing data set information. It understands the insights of data and provides possible suggestions to organizations with actionable insights. Moreover, it also gives estimates of the likelihood of a future outcome. The recorded data is fed into a machine or deep learning model that considers the data's key patterns and trends. The model is then applied to current data for prediction. In healthcare, predictive analysis is used for forecasting disease spread rate, the chances of patient survival. The central flow diagram of predictive analysis is shown in Fig. 10 ; it can be seen that individual features are selected from the collected data set. The data set is further separated into train and test sets. The training set is given to the machine learning or deep learning model. The model is trained using features/attribute information. For prediction purposes, the trained model is tested using other sets of data set. The results are evaluated using different evaluation parameters and forwarded to expert for opinions, as shown in Fig. 10.
Fig. 10.

Predictive analysis of data set: including machine learning models. The data set is categorized into train and test split. The training data set is used for training the model. The model is tested using the trained model, the results evaluated, and the results are evaluated at the end.
For predictive analysis, in this work, we used a Neural Network-based model. The overall architecture of the Neural Network model used in this work is described in Fig. 11 . It contains the input layer x, output layer y, and an arbitrary amount of hidden layers containing four neurons. Each layer consists of a set of biases and weights represented as b and W except the output layer. A sigmoid function is used as an activation function of each hidden layer. The fine-tuning of biases and weights from the input data is performed in order to enhance the prediction score of the model. In the training process, each iteration involves the following steps:
-
–
Feed-forward that involve calculation of predicted output y.
-
–
Back-propagation which update the weights and biases.
Fig. 11.

Neural network model used based detection of the pandemic. The data set is fed through input layers for training. The input layers are further connected to hidden layers, which are further connected with the out put layer. The output layer produces the desired results.
Fig. 12 illustrates the process of training of neural network model that comprises two steps i.e., Feed-forward and Back-propagation. The output y of the model is mathematically given as:
| (1) |
In the above equation, W is the weights, and b represent biases that are the only variables that affect the value of output y. For estimation of the loss function, we used a simple loss function calculated as the sum of square errors:
| (2) |
Fig. 12.

Feed-forward and Back-propagation in neural network.
It is the sum of the difference between the actual and each predicted value. To measure the error of prediction loss, Back-propagation is performed. It measures the error of prediction (loss). The derivative of the loss function with respect to the biases and weights is used in order to adjust the weights and biases. It is also known as gradient descent, calculated and given as:
| (3) |
Chain rule is used to estimate the derivative of the loss function, and mathematically given as (In below equation ):
| (4) |
3.5. Prescriptive analysis
Prescriptive analytics take advantage of predictive data results and facilitates users to “prescribe/determine” various possible actions to implement and direct them towards a solution. It tries to evaluate the effect of future decisions and advise possible outcomes before decision making. It forecasts what will happen and explains why it will happen, thereby giving suggestions about actions that take benefit from predicted results. It suggests various courses of action and outlines what the potential implications would be for each. In healthcare, it plays an essential role in the prevention and control of diseases spreading. As shown in Fig. 13 , the results of the predictive model are given to medical experts in order to get a valuable prescription. In our case study, the neural network model results may be sent to medical experts for further analysis and expert opinions. Based on the patients' results, the expert suggests do the patient needs to be hospitalized or medication or need to be isolated. The results are also helpful for those people who have no symptoms and having a negative lab test. It helps in the control of pandemic spreads.
Fig. 13.

Prescriptive analysis of data set: the model results after testing are sent to medical experts for further examination. After performing different data analytics techniques, the results are sent to a medical expert for different opinions. For example, what to do, if the disease is diagnosed. Do the patients with positive results need to be hospitalized, need any medication, and should self-quarantine? The prescriptive analysis also helps in the prevention and control of pandemic spread.
4. Experimental results and performance evaluation
In this section, we firstly discussed the trained neural network model's pandemic prediction and detection output results using different data visualization graphs. Secondly, we used different evaluation parameters to evaluate the performance of the neural network model. Furthermore, we also provide the neural network's comparison results with other machine learning algorithms. Fig. 14 shows the number of positive and negative tests detected by the neural network model. From Fig, it can be observed that the number of positive cases detected by the neural network model is greater than the number of negative tests. These results reveal that the patients with the symptoms, as discussed earlier, having more chances of disease suffering. From Fig. 14, a medical expert can easily analyze and concluded that there are more chances of positive results in patients who are suffering from any of the discussed symptoms, and they can start treating them at early stages without waiting for any results. The results shown in Fig. 14 are not unusual because the data set contains mostly those people records who are suffering from the COVID-19 pandemic.
Fig. 14.

The number of positive and negative COVID-19 cases. In red, the patients who have negative lab results mean they have no diseases can be visualized. At the same time, the green dots represent the number of positive COVID-19 cases.
Similarly, the trained model also helps in predicting the patient's final status after diagnoses of positive lab results of pandemic disease, as depicted in Fig. 15 . As the data is collected from the hospitals, the number of active patients is high compared to recovered and expired patients. However, on the other hand, from Fig. 15, it can also be analyzed that the patients' recovery rate is high that is good for patients. Also, from Fig. 15, it can be analyzed that disease can cause fatal for the patients having the age of 45 and above.
Fig. 15.

Patient's final status (active, recovered, expired). In the figure, three different categorized of patients can be seen, the blue dots represent the number of active cases, the green describes the number of patients who have been recovered, and the red shows the number of expired patients.
To check the impact of each feature on prediction and to know which attributes are used to predict an absolute value and which attribute contributes to how much in that decision making, we used the shap graph as shown in Fig. 16 . It indicates the difference between the prediction and the average prediction. The shap value allows contrasting explanations. Instead of comparing prediction values to the average prediction of the entire data set, it compares a subset or even to a single information point. Fig. 16 displays feature, each contributing to pushing the model output from the base value (average model output over the training data set used for training) to the model output. In prediction, features contributing higher are presented in red, those contributions are lower are presented in blue.
Fig. 16.

Visualization of each attribute contributing in training of neural network from higher to lower. The red color represents those attributes; those highly contribute to training. In comparison, the red represents the low contributed attributes.
We also plotted the dependence plot of each attribute as shown in Fig. 17 . In the plot on the x-axis, we have shap value, i.e., target attribute (Lab Results), that shows the impact of each feature on the model. The color of the dot shows the value of a certain attribute that can be easily interpreted. For example, a patient with symptoms of flu, fever, cough, sore throat, and headache might be suffering from the pandemic disease. Similarly, the patient's final status also shows that the chance of recovery is high.
Fig. 17.

Dependence plot of each attribute, showing the impact of each attribute from high to low on the model.
The performance evaluation of the trained model is analyzed from Fig. 18 and Fig. 19 . The training and testing accuracy of the trained model is shown in Fig. 18. The model is trained using the epoch size of 50. It can be observed from Fig. 18 that the accuracy of the training and testing model is of the discussed Neural Network model is near to 100% shown in Fig. 18. Similarly, in Fig. 19, the training and testing loss can be seen since the loss of the model is improved with training.
Fig. 18.

Training and testing accuracy of the of neural network. It can be seen that after 9th epoch, the accuracy is nearly equals to 1 means 100%.
Fig. 19.
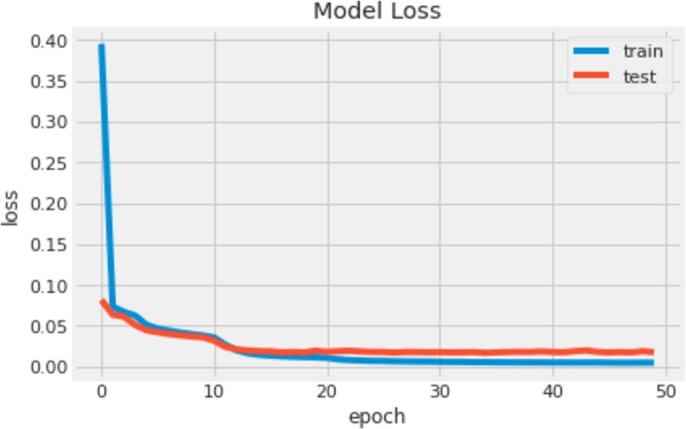
Training and testing loss of neural network. It can be seen that after 12th epoch, the loss of the model decreases significantly.
For evaluation of the model, we used true positive, true negative, false positive, and false negative values in order to calculate the accuracy, precision, and recall. In Fig. 20 , the precision and recall curve can be seen. The precision and recall values of the trained model are nearly equal to 100%. Furthermore, the Fig. 21 shows the true positive and true negative rate of the trained model; the true positive rate of the trained model is high, which shows the effectiveness of the trained model.
Fig. 20.

Precision and recall curve. The high precision and recall values indicated that the model has low false-positive and low false-negative rates, respectively.
Fig. 21.

True positive rate vs false positive rate. The graph is showing a model's performance with a high true positive rate and true positive rate, and false positive rate.
Furthermore, we also compare the results of neural network with other machine learning algorithms by training them on the same data set as shown in Table 1. From the Fig. 22 , it can be observed that almost all machine learning algorithms provide good results with accuracy rate more than 94%. The Precision, Recall, and F1-Score is also plotted for each algorithm, the values reveal that among all neural network outperforms and gives an accuracy of 99%. From the results of Table 2 , it can be seen that the neural network model accuracy is higher as compared to other machine learning algorithms.
Fig. 22.

Average performance evaluation of neural network with other machine learning algorithms. It can be seen that among different machine learning algorithms, the neural network performs better, the average accuracy results are nearly equal to 100%.
Table 2.
Comparison with other machine learning algorithms.
| S. No. | Algorithm | Accuracy | Precision | Recall | F1-Score |
|---|---|---|---|---|---|
| 1 | Adaboost | 0.95 | 0.98 | 0.98 | 0.99 |
| 2 | KNN | 0.96 | 0.97 | 0.97 | 0.99 |
| 3 | Logestic Regression | 0.94 | 0.96 | 0.97 | 0.98 |
| 4 | Naive Bayes | 0.95 | 0.97 | 0.97 | 0.99 |
| 5 | Linear SVM | 0.97 | 0.98 | 0.98 | 0.99 |
| 6 | Neural Network | 0.99 | 0.98 | 0.98 | 1.00 |
5. Discussion
In this work, we used different data analytics techniques and presented a framework for the analysis of pandemic diseases. The framework is based on IoT because the data set is collected from online servers, then different data analysis is performed over the clouds, and the results are also transmitted using Internet and cloud servers. For the case study, we used the COVID-19 data set collected from different hospitals of Khyber Pakhtunkhwa, Pakistan. We performed different data analyses, including descriptive, diagnostic, predictive, and prescriptive.
In the descriptive analysis, we studied the contribution of each attribute in detail. From the descriptive analysis, we observed that most of the male patients are suffered from COVID-19. We also examined different symptoms of diseases and concluded that mostly positive results (have COVID-19) are of patients suffering from different symptoms, e.g., flu, fever, headache, cough, and sore, throat as shown in Fig. 4 and Fig. 5. We also show the relationship between different attributes using diagnostic analysis. In this analysis, we performed multi-variant analysis and study the relation between lab results and different attributes such as gender, age, and different disease symptoms as depicted in Fig. 7. The diagnostic analysis also helps to examine the distribution of each feature and its mean values in the data set, as shown in Fig. 8. We concluded that the people suffering from the pandemic disease are between the ages of 30 and 60.
Similarly, from Fig. 8, it can be seen that the number of male patients is higher than the number of female patients. We also show the correlation between different symptoms and attributes of pandemic data set in Fig. 9. Furthermore, in the predictive analysis, we used the pandemic data set and train a neural network model. The results of predictive analysis are further used for better evaluation and prediction purposes. For example, from the results, it is concluded that patients with symptoms of flu, fever, cough, sore throat, etc., have higher chances of suffering from COVID-19. Based on these results, the medical expert can give a better opinion, as discussed in section 3.5. Also, from the results in Fig. 15, it can be seen that the recovery rate of the patients is high. Using these different data analytic techniques, we can show different data set patterns that might help different health organizations during the pandemic situation. The data analytic techniques also help answer different questions; for example, investigate why pandemic occurs? What are the different symptoms of diseases? How many people (male and female are suffering from the disease)? What is the age group of people who are high suffered? What is the recovery rate? The different data analytic techniques discussed in the paper might assist in taking precaution measures at early stages.
6. Conclusion
The number of (Internet of Things) IoT devices and systems is increasing day by day. These devices and sensors produce a lot of data used in different life sectors such as industry, business, surveillance, healthcare, transportation, communication, and many others. In healthcare, the increasing volumes of information gathered via different devices, sensors, and systems put pressure on physicians. In this work, we take advantage of big data analytics and IoT in order to present a framework for healthcare organizations that might be beneficial in the detection prediction and analysis of pandemic and epidemic diseases. For the case study, we considered the novel coronavirus pandemic (COVID-19) outbreak, which affected people worldwide. The presented framework applications might be helpful in the rapid collection of big data, visualization of pandemic information, breakdown of the pandemic risk, tracking of confirmed cases, tracking of prevention levels, and effectiveness assessment, prevention, and control. We developed a health monitoring framework for the analysis and prediction of COVID-19. Using big data analytics, we perform descriptive, diagnostic, predictive, and prescriptive analysis. From insight analysis of the data, we concluded that most of the patients suffering from the pandemic disease are recovered. We also compared the neural network-based model results with other machine learning algorithms. Without using any computationally expensive deep learning-based model, the neural network-based model achieves 99% accuracy.
Declaration of Competing Interest
The authors declare that they have no known competing financial interests or personal relationships that could have appeared to influence the work reported in this paper.
Acknowledgement
This work was supported under the framework of international cooperation program managed by the National Research Foundation of Korea (NRF-2020K2A9A2A08000177).
References
- 1.Islam S.R., Kwak D., Kabir M.H., Hossain M., Kwak K.-S. The Internet of things for health care: a comprehensive survey. IEEE Access. 2015;3:678–708. [Google Scholar]
- 2.Dineshkumar P., SenthilKumar R., Sujatha K., Ponmagal R., Rajavarman V. 2016 IEEE Uttar Pradesh Section International Conference on Electrical, Computer and Electronics Engineering (UPCON) IEEE; 2016. Big data analytics of IoT based health care monitoring system; pp. 55–60. [Google Scholar]
- 3.Singh R.P., Javaid M., Haleem A., Suman R. Internet of things (IoT) applications to fight against COVID-19 pandemic. Diabetes Metab. Syndr.: Clin. Res. Rev. 2020 doi: 10.1016/j.dsx.2020.04.041. [DOI] [PMC free article] [PubMed] [Google Scholar]
- 4.Vaishya R., Javaid M., Khan I.H., Haleem A. Artificial intelligence (AI) applications for COVID-19 pandemic. Diabetes Metab. Syndr.: Clin. Res. Rev. 2020 doi: 10.1016/j.dsx.2020.04.012. [DOI] [PMC free article] [PubMed] [Google Scholar]
- 5.Joyia G.J., Liaqat R.M., Farooq A., Rehman S. Internet of medical things (IoMT): applications, benefits and future challenges in healthcare domain. J. Commun. 2017;12(4):240–247. [Google Scholar]
- 6.Sakr S., Elgammal A. Towards a comprehensive data analytics framework for smart healthcare services. Big Data Res. 2016;4:44–58. [Google Scholar]
- 7.Palanisamy V., Thirunavukarasu R. Implications of big data analytics in developing healthcare frameworks–a review. J. King Saud Univ, Comput. Inf. Sci. 2019;31(4):415–425. [Google Scholar]
- 8.Pashazadeh A., Navimipour N.J. Big data handling mechanisms in the healthcare applications: a comprehensive and systematic literature review. J. Biomed. Inform. 2018;82:47–62. doi: 10.1016/j.jbi.2018.03.014. [DOI] [PubMed] [Google Scholar]
- 9.Abusharekh A., Stewart S.A., Hashemian N., Abidi S.S.R. 2015 IEEE International Congress on Big Data. IEEE; 2015. H-drive: a big health data analytics platform for evidence-informed decision making; pp. 416–423. [Google Scholar]
- 10.Du Y., Hu F., Wang L., Wang F. 2015 IEEE International Conference on Digital Signal Processing (DSP) IEEE; 2015. Framework and challenges for wireless body area networks based on big data; pp. 497–501. [Google Scholar]
- 11.Kim M.-K., Park J.-H. Identifying and prioritizing critical factors for promoting the implementation and usage of big data in healthcare. Inf. Dev. 2017;33(3):257–269. [Google Scholar]
- 12.Shahbaz M., Gao C., Zhai L., Shahzad F., Hu Y. Investigating the adoption of big data analytics in healthcare: the moderating role of resistance to change. J. Big Data. 2019;6(1):6. [Google Scholar]
- 13.Kamble S.S., Gunasekaran A., Goswami M., Manda J. A systematic perspective on the applications of big data analytics in healthcare management. Int. J. Healthc. Manag. 2018 [Google Scholar]
- 14.Milenkovic M.J., Vukmirovic A., Milenkovic D. Big data analytics in the health sector: challenges and potentials. Manag.: J. Sustain. Bus. Manag. Solut. Emerg. Econ. 2019;24(1):23–33. [Google Scholar]
- 15.Usak M., Kubiatko M., Shabbir M.S., Viktorovna Dudnik O., Jermsittiparsert K., Rajabion L. Health care service delivery based on the Internet of things: a systematic and comprehensive study. Int. J. Commun. Syst. 2020;33(2) [Google Scholar]
- 16.Rajabion L., Shaltooki A.A., Taghikhah M., Ghasemi A., Badfar A. Healthcare big data processing mechanisms: the role of cloud computing. Int. J. Inf. Manag. 2019;49:271–289. [Google Scholar]
- 17.Byrne S., et al. Remote medical monitoring and cloud-based Internet of things healthcare systems. Am. J. Med. Res. 2019;6(2):19–24. [Google Scholar]
- 18.Iyamu T. A framework for selecting analytics tools to improve healthcare big data usefulness in developing countries. S. Afr. J. Inf. Manag. 2020;22(1):1–9. [Google Scholar]
- 19.Santana-Mancilla P.C., Anido-Rifón L.E., Contreras-Castillo J., Buenrostro-Mariscal R. Heuristic evaluation of an IoMT system for remote health monitoring in senior care. Int. J. Environ. Res. Public Health. 2020;17(5):1586. doi: 10.3390/ijerph17051586. [DOI] [PMC free article] [PubMed] [Google Scholar]
- 20.Byerly K., Vagner L., Grecu I., Grecu G., Lăzăroiu G. Real-time big data processing and wearable Internet of medical things sensor devices for health monitoring. Am. J. Med. Res. 2019;6(2):67–72. [Google Scholar]
- 21.Nazir S., Khan S., Khan H.U., Ali S., García-Magariño I., Atan R., Nawaz M. A comprehensive analysis of healthcare big data management, analytics and scientific programming. IEEE Access. 2020 [Google Scholar]
- 22.He C., Jin X., Zhao Z., Xiang T. 2010 IEEE International Conference on Intelligent Computing and Intelligent Systems, vol. 2. IEEE; 2010. A cloud computing solution for hospital information system; pp. 517–520. [Google Scholar]
- 23.Thomas J., Princy R.T. 2016 International Conference on Circuit, Power and Computing Technologies (ICCPCT) IEEE; 2016. Human heart disease prediction system using data mining techniques; pp. 1–5. [Google Scholar]
- 24.Herland M., Khoshgoftaar T.M., Wald R. A review of data mining using big data in health informatics. J. Big Data. 2014;1(1):1–35. [Google Scholar]
- 25.Palaniappan S., Awang R. 2008 IEEE/ACS International Conference on Computer Systems and Applications. IEEE; 2008. Intelligent heart disease prediction system using data mining techniques; pp. 108–115. [Google Scholar]
- 26.Pouriyeh S., Vahid S., Sannino G., De Pietro G., Arabnia H., Gutierrez J. 2017 IEEE Symposium on Computers and Communications (ISCC) IEEE; 2017. A comprehensive investigation and comparison of machine learning techniques in the domain of heart disease; pp. 204–207. [Google Scholar]
- 27.Harerimana G., Jang B., Kim J.W., Park H.K. Health big data analytics: a technology survey. IEEE Access. 2018;6:65661–65678. [Google Scholar]
- 28.Poornima S., Pushpalatha M. A survey of predictive analytics using big data with data mining. Int. J. Bioinform. Res. Appl. 2018;14(3):269–282. [Google Scholar]
- 29.Raihan M., Islam M.M., Ghosh P., Shaj S.A., Chowdhury M.R., Mondal S., More A. 2018 21st International Conference of Computer and Information Technology (ICCIT) IEEE; 2018. A comprehensive analysis on risk prediction of acute coronary syndrome using machine learning approaches; pp. 1–6. [Google Scholar]
- 30.Ramalingam V., Dandapath A., Raja M.K. Heart disease prediction using machine learning techniques: a survey. Int. J. Eng. Technol. 2018;7(2.8):684–687. [Google Scholar]
- 31.Bates D.W., Saria S., Ohno-Machado L., Shah A., Escobar G. Big data in health care: using analytics to identify and manage high-risk and high-cost patients. Health Aff. 2014;33(7):1123–1131. doi: 10.1377/hlthaff.2014.0041. [DOI] [PubMed] [Google Scholar]