

Abstract
Purpose:
To determine whether objective volumetric whole-lesion apparent diffusion coefficient (ADC) distribution analysis improves upon the capabilities of conventional subjective small region-of-interest (ROI) ADC measurements for prediction of renal cell carcinoma (RCC) subtype.
Methods:
This IRB-approved study retrospectively enrolled 55 patients (152 tumors). Diffusion-weighted imaging DWI was acquired at b values of 0, 250, and 800 s/mm2 on a 1.5T system (Aera, Siemens Healthcare). Whole-lesion measurements were performed by a research fellow and reviewed by a fellowship-trained radiologist. Mean, median, skewness, kurtosis, and every 5th percentile ADCs were determined from the whole-lesion histogram. Linear mixed models that accounted for within-subject correlation of lesions were used to compare ADCs among RCC subtypes. Receiver-operating characteristic (ROC) curve analysis with optimal cutoff points from the Youden index was used to test the ability of ADCs to differentiate clear cell RCC (ccRCC), papillary RCC (pRCC), and oncocytoma subtypes.
Results:
Whole-lesion ADC values were significantly different between pRCC and ccRCC, and between pRCC and oncocytoma, demonstrating strong ability to differentiate subtypes across the quantiles (both P < 0.001). Best percentile ROC analysis demonstrated AUC values of 95.2 for ccRCC vs. pRCC; 67.6 for oncocytoma vs. ccRCC; and 95.8 for oncocytoma vs. pRCC. Best percentile ROC analysis further indicated model sensitivities/specificities of 84.5%/93.1% for ccRCC vs. pRCC; 100.0%/10.3% for oncocytoma vs. ccRCC; and 88.5%/ 93.1% for oncocytoma vs. pRCC.
Conclusion:
The objective methodology of whole-lesion volumetric ADC measurements maintains the sensitivity/ specificity of conventional expert-based ROI analysis, provides information on lesion heterogeneity, and reduces observer bias.
Keywords: Apparent diffusion coefficients, Renal cell carcinoma, Subtype differentiation, Diffusion, weighted imaging
Diffusion-weighted imaging (DWI) is an MRI technique that incorporates two opposite diffusion gradients to detect Brownian motion, the random thermal motion of water molecules in tissues. DWI has become a mainstay of abdominal imaging, as it reflects changes in tissue cellularity, and organization and integrity of cellular membranes, the features which limit the free diffusion of water [3–7]. As such, DWI can often detect cellular changes in pathological tissues before traditional imaging, improving detection of neoplasms [4, 7]. ADC values, calculated as the slope of the inverse logarithm of the relative signal intensity of two b-values, are a quantitative representation of lesion structure and heterogeneity [8, 9]. Conventional ADC analysis consists of manually drawing a small region-of-interest (ROI) in the tumor section with the lowest ADC values, an approach that is prone to observer bias and may not be representative of lesion heterogeneity [3].
Renal cell carcinoma (RCC) is a large umbrella of renal neoplasms which comprises 85% of all renal lesions and 3% of all adult cancers [1, 10, 11]. Due to the increasing utilization of CT and MRI imaging, incidental discovery of renal lesions has greatly increased over the last decade [1, 11–13]. Currently, 50% of renal lesions are discovered incidentally [11]. Traditional treatment is surgical excision through nephron-sparing or radical nephrectomy [11, 12]. However, up to one-third of lesions removed are proven benign or indolent upon pathologic examination [1–3]. The advent of less-invasive surgical methods, such as cryoablation, has created a need for more accurate diagnostics that can predict tumor subtype [3, 12, 13]. Accurate radiologic determination of subtype is crucial to personalizing treatment and improving outcomes, as papillary (pRCC), clear cell RCC (ccRCC), and oncocytomas differ in aggressiveness and response to treatment [4, 5, 13]. Therefore, we hypothesized that a whole-lesion volumetric model would increase the objectivity of ADC measurement while retaining the predictive capabilities of traditional ADC measurement models.
Materials and methods
Patient selection
This retrospective study was performed at the National Institutes of Health (Bethesda, MD) using images acquired under Health Insurance Portability and Accountability Act (HIPAA)-compliant, previously Institutional Review Board (IRB)-approved protocols. The patient cohort was determined through the use of the actively maintained urology oncology branch-imaging database (UOB-ID) for patients scanned between April 2015 and January 2017. Workflow is demonstrated in Fig. 1.
Fig. 1.

ADC patient cohort workflow.
The initial cohort consisted of 88 patients with 246 lesions. Of these 246 lesions, however, 22 lesions were excluded due to size, and 72 lesions were excluded due to scanner type, leaving a final cohort that consisted of 55 patients with a total of 152 lesions to be included in this study. Average age was 53 ± 14 years (range 25–76). The cohort was comprised of 21 males with an average age of 53 ± 13 years (range 31–74) and 34 females with an average age of 53 ± 15 years (range 25–76). Patient demographics are represented in Table 1.
Table 1.
Distribution of patient cohort by sex and age for tumor subtype
| All (n = 55) | RCC clear cell (n = 39) | RCC papillary (n = 11) | Oncocytoma (n = 5) | ||
|---|---|---|---|---|---|
| Male (%) | 21 (38.2) | 12 (30.8) | 6 (54.5) | 3 (60.0) | 0.25 |
| Female (%) | 34 (61.8) | 27 (69.2) | 5 (45.5) | 2 (40.0) | |
| Age (range) | 55 (47–63) | 51 (36–59) | 62 (56–63) | 67 (61–74)* | 0.01 |
Student’s t test demonstrated post-hoc significance of oncocytomas vs. olear cell RCC
RCC, renal cell carcinoma
Post hoc P < 0.05 vs. clear cell RCC
Image acquisition
All scans were acquired using body matrix phased-array coils. A single dose of gadobutrol (Gadavist, Bayer, Washington DC) was administered at a dosage of 0.1 mmol/kg followed by a 20 mL saline flush. After injection of contrast, images were acquired during the corticomedullary phase (20 s), nephrogenic phase (70 s), and excretory phase (3 min). Patients underwent the following routine imaging sequences in addition to the DWI images: multiplanar T2-weighted images and pre-and post-contrast T1-weighted images were obtained. DWI imaging (TR/TE 11400/62 ms, slice thickness 6.0 mm, transversal position, FOV 350 mm, matrix 128 × 128) was acquired at b values of 0, 250, and 800 s/ mm2 prior to the administration of contrast. Sequences were run under an Echo Planar Imaging (EPI) protocol to reduce the artifacts of bowel peristalsis and respiratory motion. All ADC value measurements were calculated using a mono-exponential equation.
Image analysis
Whole-lesion segmentation was performed on solid and complex cystic lesions. For each lesion, whole-lesion ROIs were drawn for each slice of the lesion using the software PACS. Using the histogram, measures such as the volume, median, mean, skewness, kurtosis, and quantiles were extracted for each lesion, along with ADC values for every 5th percentile. Volumetric measurements of all lesions were recorded by a research fellow and reviewed by a fellowship-trained radiologist with 4 years of experience in abdominal imaging.
Statistical analysis
All statistical analyses were performed using R Statistical Software (Foundation for Statistical Computing, v3.3.1, Vienna, Austria). Data were tested for normal distribution with the Shapiro—Wilk test to determine if mean ± standard deviation could be used for generation of the summary statistics for continuous data. Linear mixed models that accounted for within-subject correlations were used to examine whether mean ADC values could be used to differentiate renal tumor subtypes. The fixed effect predictors included indicator variables for tumor subtype (clear cell RCC, oncocytoma, and papillary RCC). To account for the correlation of measurements within a subject, we included a random effect for patient. The results were calculated by using the R “lme4” package [14]. Receiver-operating characteristic (ROC) curve analysis was performed to examine differences in performance and sensitivity for subtype differentiation for a distribution of quantile measurements, including the traditionally examined mean. Each ROC curve was constructed using the ADC value at each specified quantile from the histogram of each lesion. ROC curve analysis was performed, and the area under the ROC curve (AUC) was estimated to test the ability of each ADC parameter (mean, percentiles, skewness, kurtosis, interquartile range (IQR), and standard deviation (SD)) to differentiate tumor subtypes (ccRCC vs. oncocytoma, ccRCC vs. pRCC, and oncocytoma vs. pRCC). The 95% confidence interval (CI) of each AUC was estimated and compared with the R “pROC” package using the DeLong method [15, 16]. The optimal cutoff point for subtype differentiation was defined in terms of maximum sensitivity and specificity from the corresponding ROC analysis by means of the Youden index [17]. The Youden index (J) is defined as J = sensitivity + specificity-1, with complete separation of distributions indicated by a value of J = 1 and complete overlap indicated by a value of J = 0 [17, 18]. A two-sided P value < 0.05 was considered to represent a significant difference.
Results
Lesion and patient characteristics
The cohort was divided into three histologic subtypes including oncocytoma (5 patients, 26 lesions), ccRCC (36 patients, 97 lesions), and pRCC type I (11 patients, 29 lesions). Age and sex distributions for each lesion type are provided in the supplementary material. Average tumor volume for pRCC was 1252 ± 2219 mm3 (range 87–9235 mm3), oncocytoma 1036 ± 1022 mm3 (range 44–4018 mm3), and ccRCC 674 ± 708 mm3 (range 71–4157 mm3). 14 lesions were pathologically confirmed through an interventional radiology needle-guided biopsy, and 138 lesions were pathologically confirmed after excision during partial nephrectomy. Average days between imaging and surgery was 45 ± 46 days (range 1–148 days).
ADC values for differentiating tumor subtype
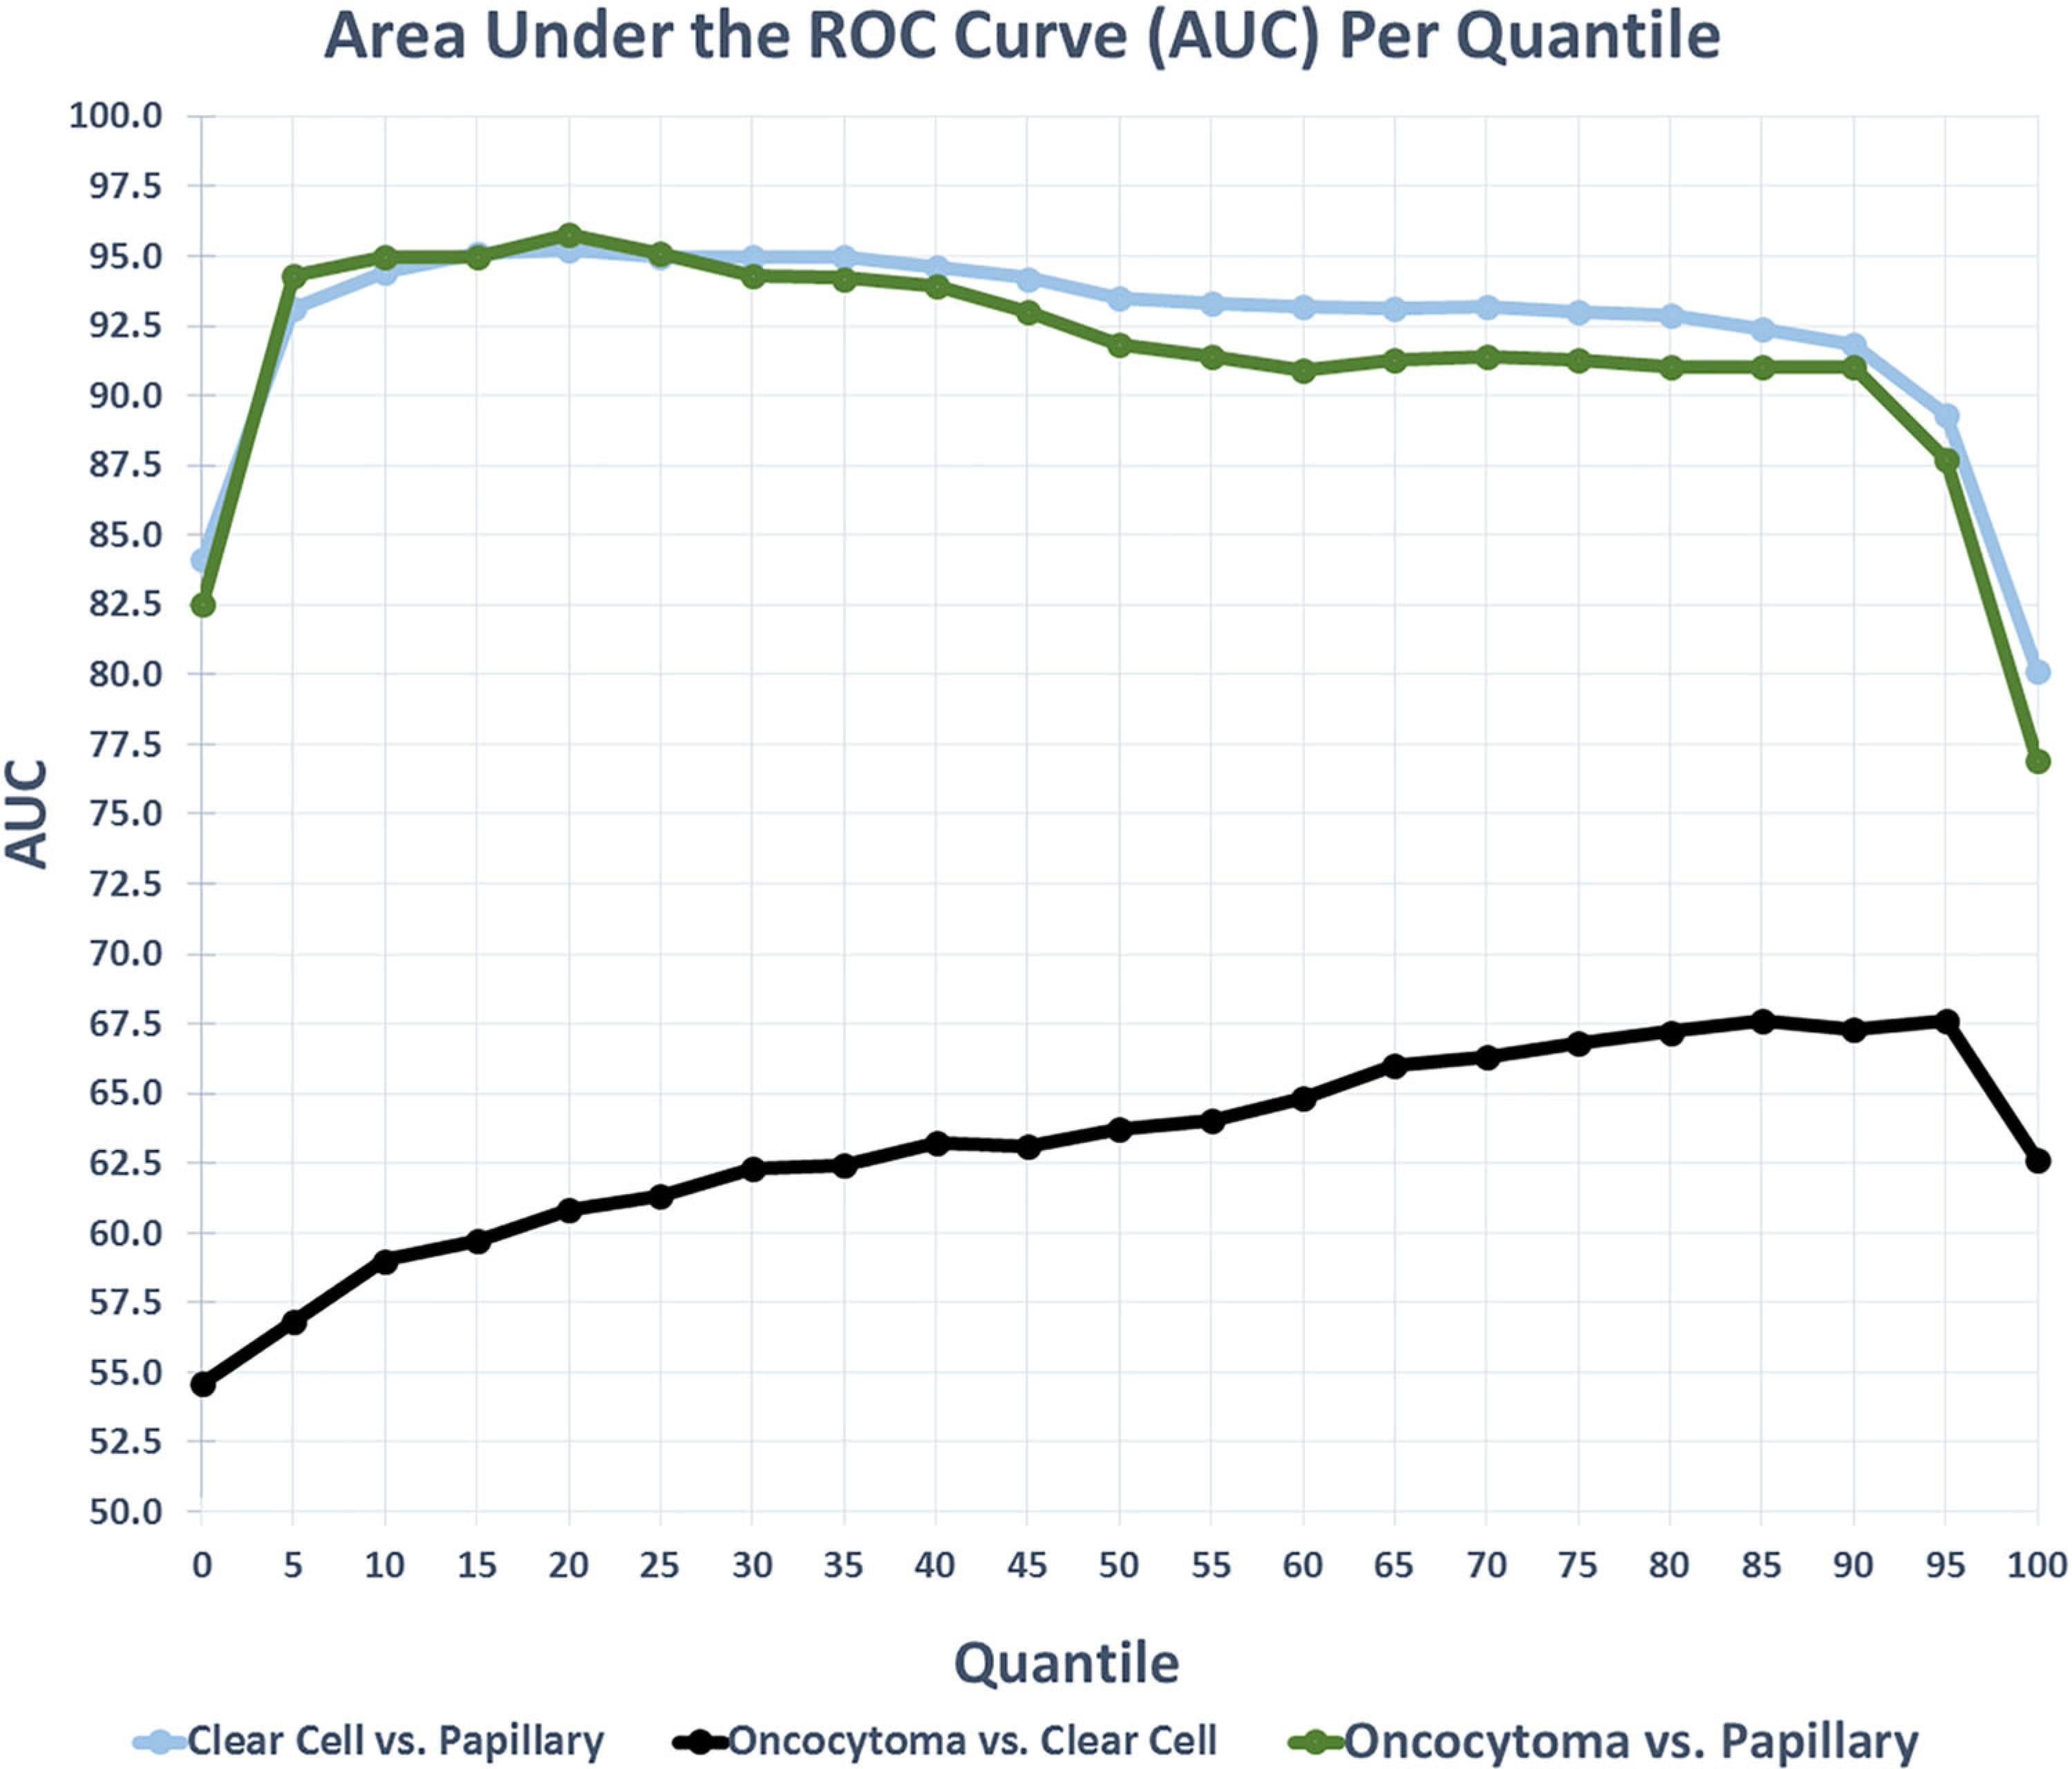
The use of ADC values for differentiating renal tumor subtypes demonstrated significant differences in ADC values between pRCC and ccRCC, and between pRCC and oncocytoma (P < 0.001). However, no significant difference in average ADC values was found between oncocytomas and ccRCC (Fig. 2) using a linear mixed model. Average ADC values of each tumor type are provided in Table 2. In the comparison of ccRCC and pRCC, the plot of ROC AUC values (Fig. 3) is relatively, consistently high, with a slightly negative slope indicating no strong best value. The mean had the highest Youden Index (J = 0.80) with an optimal cutoff ADC value of 1.67. In the comparison between oncocytoma and pRCC type I, the AUC plot was similar; however, in this model, the 5th percentile had the highest Youden Index (J = 0.85) with an optimal cutoff ADC value of 1.20. In the comparison of oncocytoma and ccRCC, the AUC curve was relatively flat, consistently low, with a slightly positive slope, again indicating no strong best value, but improved performance among the higher quantiles. Apart from kurtosis, the 100th percentile had the highest Youden Index (J = 0.15) with an optimal cutoff ADC value of 2.28. Characteristics for every 5th percentile, including sensitivity, specificity, skewness, kurtosis, IQR, SD, and AUC are provided in the supplemental material. ROC curves are provided in Fig. 4. ADC histograms are provided below, ROC Plots and Sensitivity plots for each subtype are provided in the supplemental material.
Fig. 2.
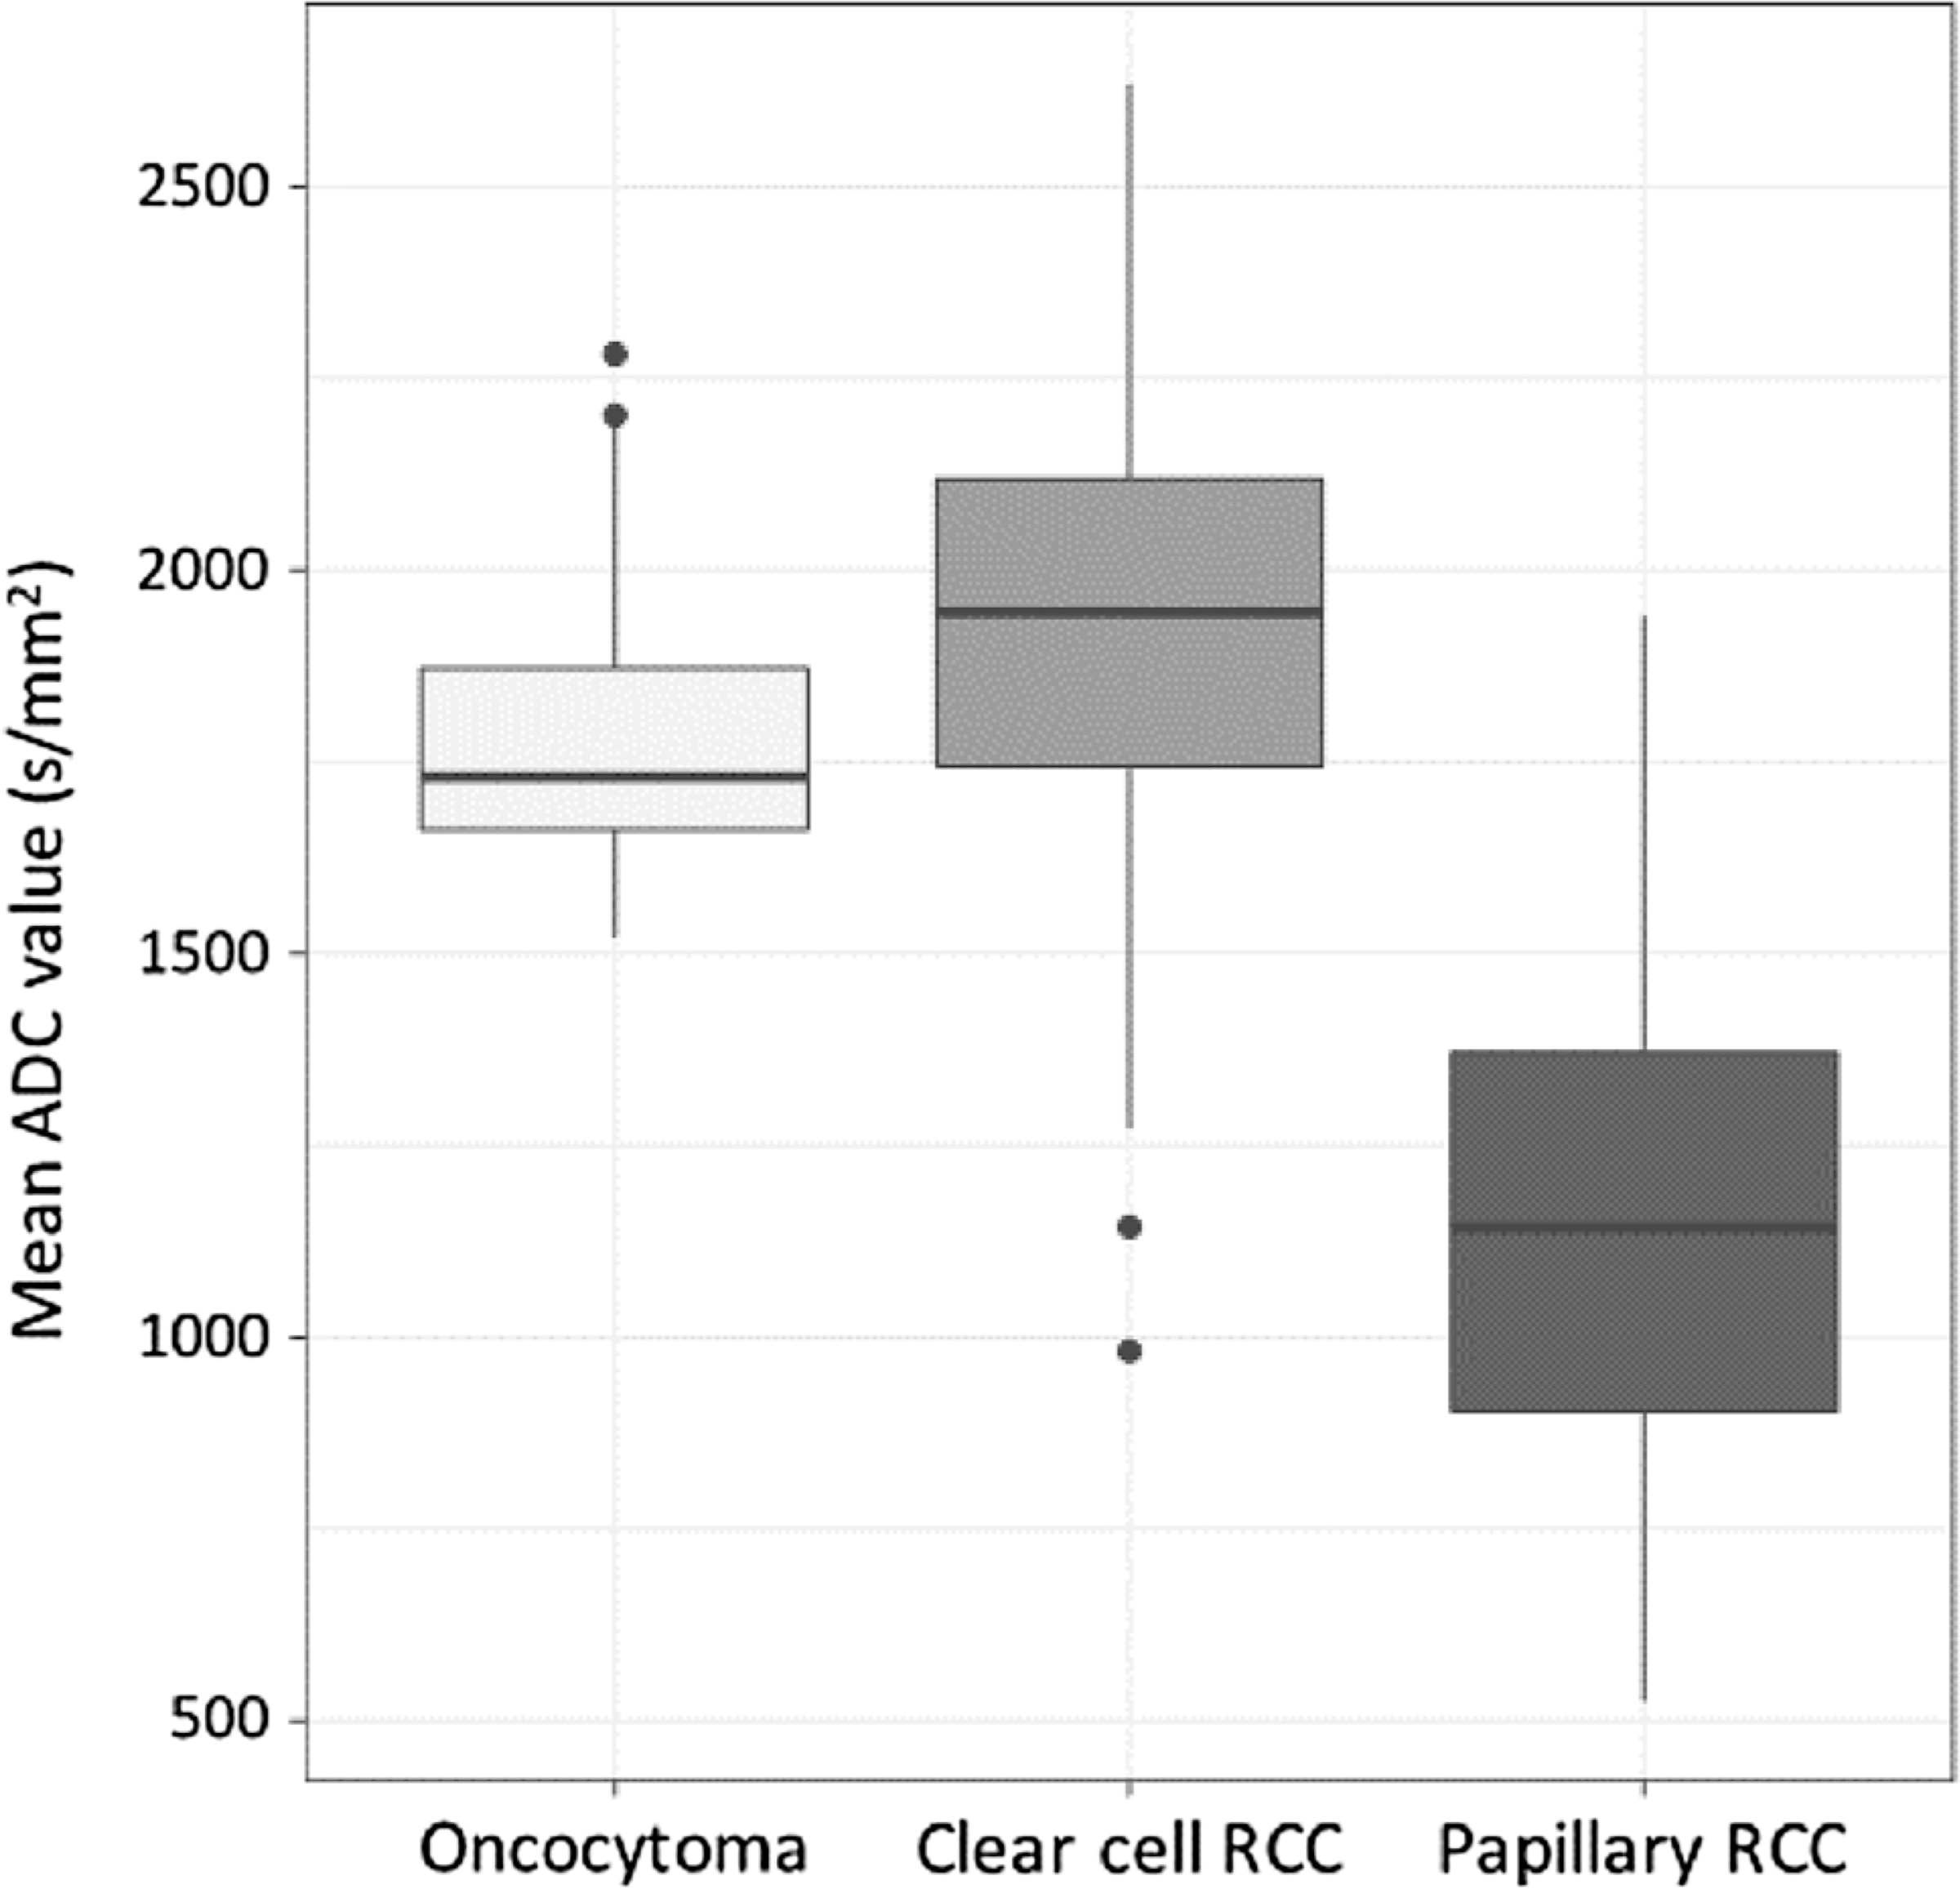
Box and Whisker Plots of ADC value distributions among the subtypes. As illustrated, papillary RCC and clear cell RCC, and papillary RCC and oncocytomas were significantly different. However, oncocytomas and clear cell RCC did not demonstrate significant differences in ADC values.
Table 2.
Average ADC values for each tumor type
| Tumor type | ADC (mm2/s, Mean ± SD) |
|---|---|
| Oncocytoma | 1.81 ± 0.21 |
| Clear cell RCC | 1.91 ± 0.29 |
| Papillary RCC | 1.16 ± 0.34 |
ADC, apparent diffusion coefficient
Fig. 3.
AUC distribution per quantile for each model demonstrating overall model performance and best-performing quantile.
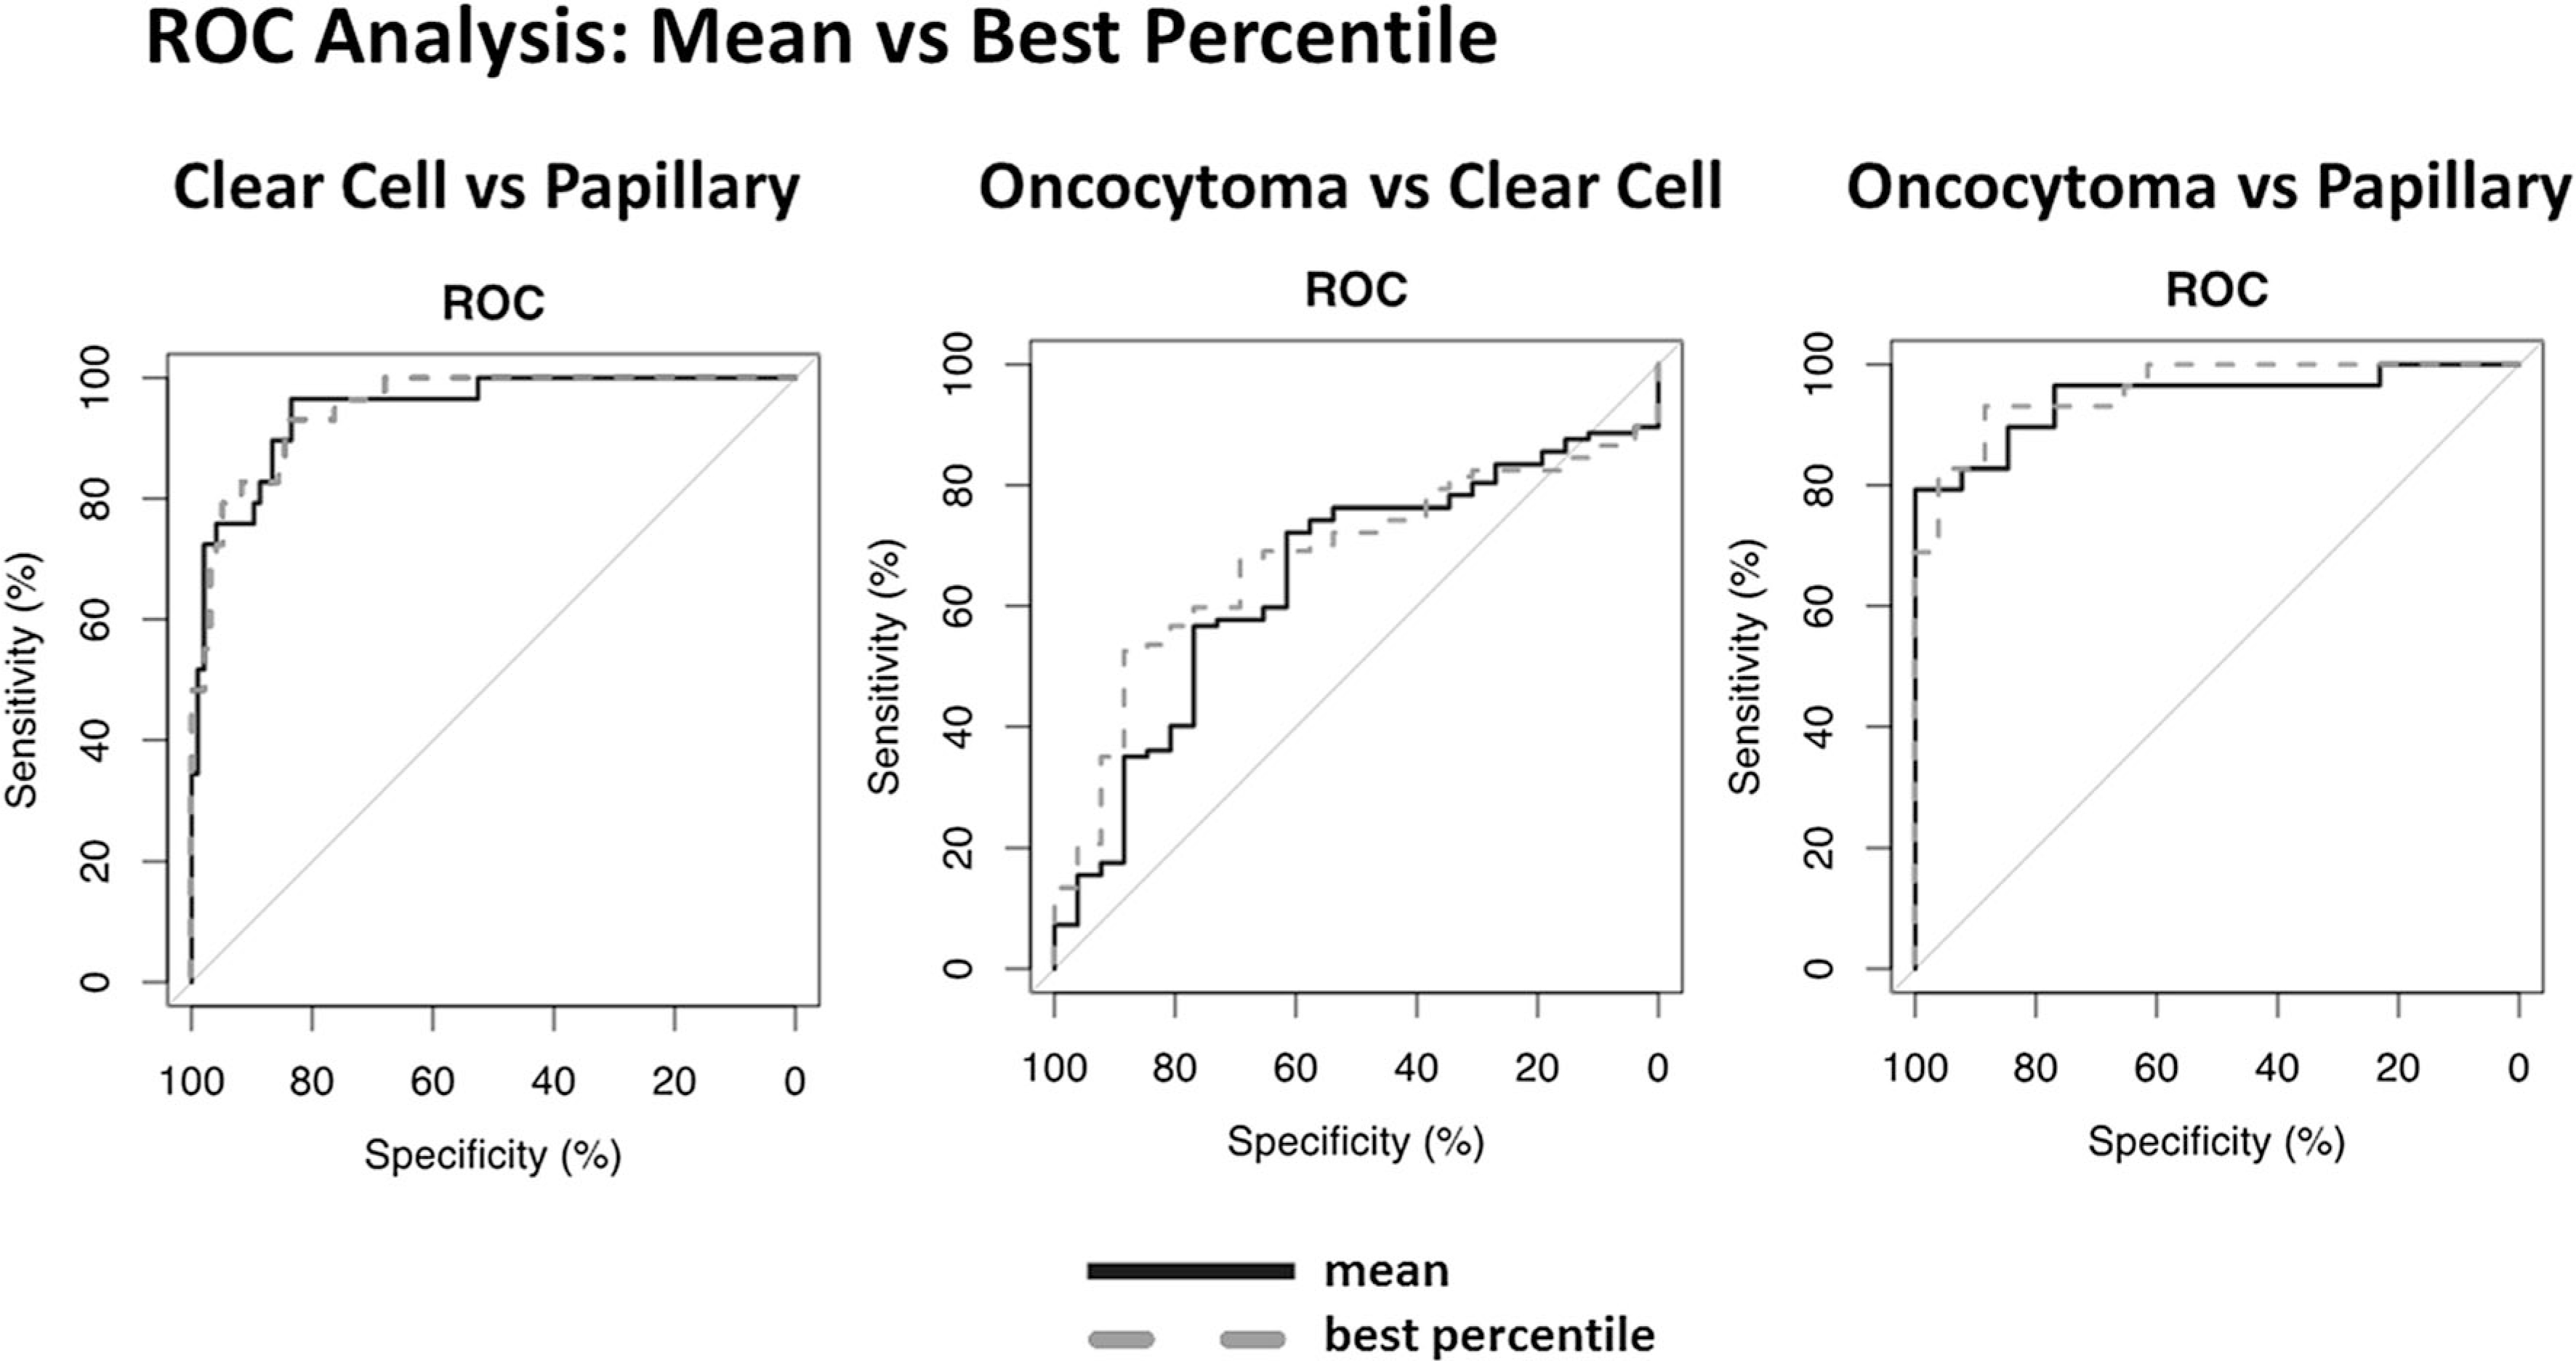
Fig. 4.
ROC analysis plots with best percentiles, sensitivity, specificity, and area under the curve (AUC) for each subtype.
Discussion
The beneficial use of ADC values for the prediction of RCC tumor subtypes is well established. However, with conventional ADC measurements being recorded from single slice ROIs by an expert observer, objective whole-lesion analysis reduces observer bias for less-trained observers and improves reflection of lesion heterogeneity. Whole-lesion histogram analysis provides further insight into tumor structure and histology. It has been previously established that ccRCC and oncocytomas can be difficult to visually differentiate; however, previous studies have had moderate success using examination of mean ADC values [1, 2]. Nevertheless, examining the histograms of ccRCC and oncocytomas, the similarities are evident. Compared to pRCC, the histograms of both ccRCC and oncocytomas are shifted toward higher ADC values, indicative of their hypervascular and highly cellular nature (Figs. 5, 6, 7). Moreover, the distribution of ADC values on the histograms is useful for the radiologist to identify heterogeneous features of the lesion to assist with subtype determination, such as hemorrhage, necrosis, solid vs. cystic components, and central scar, all features more common in ccRCC/oncocytomas than in pRCC [19]. Traditionally, mean ADC value of a lesion is used for analysis [1, 2, 5, 10]. While our results validate this methodology, they further indicate that a broad range of quantiles can be used for accurate differentiation of pRCC/oncocytoma and pRCC/ccRCC. However, as mentioned above, consideration of the whole-lesion histogram can offer insights into tumor composition not reflected by single-value analysis of the mean (Supplemental Figs. 8–10). It should be noted that the clear demarcation between pRCC and ccRCC could possibly be enhanced due to the majority of our ccRCC patients having grade-2 tumors. Due to the heterogeneous enhancement of higher grade tumors, less separation would be expected between the populations. Moreover, although valid, the suggested cutoff values should be considered in the context of sample size.
Fig. 5.
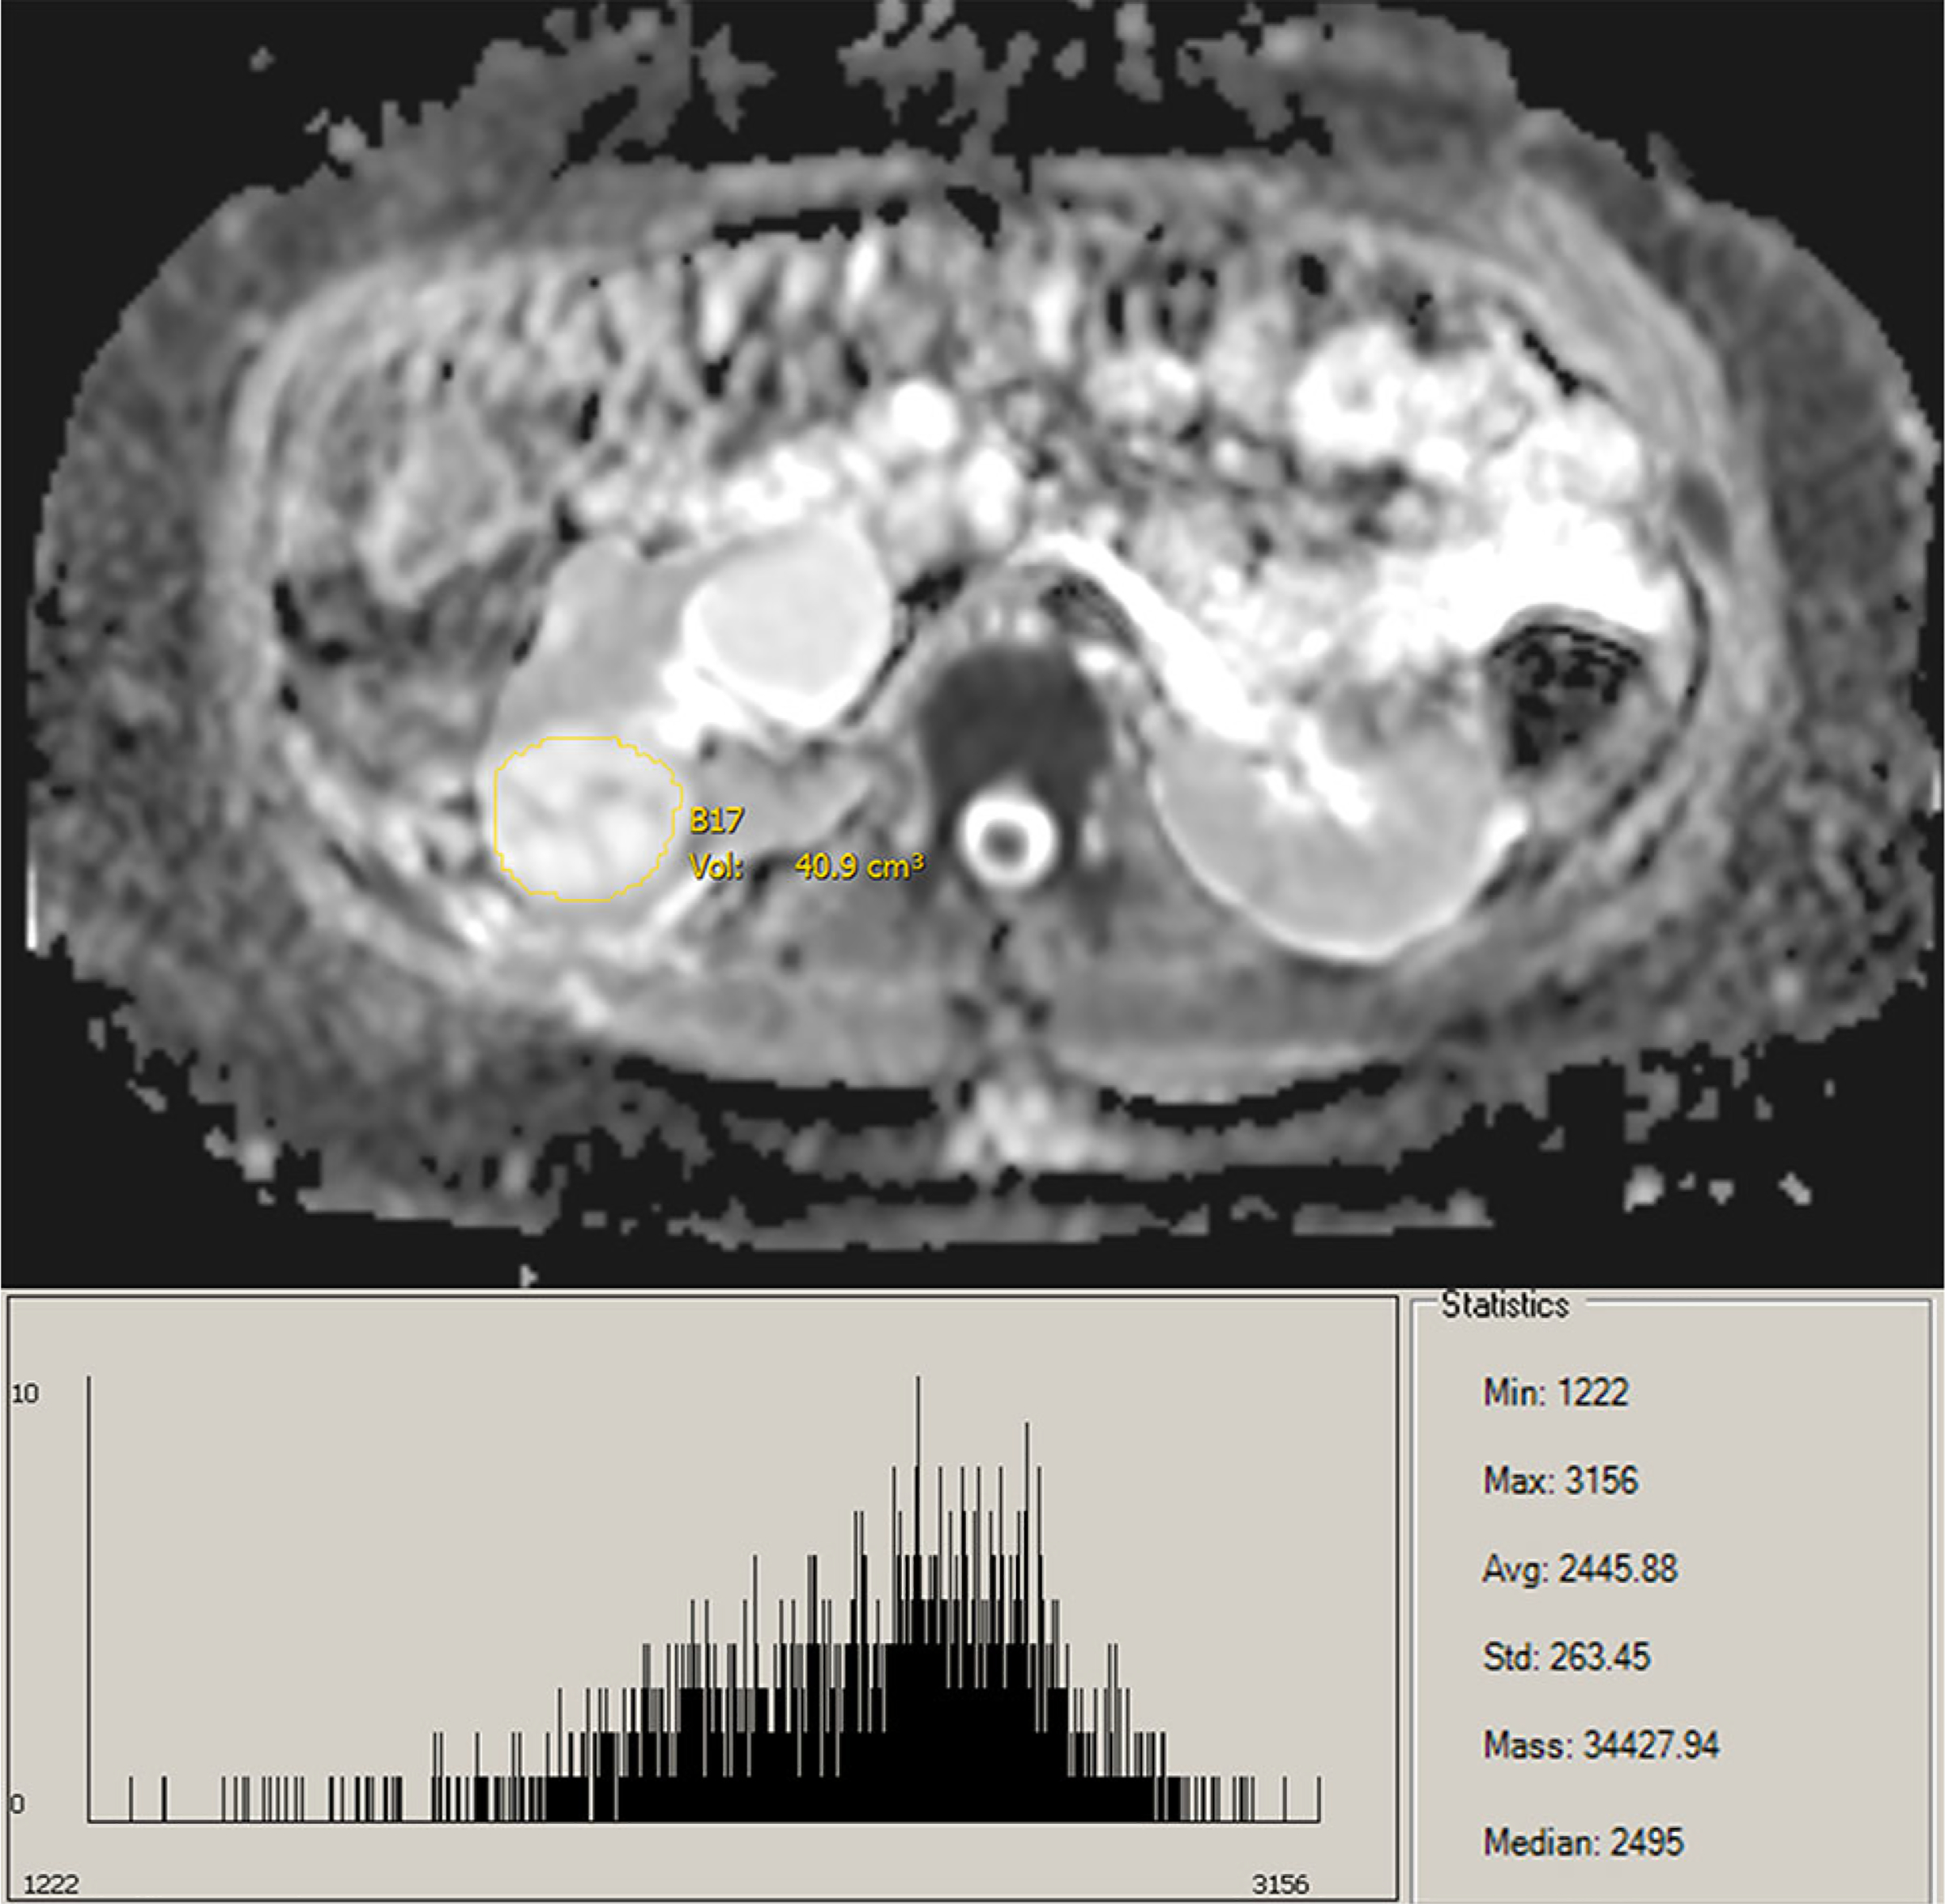
ADC map and histogram of ccRCC lesion.
Fig. 6.
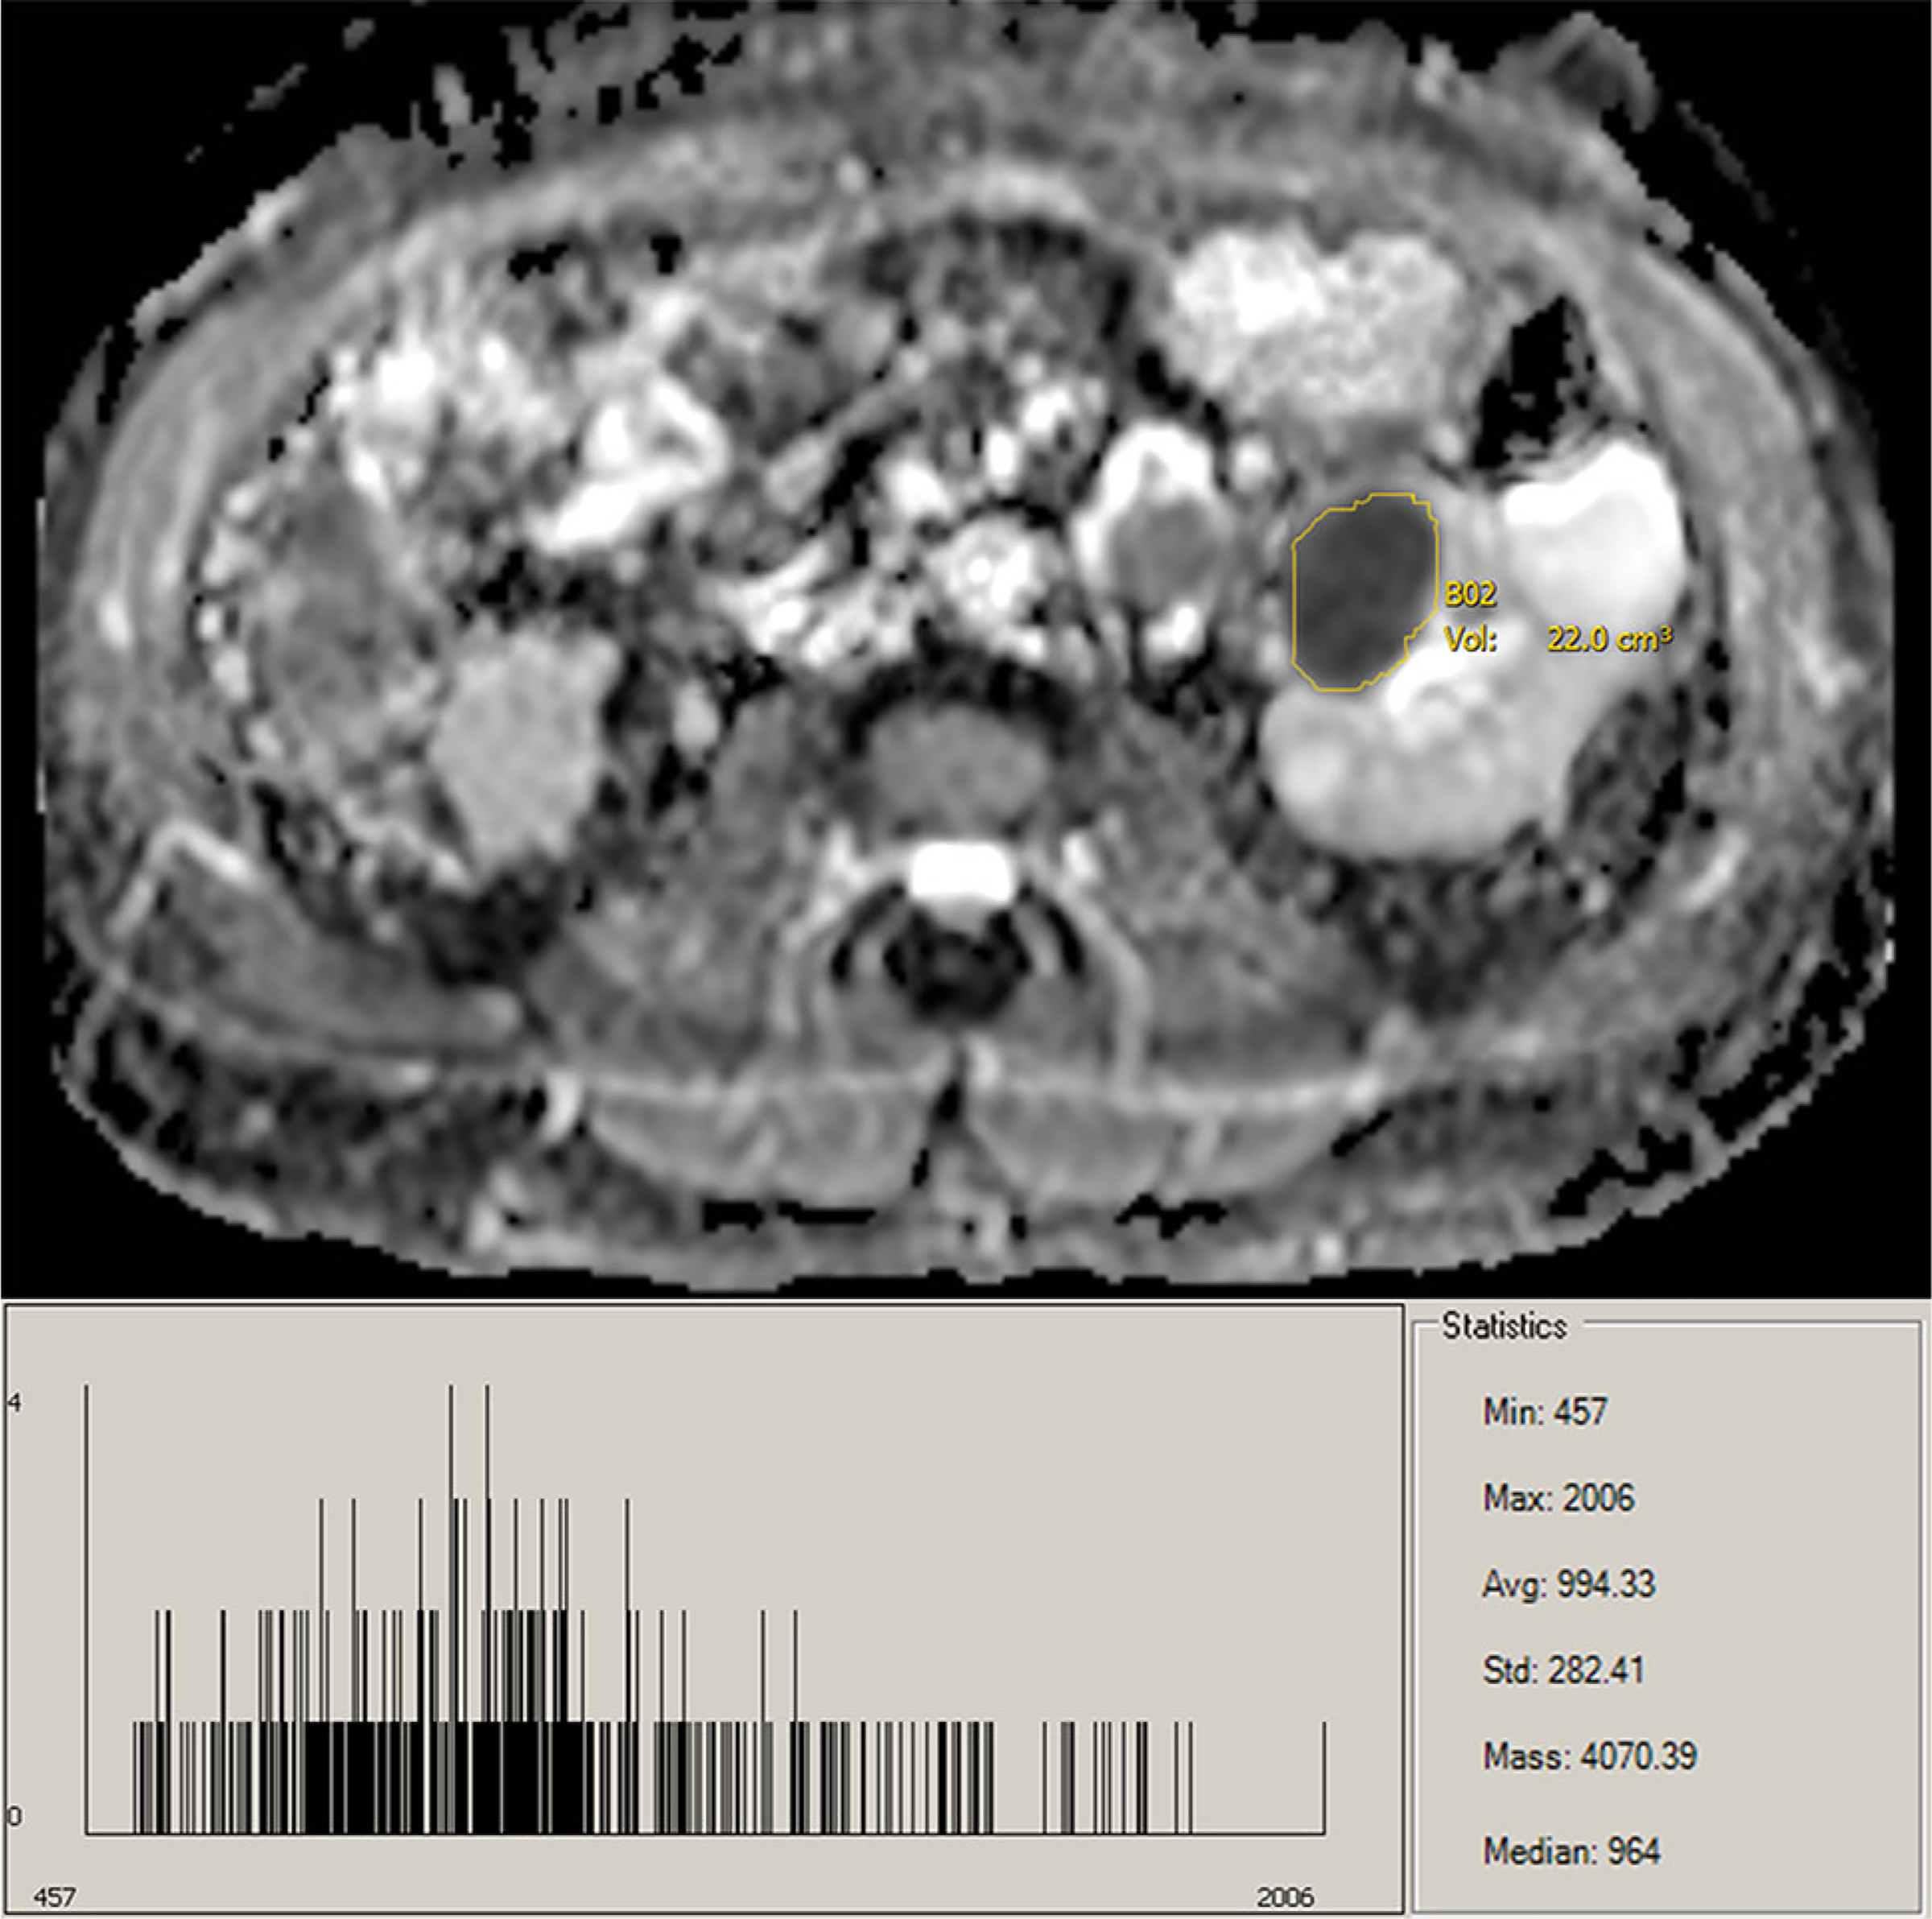
ADC map and histogram of pRCC lesion.
Fig. 7.
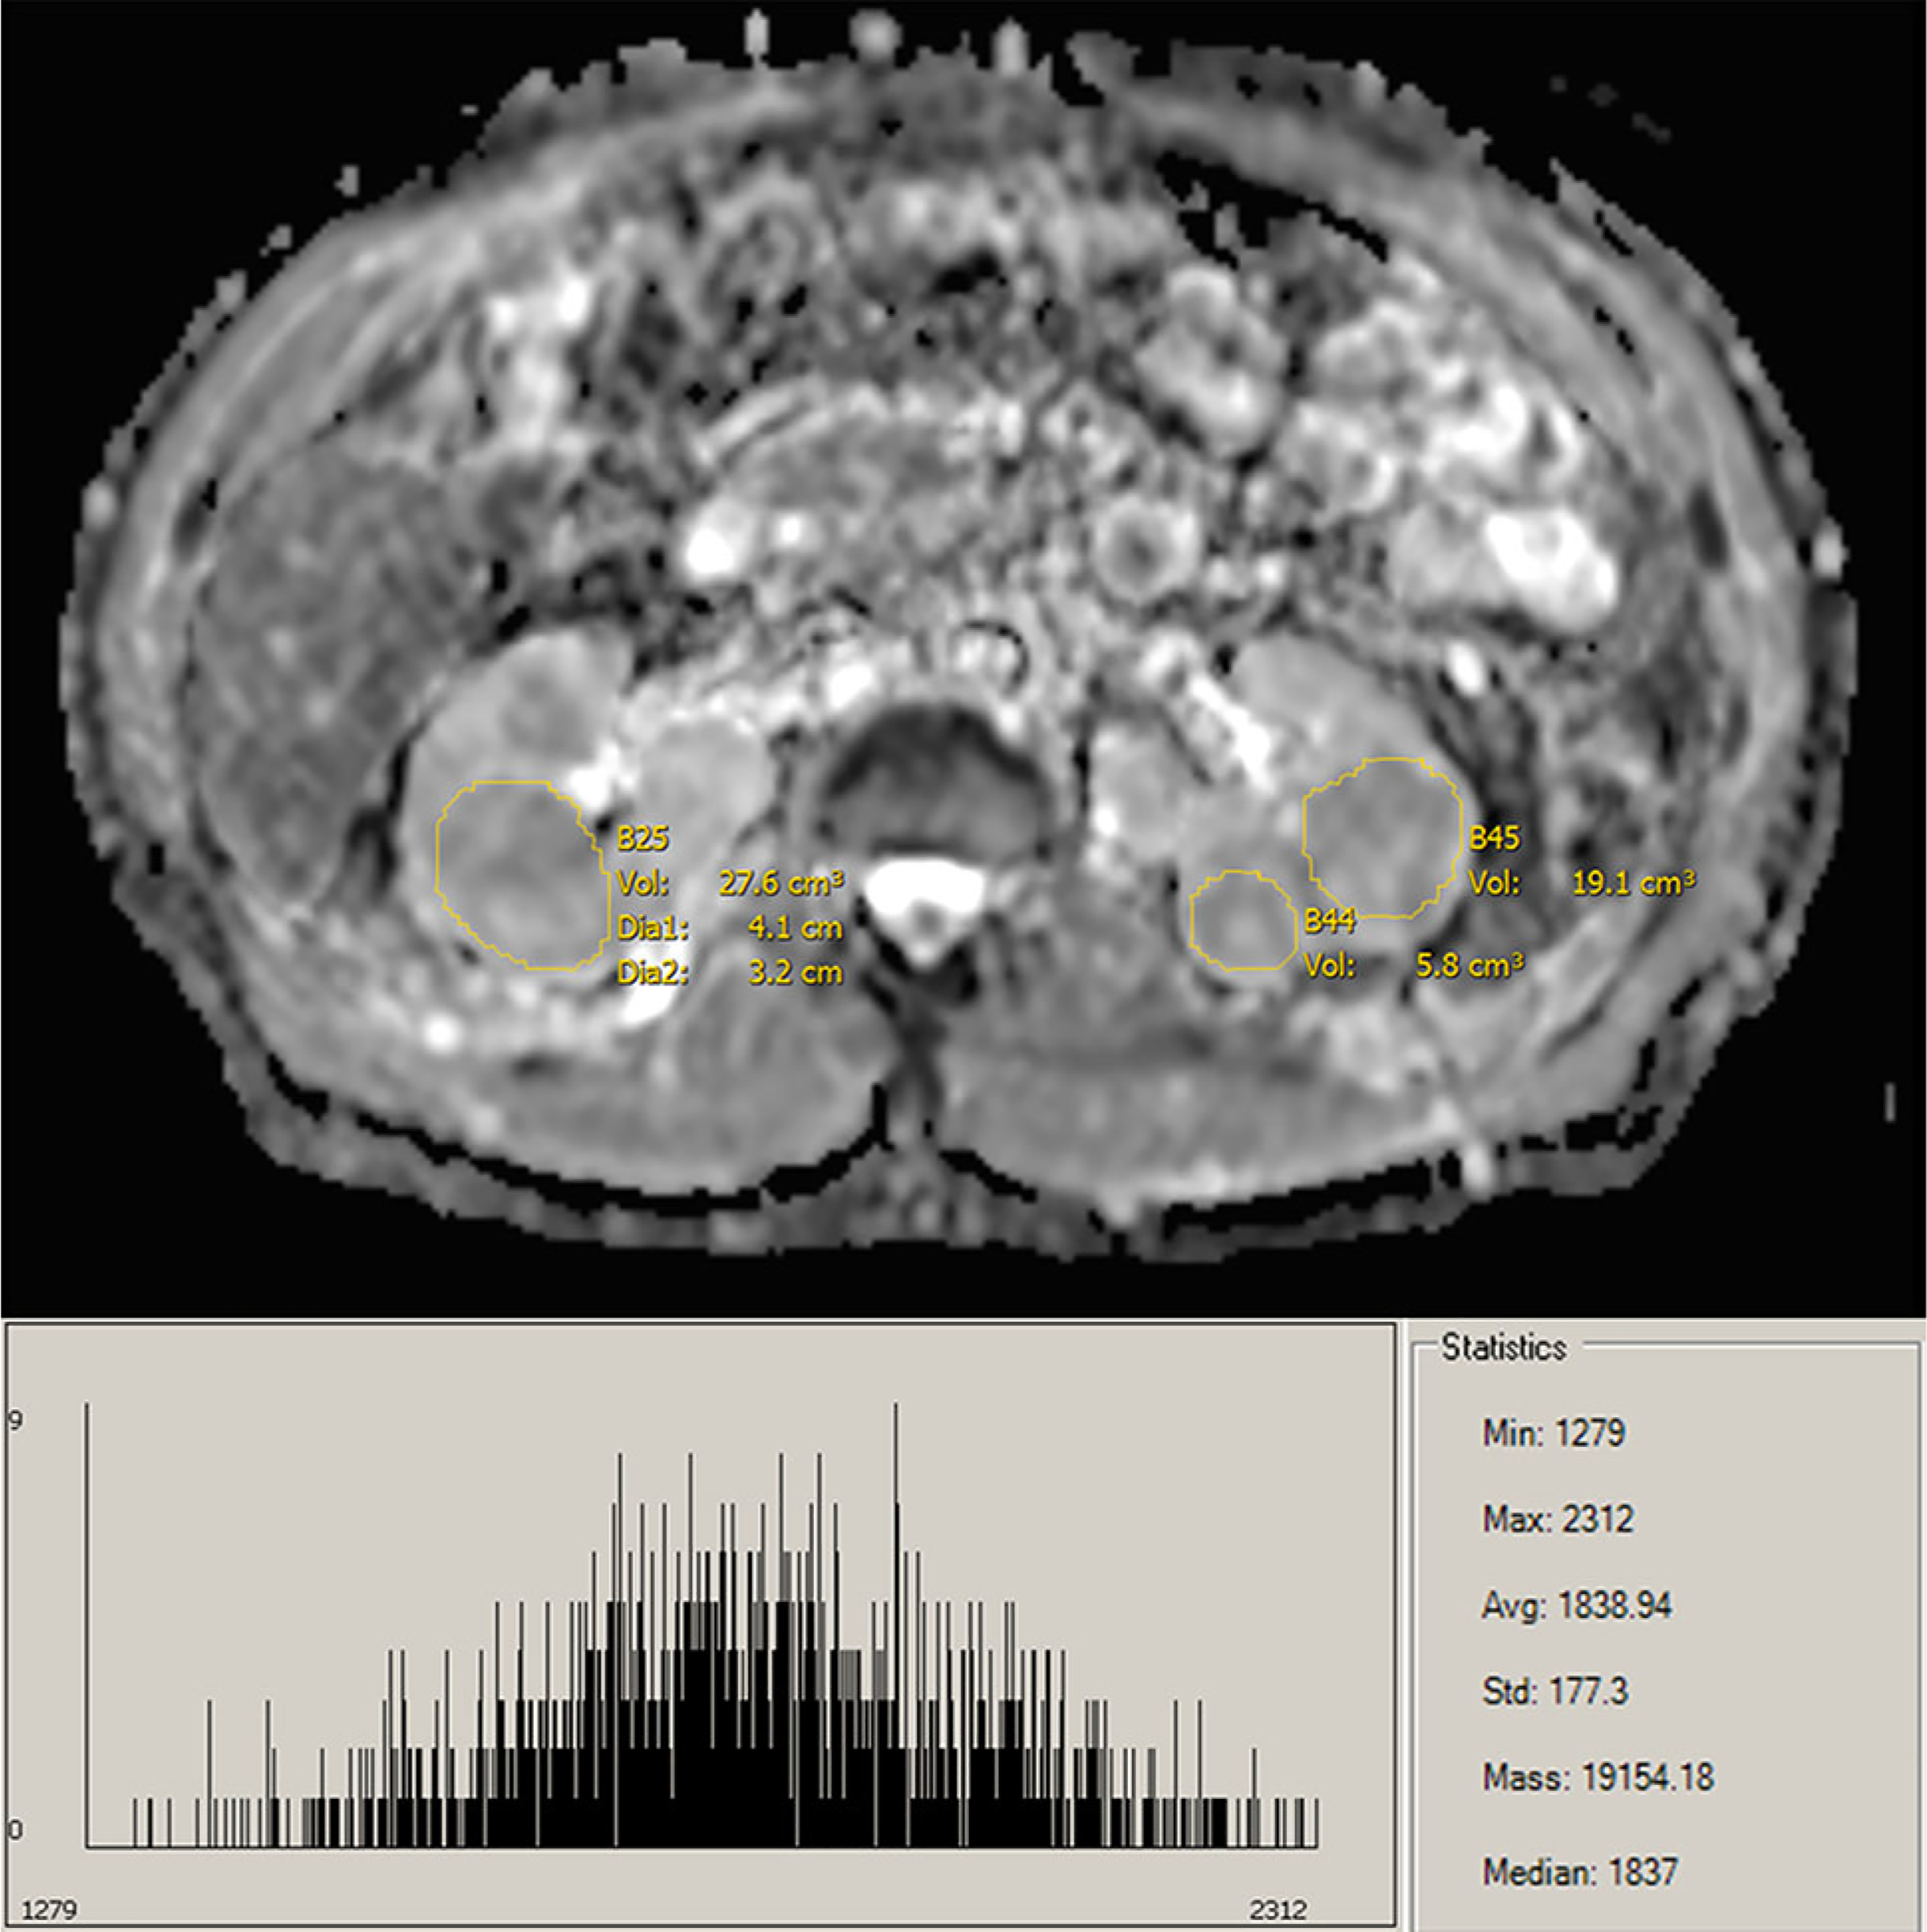
ADC map and histogram of oncocytoma lesions.
Although our results were similar to prior studies in the trends of ADC values of papillary and clear cell RCC, out findings did not concur with the prior finding that malignancies demonstrate lower ADC values than benign entities, such as oncocytoma [5, 10]. In the study by Hötker et al., the concept of whole-lesion volumetric analysis, compared to expert-based single ROI measurements, was explored [3]. Similar to the results of our study, ccRCC ADC values were significantly higher than pRCC, and no significant difference was observed between ADC values of ccRCC and oncocytoma. The relationship between pRCC and oncocytomas was not explored. Our results obtained with the whole volumetric analysis retain the predictive abilities of conventional single slice measurements, but eliminate interpreter selection of the ROI, reducing subjectivity and bias, and increasing reproducibility. Within the models comparing clear cell and papillary renal neoplasm subtypes, high specificity and sensitivity were demonstrated, except with respect to the model for differentiation of ccRCC and benign oncocytomas. While this parallels earlier ADC findings, it also explains the high percentage of lesions surgically excised as ccRCC, which are determined to be oncocytomas upon pathological determination [1–3, 11].
In this study, DWI imaging was performed at b values of 0, 250, and 800 s/mm2. The use of the higher b value reduces the effects of artifact and perfusion on ADC measurements and should provide more accurate measurement [13, 20, 21]. Furthermore, as DWI does not require administration of contrast, it can be utilized in patients with impaired renal function [1, 3]. While whole-lesion segmentation requires more time, it is a more objective measurement, and will increase in feasibility as the field moves toward semi- and fully automatic segmentation methods [3]. Furthermore, as demonstrated in the study by Hötker et al., whole-lesion volumetric analysis decreases disagreements between multiple readers compared with single slice ROI values [3].
While this study was performed retrospectively, all scans were performed on the same 1.5 T scanner. As such, the accuracy of our data was improved by reducing the confounding effect from the use of multiple scanners. Furthermore, all available cases in our prospectively acquired database were analyzed. Due to very small sample sizes, other common renal neoplasm subtypes such as chromophobe RCC and benign lipid-poor AML were not analyzed. Our study is also limited by the fact that the same data were used for generation of cutoff values and calculation of the associated AUC values, which could influence calculation of sensitivity and specificity. While our results parallel earlier findings, ADC values are influenced by different image-acquisition parameters and experimental designs, resulting in heterogeneity in reported ADC values [10, 11]. Therefore, in future studies, standardization of ADC calculations across vendors would improve the applicability and application of ADC research. Future studies with expanded subtypes of renal neoplasms to corroborate these findings are warranted.
In conclusion, the applicability of whole-lesion volumetric analysis for the differentiation of pRCC type I, ccRCC, and oncocytomas was analyzed for 152 lesions. Significant differences (P < 0.001) were found for the differentiation of pRCC/ccRCC, and pRCC/oncocytomas across a broad range of histogram quantiles. These results indicate that whole-lesion volumetric segmentation provides a reliable and reproducible way to differentiate these subtypes using ADC values, even for the less-experienced observer. Our results further confirmed the finding that ADC values cannot be used to reliably differentiate ccRCC/oncocytomas. The acquisition of noninvasive diffusion-weighted imaging and analysis of ADC histograms of lesions may prove beneficial for subtype differentiation of RCC, with the whole-lesion analysis reducing observer bias and increasing reproducibility.
Supplementary Material
Funding
This work was supported by the Intramural Research Programs (no grant number) of the Center for Cancer Research-National Cancer Institute and the National Institutes of Health Clinical Center, Bethesda, Maryland, USA.
Footnotes
Electronic supplementary material The online version of this article (https://doi.org/10.1007/s00261-017-1453-4) contains supplementary material, which is available to authorized users.
Compliance with ethical standards
Conflict of interest The authors declare no conflicts of interest.
Ethical approval All procedures performed in studies involving human participants were in accordance with the ethical standards of the institutional review board and with the 1964 Helsinki declaration and its later amendments or comparable ethical standards.
Informed consent Informed consent was obtained from all individual participants included in the study.
References
- 1.Mytsyk Y, Dutka I, Borys Y, et al. (2017) Renal cell carcinoma: applicability of the apparent coefficient of the diffusion-weighted estimated by MRI for improving their differential diagnosis, histologic subtyping, and differentiation grade. Int urol nephrol 49:215–224 [DOI] [PubMed] [Google Scholar]
- 2.Agnello F, Roy C, Bazille G, et al. (2013) Small solid renal masses: characterization by diffusion-weighted MRI at 3 T. Clin Radiol 68:e301–e308 [DOI] [PubMed] [Google Scholar]
- 3.Hötker AM, Mazaheri Y, Wibmer A, et al. (2016) Use of DWI in the differentiation of renal cortical tumors. Am J Roentgenol 206:100–105 [DOI] [PMC free article] [PubMed] [Google Scholar]
- 4.Zhang H, Gan Q, Wu Y, et al. (2016) Diagnostic performance of diffusion-weighted magnetic resonance imaging in differentiating human renal lesions (benignity or malignancy): a meta-analysis. Abdom Radiol 41:1997–2010 [DOI] [PubMed] [Google Scholar]
- 5.Wang H, Cheng L, Zhang X, et al. (2010) Renal cell carcinoma: diffusion-weighted MR imaging for subtype differentiation at 3.0 T. Radiology 257:135–143 [DOI] [PubMed] [Google Scholar]
- 6.Ramamurthy N, Moosavi B, McInnes M, Flood T, Schieda N (2015) Multiparametric MRI of solid renal masses: pearls and pitfalls. Clin Radiol 70:304–316 [DOI] [PubMed] [Google Scholar]
- 7.Giannarini G, Petralia G, Thoeny HC (2012) Potential and limitations of diffusion-weighted magnetic resonance imaging in kidney, prostate, and bladder cancer including pelvic lymph node staging: a critical analysis of the literature. Eur Urol 61:326–340 [DOI] [PubMed] [Google Scholar]
- 8.Türkbey B, Aras Ö, Karabulut N, et al. (2012) Diffusion-weighted MRI for detecting and monitoring cancer: a review of current applications in body imaging. Diagn Int Radiol 18:46. [DOI] [PubMed] [Google Scholar]
- 9.Malayeri AA, El Khouli RH, Zaheer A, et al. (2011) Principles and applications of diffusion-weighted imaging in cancer detection, staging, and treatment follow-up. Radiographics 31:1773–1791 [DOI] [PMC free article] [PubMed] [Google Scholar]
- 10.Yu X, Lin M, Ouyang H, Zhou C, Zhang H (2012) Application of ADC measurement in characterization of renal cell carcinomas with different pathological types and grades by 3.0 T diffusion-weighted MRI. Eur J Radiol 81:3061–3066 [DOI] [PubMed] [Google Scholar]
- 11.Lassel E, Rao R, Schwenke C, Schoenberg S, Michaely H (2014) Diffusion-weighted imaging of focal renal lesions: a meta-analysis. Eur Radiol 24:241–249 [DOI] [PubMed] [Google Scholar]
- 12.Doshi AM, Huang WC, Donin NM, Chandarana H (2015) MRI features of renal cell carcinoma that predict favorable clinicopathologic outcomes. Am J Roentgenol 204:798–803 [DOI] [PubMed] [Google Scholar]
- 13.Rosenkrantz AB, Niver BE, Fitzgerald EF, et al. (2010) Utility of the apparent diffusion coefficient for distinguishing clear cell renal cell carcinoma of low and high nuclear grade. Am J Roentgenol 195:W344–W351 [DOI] [PubMed] [Google Scholar]
- 14.Bates D, Mächler M, Bolker B, Walker S (2014). Fitting linear mixed-effects models using lme4. (arXiv:14065823)
- 15.Robin X, Turck N, Hainard A, et al. (2011) pROC: an open-source package for R and S + to analyze and compare ROC curves. BMC Bioinform 12:77. [DOI] [PMC free article] [PubMed] [Google Scholar]
- 16.DeLong ER, DeLong DM, Clarke-Pearson DL (1988) Comparing the areas under two or more correlated receiver operating characteristic curves: a nonparametric approach. Biometrics 44(3):837–845 [PubMed] [Google Scholar]
- 17.Youden WJ (1950) Index for rating diagnostic tests. Cancer 3:32–35 [DOI] [PubMed] [Google Scholar]
- 18.Fluss R, Faraggi D, Reiser B (2005) Estimation of the Youden Index and its associated cutoff point. Biom J 47:458–472 [DOI] [PubMed] [Google Scholar]
- 19.Gordetsky J, Zarzour J (2016) Correlating preoperative imaging with histologic subtypes of renal cell carcinoma and common mimickers. Curr Urol Rep 17:52. [DOI] [PubMed] [Google Scholar]
- 20.Kitajima K, Kaji Y, Kuroda K, Sugimura K (2008) High b-value diffusion-weighted imaging in normal and malignant peripheral zone tissue of the prostate: effect of signal-to-noise ratio. Magn Resonance Med Sci 7:93–99 [DOI] [PubMed] [Google Scholar]
- 21.Rosenkrantz AB, Hindman N, Lim RP, et al. (2013) Diffusion-weighted imaging of the prostate: Comparison of b1000 and b2000 image sets for index lesion detection. J Magn Resonance Imaging 38:694–700 [DOI] [PubMed] [Google Scholar]
Associated Data
This section collects any data citations, data availability statements, or supplementary materials included in this article.