Abstract
In November 2016, a large area of wildfire occurred in the southeastern United States, concomitant with the occurrence of severe drought during the same period. Whereas the previous studies on biomass burning over this region mainly focused on the prescribed fire, this study investigated the impact of wildfire using the two-way-coupled Weather Research and Forecasting model and Community Multiscale Air Quality model. Two episodic wildfire burning events (November 6 to 9 and November 13 to 16, 2016) were selected, and the mean contribution to fine particulate matter (PM2.5) in the southeastern United States from wildfires reached 9.6 to 42.5 μg m−3 and 10.9 to 26.1 μg m−3, with mean relative contributions of 41% and 49%, respectively, during these two events. The effect of wildfire propagates along the path of the smoke plume, which is determined by the wind speed and direction. For instance, during the first event, the dominant low-altitude wind vector displayed an anticyclonic-type flow with low wind speed, resulting in relatively localized influence and high intensity. In contrast, during the second event, relatively fast eastward wind, particularly over the latter part of the event, strengthened the diffusion and affected larger areas in comparison with the first event. Moreover, differently from the previous studies, this study took a further step to reveal the mechanism of the aerosol direct effect on the deterioration of air quality during wildfire, mainly through the modulation of reduction in surface downward shortwave radiation, planetary boundary layer height and wind speed, subsequently, facilitating pollution accumulation. Quantification analysis showed an average of 10% to 14% extra enhancement of PM2.5 during the November 6 to 8 episode. Considering that more frequent drought is projected to occur in the southeastern United States, wildfire may play an even more important role in modulating the air quality in this region.
Keywords: wildfire, PM2.5, southeastern United States, aerosol direct effect
1. Introduction
Biomass burning can emit a large number of aerosol particles and gaseous pollutants (Souri et al., 2017; Urbanski et al., 2018; Voulgarakis et al., 2015; Zhang et al., 2010), affecting the air quality, visibility (Chen et al., 2017; Fu et al., 2012; Huang et al., 2013; McMeeking et al., 2006; Yue et al., 2013), and human health (Huang et al., 2019; Rappold et al., 2017). There are, in general, two major types of biomass burning: (1) wildfire burning and (2) prescribed burning; the latter type is a common way to alleviate the risk of wildfire (Hardy et al., 2001; Zhang et al., 2013).
In most parts of the United States, the air quality continues to improve because of reductions in anthropogenic emissions (McClure and Jaffe, 2018; Squizzato et al., 2018). The national average PM2.5 concentrations in the United States decreased by 39% from 2000 to 2018 (USEPA, 2019). However, biomass burning may substantially offset the effects of the decrease in anthropogenic emissions (Martin et al., 2015; McClure and Jaffe, 2018). For instance, Kaulfus et al. (2017) indicated that 20% of the particulate matter exceedance events in the United States from 2005 to 2016 occur when biomass burning is present. McClure and Jaffe (2018) found an increasing trend of the upper (98th) quartile of PM2.5 over the northwestern United States from 1988 to 2016, attributable to the effects of wildfire.
The frequency of wildfire in the western and southeastern United States is equivalent (top row of Fig. 3 in Brey et al. (2018)); however, the western United States had much larger areas of wildfires (i.e., one order of magnitude higher than the southeastern United States from 1992 to 2015 (bottom row of Fig. 3 in Brey et al. (2018)). Increased wildfire from 1984 to 2015 over the western United States was tightly connected with the increase in temperature and water vapor deficit because of human-induced climate change (Abatzoglou and Williams, 2016). A variety of studies have investigated the effect of wildfire on the air quality in the western United States. For instance, Wu et al. (2006) illustrated that population-weighted PM2.5 may increase from 20 μg m−3 during a no-fire period to 90 μg m−3 under heavy wildfire conditions in southern California in late October 2003. Jaffe et al. (2008) found summer mean PM2.5 enhancement of 0.61 μg m−3 to 1.84 μg m−3 because of wildfire in the western United States from 1988 to 2004, and the effect may be doubling during large fire years. In a recent study (Table 5 of Wilkins et al. (2018)), the simulation results from the Community Multiscale Air Quality (CMAQ) model indicated that the wildfire from June 20 to 30, 2008, over California contributed 83% to PM2.5 and, from May 29 to June 30, 2011, over Arizona and New Mexico contributed 23% to PM2.5.
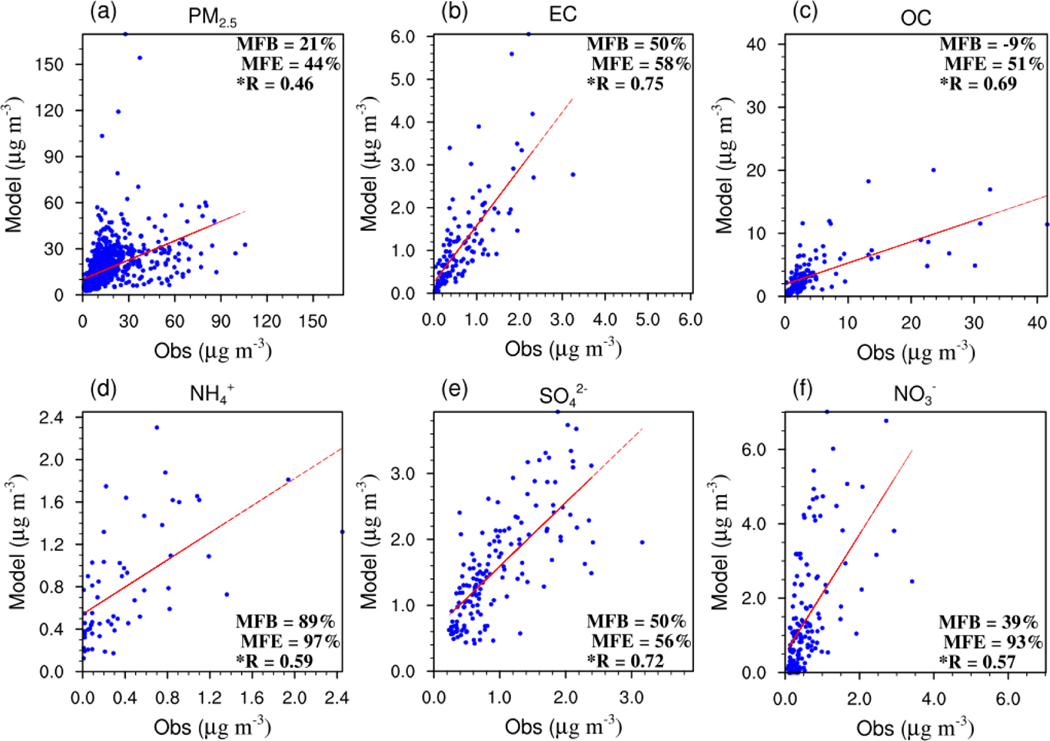
Fig. 3.
Scatter plot of simulated daily mean concentrations versus AQS observations in the four states (Tennessee, Kentucky, North Carolina, and Georgia) for November 2016: (a) PM2.5, (b) EC, (c) OC, (d) NH4+, (e) SO42-, and (f) NO3-. The linear regression line (red solid line) are provided. Also shown are the statistical parameters: MFB, MFE, and correlation coefficient (R). The asterisk on the left side of the R indicates statistical significance at the 95% confidence level.
In contrast, over the southeastern United States, where 70% of the United States prescribed burnings take place (Chiodi et al., 2018), 30% of PM2.5 emissions were contributed by prescribed burning, whereas wildfires only contributed 3% (Huang et al., 2019), implying the dominant influence of prescribed burning instead of wildfire. However, a severe wildfire with maximal burning area over this region from 1984 to 2016 occurred in November 2016, very likely caused by the severe drought in the fall of 2016, which was one of the worst droughts over the past two centuries in this region (Williams et al., 2017). Although the prescribed burning in the southeastern United States has caught enough attention (Chiodi et al., 2018; Hu et al., 2008; Liu et al., 2009; Liu et al., 2013; Tian et al., 2009), the impact from the large wildfire burning (i.e., the events in November 2016) has been ignored. Therefore, it is essential to investigate what role the intensive wildfire may play in modulating the air quality in the southeastern United States.
In addition, the aerosol has been recognized to affect the radiation and, subsequently, to influence temperature and the development of the planetary boundary layer (PBL), further influencing the aerosol concentrations (Ding et al., 2017; Ding et al., 2013; Ding et al., 2016; Huang et al., 2018; Yang et al., 2017). This aerosol-PBL relationship has not been well examined to quantify the potential effect of worsening the air quality during wildfire burning, which was one of the main targets in this study.
In what follows, we first evaluated the model capability in reproducing the observed variables. Following the evaluation, the contribution of the wildfire in November 2016 on the PM2.5 and the composition over the southeastern United States was examined. Lastly, the impact of shortwave radiative effect of aerosol was discussed.
2. Model description
The coupled Weather Research and Forecasting model and CMAQ model (WRF-CMAQ; Wong et al. (2012)) has been widely used to simulate the spatial distribution of wildfires (Fu et al., 2012; Pimonsree et al., 2018; Vongruang et al., 2017). In this study, the two-way coupled model combining the WRF model (version 3.8) and the CMAQ model (version 5.2) was used (Byun and Schere, 2006; Wong et al., 2015). In the WRF-CMAQ coupled model, CMAQ is considered as a subroutine within the WRF framework, and data exchange is through memory, a buffered file in Input/Output Applications Programming Interface (I/O API) library (https://www.cmascenter.org/ioapi/). The times step (seconds) in WRF is suggested to be within six times of the domain resolution (kilometers) considering the numerical stability (https://www2.mmm.ucar.edu/wrf/users/docs/user_guide_V3.8/ARWUsersGuideV3.8.pdf; access: 02/03/2020). The spatial resolution of WRF in this study is 12 km, and the time step is set as 1 min. CMAQ can be called by WRF framework at the end of the WRF time step, and an integer usually is selected as the calling frequency. The number five is used in this study, indicating that CMAQ is called every five WRF time steps, thus the time step of CMAQ becomes 5 min. Before calling CMAQ, meteorological data is stored in memory at the end of the WRF time step and read in through the I/O API interface. The mass concentrations of aerosol species, grouped into five categories, (1) water-soluble, (2) insoluble, (3) sea salt, (4) black carbon, and (5) water, are transferred to WRF at the end of each CMAQ time step. The radiation physics in WRF calls every 20 min; therefore, only the aerosol transferred to WRF at every fourth CMAQ time step was used. Please note that only the shortwave radiative effect of aerosol is examined, similar to previous studies (i.e., Sekiguchi et al. (2018); Zhao et al. (2010)). More detailed information about the couple model can be found in Wong et al. (2012). Both the WRF and CMAQ models use the Lambert conformal projection coordinate system, with the center at 50° N and 97° E and 35 vertical layers. The simulation domain is shown in Fig. S1 in the supporting information, with the states mentioned in this study highlighted in color. The configuration of WRF is shown in Table 1. For CMAQ, the gas-phase chemical reactions are provided by the CB6 carbon-bond mechanism, and the aerosols are computed using the AERO6 aerosol module. For the chemical initial and boundary conditions of the 12 km × 12 km domain, they are retrieved from outer-domain simulations with a hemispheric CMAQ simulation at the spatial resolution of 108-km grid spacing.
Table 1.
Model Configuration of WRF
| Meteorology model | WRF v3.8 |
| Microphysics | Morrison |
| Surface layer option | PX surface layer |
| Land surface option | PX LSM |
| Planetary boundary layer scheme | ACM2 |
| Cumulus option | Kain-Fritsch |
| Longwave radiation | RRTMG |
| Shortwave radiation | RRTMG |
The anthropogenic emission inventory used in this study was based on the National Emissions Inventory (NEI) from United States Environmental Protection Agency (USEPA), and the fire emissions were processed based on the “alpha” version of the 2016 modeling platform (Eyth et al., 2019). Specifically, the NEI point, non-point, on-road and off-road sectors were processed using the Sparse Matrix Operational Kernel for Emissions (SMOKE; (http://www.smoke-model.org/)). For wildfires and prescribed fires, two major sources of fire data, (1) Incident Status Summary (ICS-209) reports fire and (2) fire locations from the Hazard Mapping System of the National Oceanic and Atmospheric Administration, were ingested in the SMARTFIRE version 2 (SF2; Raffuse et al. (2009)) system to generate a unified data set. Following this step, the fuel loadings were processed by the Fuel Characteristics Classification System (Ottmar et al., 2007) and then used by fuel consumption model CONSUME v4.1 (Prichard et al., 2007) to calculate the daily fire emissions within the Bluesky framework. The emissions were further processed by SMOKE into CMAQ “model-ready” format. The inline plume-rise calculation inside CMAQ was applied based on hourly heat, which were used to calculate the height of plume rise and, subsequently, to determine the model layer to which the emissions should be allocated.
3. Results and discussion
3.1. The monthly variation of PM2.5 based on observations
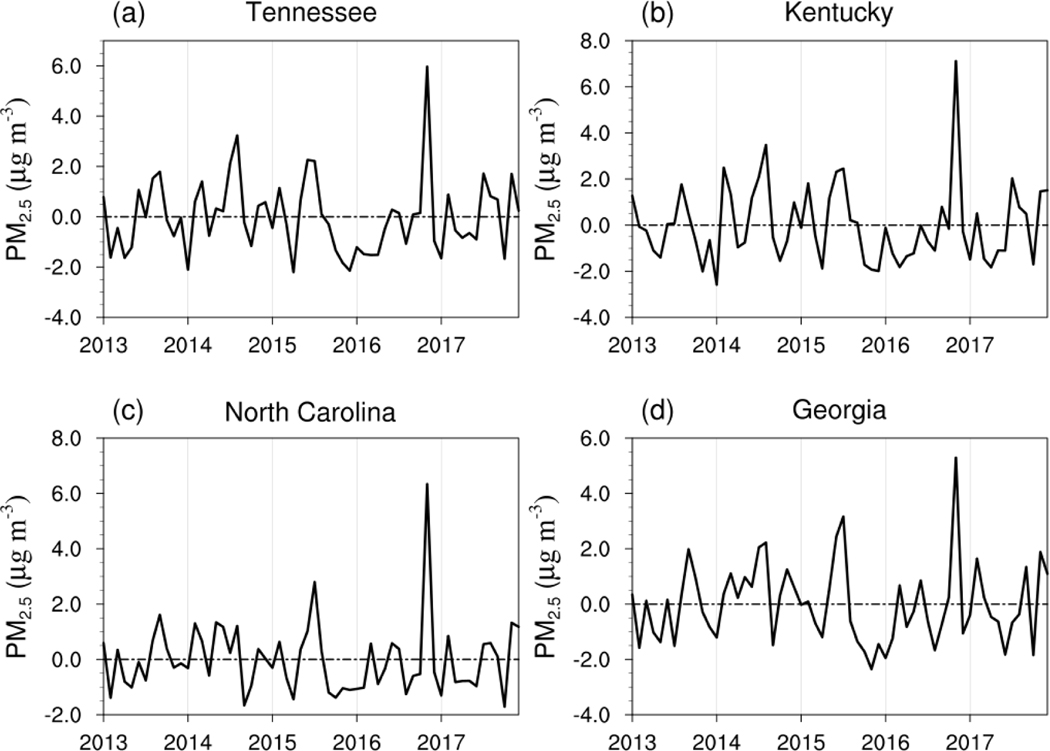
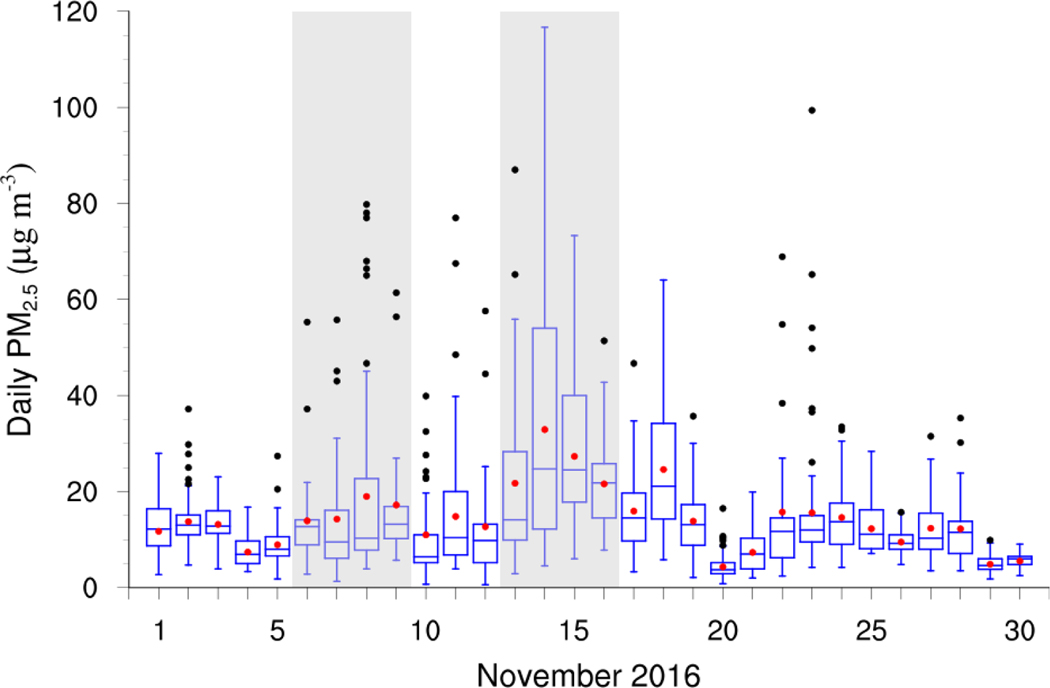
The observation data used in this study are from the U.S. EPA’s Air Quality System (AQS; https://www.epa.gov/aqs). To clearly identify the interannual variability of PM2.5 over the southeastern United States in the past few years, monthly mean detrended PM2.5 concentrations from 2013 to 2017 over four states, (1) Tennessee, (2) Kentucky, (3) North Carolina, and (4) Georgia, are shown in Fig. 1. Alternatively, we also have tested another method by removing the annual cycle first, yielding similar interannual variation of PM2.5 concentration as that shown in Fig. 1. The strikingly high PM2.5 anomaly in November 2016 stands out, exceeding three standard deviations based on the 5-year monthly PM2.5 anomaly. This abnormally high PM2.5 concomitantly occurs with the large wildfire (Williams et al., 2017). To further view the variability of PM2.5, box-and-whisker plots of daily mean PM2.5 concentrations in November 2016 are shown in Fig. 2.
Fig. 1.
Time series of detrended monthly average PM2.5 concentrations from AQS in (a) Tennessee, (b) Kentucky, (c) North Carolina, and (d) Georgia. The dashed line in each panel indicates the value of zero.
Fig. 2.
Daily mean PM2.5 concentrations from AQS over Tennessee, Kentucky, North Carolina, and Georgia in November 2016, with box-and-whisker plot displaying the 25th percentile (Q1) and 75th percentile (Q3), the median (blue line inside box) and mean (red point), the minimum (bottom blue line), Q3+1.5*IQR (IQR is the interquartile range Q3 to Q1; top blue line). All daily mean PM2.5 concentrations (November 2016) over the four states larger than Q3+1.5*IQR are indicated by black dots, corresponding to the values on the Y axis.
Based on the box-and-whisker plot shown in Fig. 2, two episodes (shaded in gray) were selected during November 6 to 9 and November 13 to 16, 2016, respectively. The selection takes into consideration both the mean and abnormal values of PM2.5 (i.e., the black dots refer to daily mean PM2.5 concentrations above the Q3+1.5*IQR [explained in the Fig. 2 caption]), implicative of the influence of wildfire burning. Alternatively, we also applied another method by calculating the 5-day moving average (i.e., the average of PM2.5 for a certain day is based on the mean value of daily PM2.5 beginning 2 days ahead to 2 days following (shown in Fig. S2). Similarly, the November 6 to 9 period is the first period showing an increasing trend of the PM2.5 moving average, and November 13 to 16 is the period that shows the largest moving average, with values decreasing after November 16. To elucidate and quantify the impact of wildfires and the shortwave radiative effect of aerosol on PM2.5 concentrations in the southeastern United States, WRF-CMAQ was conducted by designing four scenarios (shown in Table 2). The simulation time span was October and November 2016, but the first month was discarded as spin-up. In general, the scenarios cover a combination of wildfire and radiative effect of aerosol to isolate the impact by cross-comparisons.
Table 2.
List of Four WRF-CMAQ Simulation Scenarios
| Case | Fire emission | Shortwave radiative effect of aerosol |
|---|---|---|
| ①Case WF df | Yes | Yes |
| ②Case WF nf | Yes | No |
| ③Case OF df | No | Yes |
| ④Case OF nf | No | No |
3.2. Model performance
To verify the capability of WRF-CMAQ in reproducing the observation, we compared the daily mean concentrations of PM2.5, elemental carbon (EC), organic carbon (OC), sulfate (SO42-), nitrate (NO3-), and ammonium (NH4+) in Tennessee, Kentucky, North Carolina, and Georgia between observations and model simulation (Fig. 3). The mean fractional bias (MFB), in general, indicates that the model overestimated most of the species, except that for OC for which slight underestimation exists. Based on the MFB and mean fractional error percent (MFE) benchmark (−60% ≤ MFB ≤ 60%, MFE ≤ 75%; see Appendix for formula) recommended by Boylan and Russell (2006), the MFB and MFE, in general, satisfy the benchmark, within the standard range. However, for some species, such as NH4+, the MFB and MFE exceeds the criteria. However, statistically significant, at the 95% confidence level, correlation coefficients ranging from 0.46 to 0.75 were achieved, warranting high confidence in the simulated results.
To further make a day-to-day comparison, a box-and-whisker plot similar to Fig. 2 but including the model results corresponding to observation grids and time is shown in Fig. S3. The model and observation show consistent daily variations, and the model performs well during the two episodic events as well. The mean PM2.5 concentration of the model and observation during November 6 to 9, 2016, is 19.4 μg m−3 and 16.1 μg m−3, respectively, and during November 13 to 16 is 21.8 μg m−3 and 25.9 μg m−3, respectively.
3.3. The impact of wildfires on PM2.5 concentration
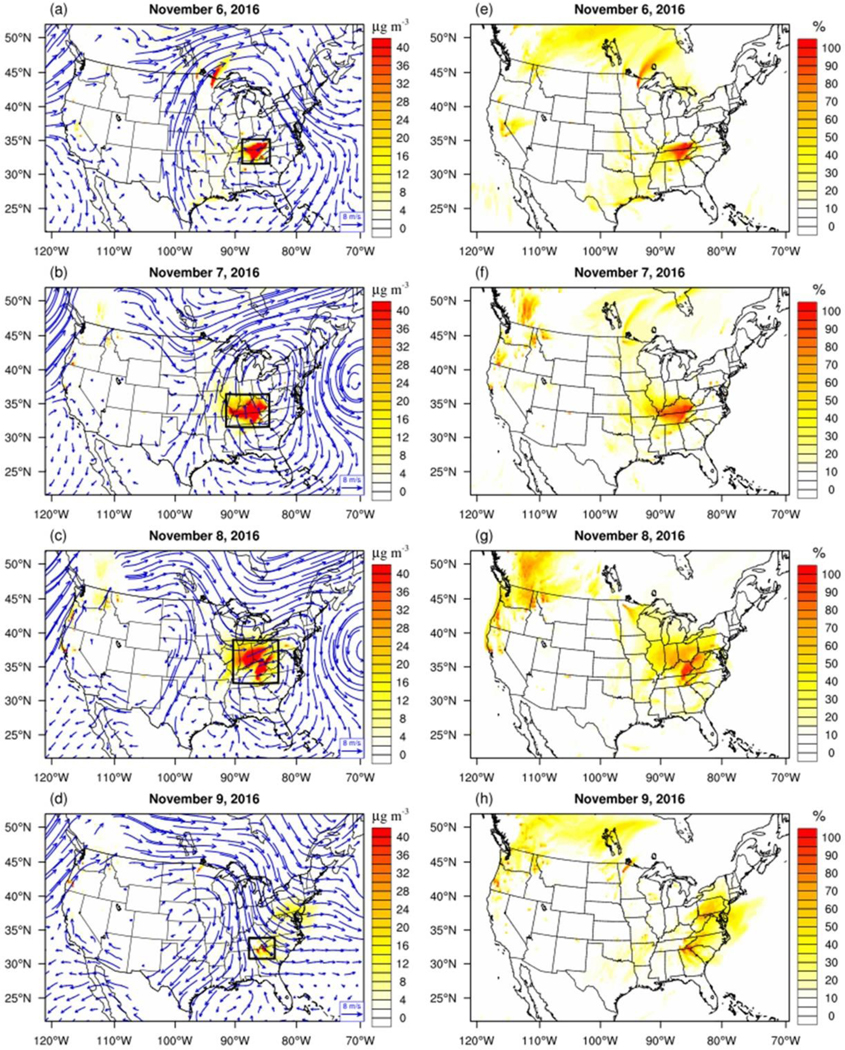
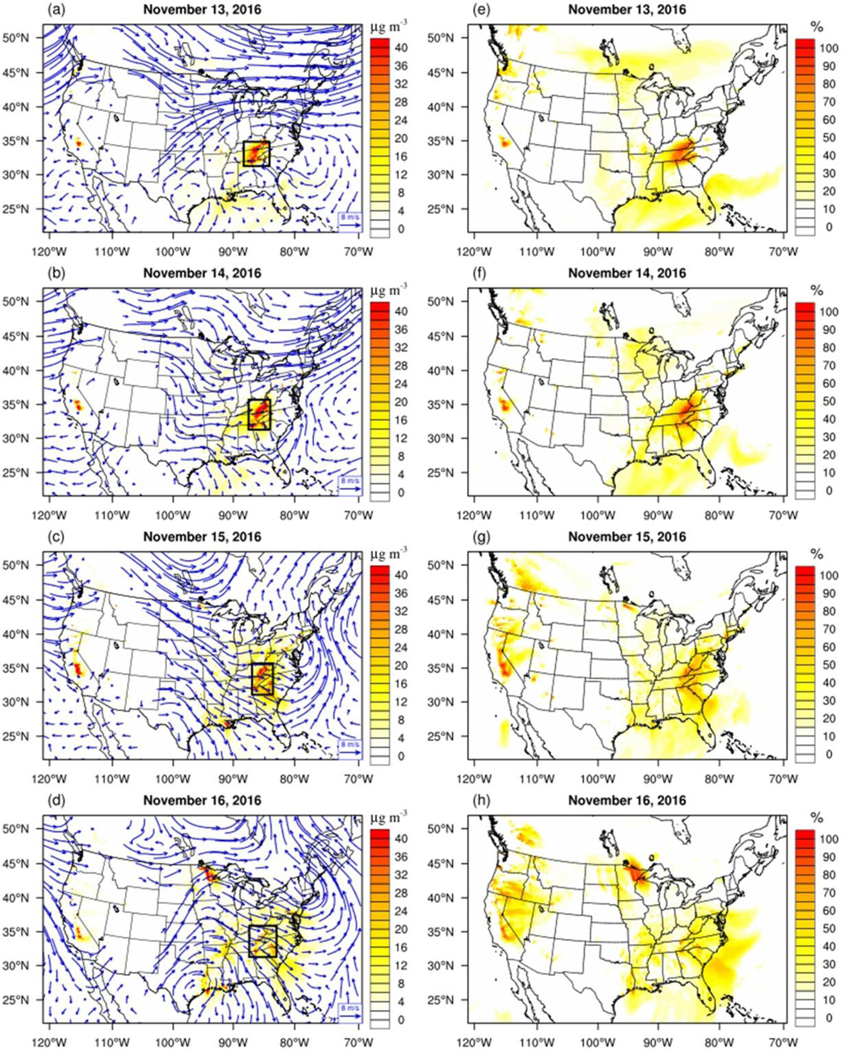
The spatial distribution of PM2.5 enhancement because of wildfire (case ①-③ in Table 2), as well as the percentage contribution to PM2.5 from wildfire (case (①-③)/①×100% in Table 2), is shown in Fig. 4. First, we calculated the monthly mean contribution of 6.8 μg m−3 from wildfire over the four states (Tennessee, Kentucky, North Carolina, and Georgia) in the southeastern United States, apparently higher than a previous study, showing the monthly wildfire contribution in 2011 ranging from 1.0 μg m−3 to close to 4.0 μg m−3, albeit over a larger area selected for the southeast United States (Fig. 5 in Koplitz et al. (2018)). Zooming into the first episodic event on November 6 and 7 (Fig. 4a and b), for instance, the effect of wildfires on PM2.5 was concentrated in the active fire areas, with the mean contribution of 42.5 μg m−3 and 30.1 μg m−3 and accounting for 47% (Fig. 4e) and 43% (Fig. 4f), respectively. Note that the contribution calculation, in terms of Fig. 4 or 5, during the episode was based on the mean value over the black square in the respective panel. On November 8 (Fig. 4c), the fire steered toward the right side of Kentucky, with mean PM2.5 contributions of 26.1 μg m−3 (40%; Fig. 4g), affecting Illinois, Indiana, and Ohio. On the last day of first episode (Fig. 4d), the wildfires became weaker, with an enhancement of 9.6 μg m−3 (33%; Fig. 4h) PM2.5 near the fire spots.
Fig. 4.
The absolute (case ①-③ in Table 2; left column) and percentage (case (①-③)/①×100%; right column) contributions of wildfires on PM2.5 during November 6 to 9, 2016. The blue arrows in the left column indicate the wind vectors at 850 hPa.
Fig. 5.
Similar to Fig. 4 but for November 13 to 16, 2016.
Wind is a major factor in the transport and diffusion of air pollutants. As shown in Fig. 4, on November 6 during the first episodic event, the impact of wildfires initially was concentrated over Tennessee and West Virginia where the fires started (Fig. 4a). The PM2.5 hot spots, located on the left side of an anticyclonic circulation, expand and propagate northeastward as a result of the southwest wind on November 7. The wind speed on November 6 and 7 was relatively low (mean speed of 4.3 m s−1 at 850 hPa near the center of the fire, black square on Fig. 4a and b); therefore, the burning slightly expanded and stayed relatively stable in Tennessee and West Virginia. On the following day, November 8, along the enhanced intensity of the southwesterly wind (mean speed of 7.9 m s−1, black square on Fig. 4c), although the fire locations were similar to the previous day (not shown), the pollution center moved further north, and the areas affected thereby were changed, from the intersection between Tennessee, Kentucky, and West Virginia to Indiana, Ohio, and West Virginia. On the last day, November 9, the wind direction changed from anticyclonic flow to a predominantly northwesterly wind (mean speed of 8.8 m s−1, black square on Fig. 4d), blowing the pollution southeastward into a bifurcated plume pattern, affecting areas in North Carolina and Georgia. However, the fire intensity became much weaker on November 9, and the impact gradually dissipated.
During the second episode, the fires were concentrated mainly over the border of Tennessee, Kentucky, North Carolina, and Virginia at the beginning and then propagated eastward under predominantly westerly wind (Fig. 5). The mean contribution from November 13 to 16 reaches 20.0 μg m−3, 26.1 μg m−3, 21.5 μg m−3, and 10.9 μg m−3 (Fig. 5a through d), with percentage contribution of 54%, 59%, 49%, and 32% (Fig. 5e through h), respectively. Combining the first and second episodes, the overall contribution of wildfire to PM2.5 is 45%, in general, showing larger impact than previously reported fire events in this area. For instance, Zeng et al. (2008) found that the mean contribution to PM2.5 because of prescribed fires is 12% during high-burning periods over the southeastern United States in 2002. Zhang et al. (2010) found total biomass burning in the southeastern United States accounted for 13% of PM2.5 annually in 2007 and the highest seasonal contribution in winter of 27% based on Positive Matrix Factorization. Wilkins et al. (2018) reported an enhancement of 1.1 μg m−3 (9%) of PM2.5 because of wildfire in North Carolina and Virginia in June 2008, which is apparently much smaller than in this study (6.8 μg m−3 [24%]) enhancement in November 2016 over Tennessee, Kentucky, North Carolina, and Virginia). Note the area selection may yield some differences in the interpretation and comparison among different studies; nevertheless, the large impact from wildfire in November 2016, discussed in this study remains unchanged.
If we compare the results between Fig. 4 and Fig. 5 from CMAQ model, the contribution from wildfire emissions to mean PM2.5 concentration during the first episodic events from November 6 to 9 is higher than that during the second one (November 13 to 16), whereas the observations (Fig. 2) indicate the mean PM2.5 concentration during November 13 to 16 is higher than that during November 6 to 9. The seeming contradiction between model and observation is due to the following reasons. Firstly, Fig. 2 shows the mean PM2.5 concentration over the four states of Tennessee, Kentucky, North Carolina, and Georgia, while the wildfire during November 6–9 mainly occurs over Tennessee, Kentucky and its northern areas such as Indiana and Ohio. Secondly, although from the view of mean value, it is much smaller during November 6 to 9, there are quite a few days with values exceeding Q3+1.5*IQR. The large number of abnormally high values was not common in most of the days without wildfire burning. In addition, the day-to-day comparison (shown in Fig. S3) discussed in section 3.2 indicates comparable results between model and observation, and both model and observation results indicate higher PM2.5 concentration during November 13–16 than that during November 6–9 over the states of Tennessee, Kentucky, North Carolina, and Georgia.
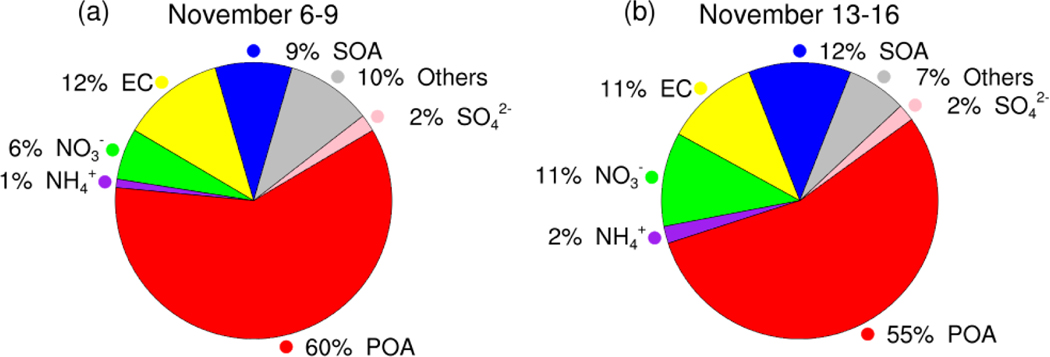
To investigate the impact on the composition of PM2.5 from the wildfires, the percentage contribution (case (①-③)/①×100% in Table 2) of different species is shown in Fig. 6. The primary organic aerosol (POA) from biomass burning is the main component of PM2.5, accounting for 60% and 55% during November 6 to 9 and 13 to 16, respectively, followed by secondary organic aerosol (SOA), EC, and NO3-, while the contribution from NH4+ and SO42- is relatively small (less than 2.5%). Our results are consistent with a previous study by Tian et al. (2009), who found that POA in Georgia accounted for more than 80% from biomass burning and NH4+ (about 2%), and SO42- contributed only less than a few percent during March 2002.
Fig. 6.
The pie chart showing mean percentage contribution of PM2.5 components over the four states of Tennessee, Kentucky, North Carolina, and Georgia during (a) November 6 to 9 and (b) November 13 to 16, 2016.
3.4. The impact of aerosol direct effect on the surface shortwave radiation and PM2.5
To assess the aerosol direct effects, cases ② and ④ (Table 2) were designed. Conceptually, the aerosol can be separated into two categories: (1) aerosol from wildfire (AEWF) and (2) all the other emission sources (AEOT). Therefore, the radiative impact may come from AEWR or AEOT or both, depending on scenarios, and then further impact the aerosol accumulation of AEWR and AEOT. The aerosol direct impact without wildfire (case ③-④ in Table 2) indicates the radiative impact because of AEOT on the accumulation of AEOT. The aerosol direct impact from wildfire (case ①-② in Table 2) implies the radiative impact because of the combined effect of AEWF and AEOT on the total aerosol accumulation of AEWF and AEOT. Therefore, to elucidate the impact from wildfire, the quantification (cases [①-②]-[③-④] in Table 2) yields the radiative impact of AEWF on the accumulation of AEWF and AEOT, as well as the radiative impact of AEOT on the accumulation of AEWF. These three effects, in fact, reflect the impact induced because of the wildfire, thus together, they are considered as the radiative impact of wildfire on aerosol in this study.
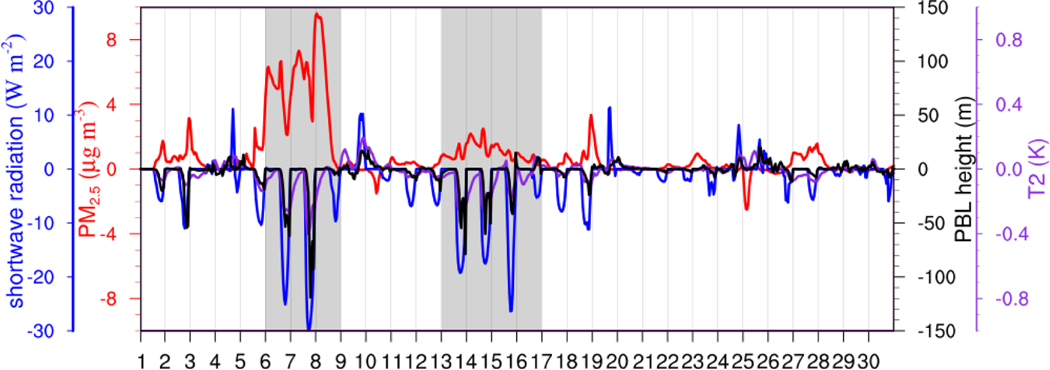
Fig. 7 shows the changes in PM2.5, PBL height, 2-m temperature (T2) and surface downward shortwave radiation because of aerosol direct effect over Tennessee and Kentucky, where the smoke plume was strong during the two episodes. The radiative effect of aerosol during typical wildfire periods resulted in significant reductions in T2 and PBL height. These results are consistent with previous studies that indicated the radiative effect of aerosol can reduce shortwave radiation reaching the ground (Sekiguchi et al., 2018), resulting in lower surface temperature (Tesfaye et al., 2014; Xing et al., 2016) and PBL height (Petaja et al., 2016; Qu et al., 2018; Quan et al., 2013; Wang et al., 2019), especially in the period of high concentrations of particulate matter. In the study periods (November 6 to 9 and November 13 to 16, 2016), the decrease of PBL height was greater than that of atypical biomass burning periods (Fig. 7). Low temperature (Wang and Christopher, 2006) and low PBL height (Quan et al., 2013) can increase the stability of the PBL, which is not conducive to the dispersion of air pollutants, leading to an increase in PM2.5 concentrations. As a result, the extra PM2.5 enhancement reaches 4.8 μg m−3, 6.2 μg m−3, 4.3 μg m−3, and 0.1 μg m−3 during November 6 to 9, respectively, and 0.6 to 1.6 μg m−3 during the second episode (November 13 to 16). To further examine the vertical profile of radiative impact, the day of November 7, 2016 was selected with hourly evolution of PM2.5, PBL height, air temperature, relative humidity and wind speed shown in Fig. 8.
Fig. 7.
Hourly variation of PM2.5, PBL height, T2, and surface downward shortwave radiation averaged over Tennessee and Kentucky during November 2016 (cases [①-②]-[③-④] in Table 2).
Fig. 8.
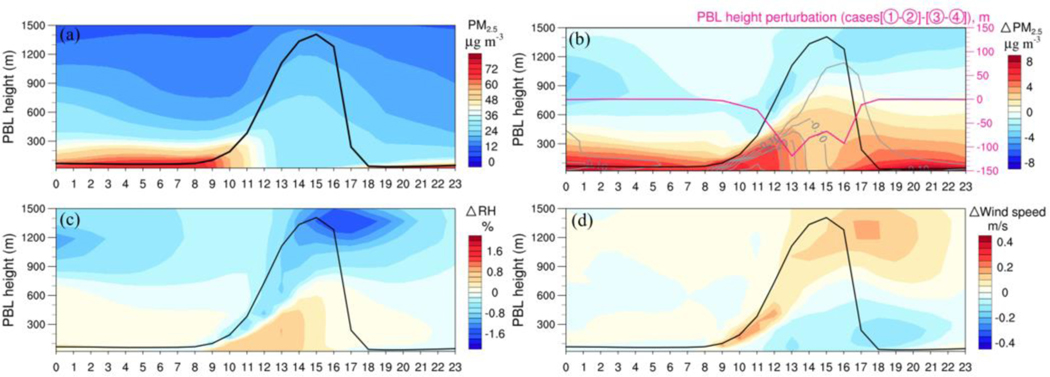
vertical profile of hourly PM2.5, PBL height, air temperature, relative humidity (RH) and wind speed due to aerosol radiative effect averaged over Tennessee and Kentucky on November 7, 2016. Except the PM2.5 concentration (shading in Fig. 8a) and PBL height (solid line in Fig. 8a-d; left Y Axis) from case ①, all the other variables indicate the perturbations (cases [①-②]-[③-④] in Table 2). The shadings represent the variable indicated on the top of the color legend, whereas the contour lines in Fig. 8b denote the perturbations of air temperature (unit: ºC).
As is shown in Fig. 8a, the vertical profile PM2.5 in case ① during November 7, 2016 delineates an evolution following the variation of the PBL height, implicative of a much higher concentration during the nigh compared to daytime in particular at the low level from the surface to approximately 300 meters. For instance, the mean PM2.5 concentrations at the low level during hours from 00:00 to 13:00 is 52.4 μg m−3, while the value (29.7 μg m−3) decreased by 43% from 13:00 to 18:00 when dispersion conditions become better, and then starts to increase again afterwards. The radiative effect of aerosol is more dramatic during the high aerosol concentrations and low PBL height (shading in Fig. 8a vs. Fig. 8b), i.e., relatively small increase of 2.8 μg m−3 occurs during the peak PBL height at 14:00 and 15:00, while the enhancement on PM2.5 concentrations is almost doubling averaged based on the other hours, reaching 5.0 μg m-3. The enhancement of PM2.5 concentrations are to a large extent favored by the changes in meteorology induced by the aerosol radiative impact, i.e., decrease in PBL height and air temperature (Fig. 8b), decrease in wind speed (Fig. 8d) and increase in relative humidity (Fig. 8c) over the low level. The decrease of the low-level wind speed and subsequently more stagnant weather conditions resulting from the aerosol radiative effect is consistent with the previous studies (Lou et al., 2019; Yang et al., 2017). In addition, the vertical profile of equivalent potential temperature, an indicator of atmospheric stability (Bolton, 1980), is also examined displaying a decrease within the PBL (figure not shown), further demonstrating the strengthening effect on atmospheric stagnation from aerosol radiative forcing, consistent with the study by Chen et al. (2019) and Gao et al. (2016). Please note that the aerosol radiative effect in this study is in somewhat smaller than that during the haze pollution in China (i.e., Fig. 10 in Chen et al. (2019)), likely caused by the much stronger aerosol pollution during the severe haze pollution, i.e., a few times higher of PM2.5 concentrations during the haze events in Beijing–Tianjin–Hebei region in December 2015 than that in this study.
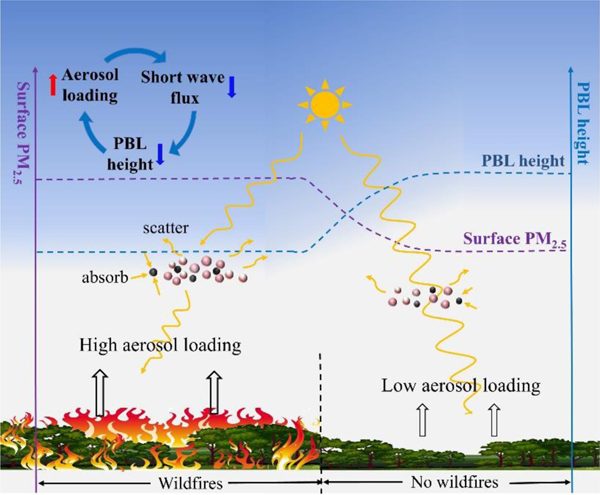
Fig. 10.
A schematic diagram of the impact of wildfire and aerosol direct effect on PM2.5. For the representation of surface PM2.5 concentrations and PBL height, the heights of solid blue and purple lines refer to their values.
The radiative effect of aerosol has a larger effect on surface PM2.5 concentrations during the first wildfire period, and the spatial distribution of the impact of aerosol direct effect on surface PM2.5 concentrations during November 6 to 8 is shown in Fig. 9 (cases [①-②]-[③-④] in Table 2) for further illustration. Through the aerosol direct effect, the PM2.5 concentrations over the wildfire intensive area (Fig. 4) tended to become even higher, which is reflected in Fig. 9. Focusing on the areas with extra enhancement of PM2.5 larger than 1 μg m−3 in the southeastern United States, the mean contribution from aerosol direct effect to total wildfire effect accounts for 11%, 10%, and 14% on November 6 to 8, 2016, respectively. Therefore, to summarize the mechanism, the atmospheric aerosols may absorb and scatter solar radiation, which can then reduce the flux of shortwave radiation reaching the ground surface, thereby decreasing the surface temperature and the PBL height, leading to the accumulation of surface pollutants. This mechanism is synthesized in Fig. 10.
Fig. 9.
Spatial distribution of contribution of aerosol direct effect on PM2.5 daily mean concentrations during November 6 to 8, 2016.
Conclusions
In this study, WRF-CMAQ was used to elucidate the impact of large wildfires over the southeastern United States in November 2016. Through the numerical experiments, we found that wildfire may contribute more than 40 μg m−3 to surface PM2.5 during the episodic events, with the average percentage contribution of 45%. The composition analysis shows that the contribution to PM2.5 from wildfire is mainly because of the enhanced POA, SOA, and EC, accounting for close to 80% of the total PM2.5. The aerosol direct effect reduces the shortwave radiation reaching the ground, near surface 2-m air temperature, and PBL height, which is then favorable to the accumulation of air pollutants such as PM2.5, leading to an extra enhancement of PM2.5. To our knowledge, this is the first study that has systematically investigated the impact of large wildfire and the aerosol direct effect over the southeastern United States.
Although the previous studies have paid more attention to the prescribed fire over the southeastern United States, the substantial contribution of wildfire to PM2.5 discussed in this study revealed the importance of wildfire over this area as well. In particular, as was pointed out by Mitchell et al. (2014), it is highly likely projected to have more severe drought in the future, which, subsequently, may increase the occurrence of wildfire and restrict the prescribed burning because of weather conditions. Using a land fire model and taking into account changes in population, afforestation, and deforestation, Ford et al. (2018) further illustrated that the wildfire may substantially increase the annual population-weighted PM2.5 concentrations from about 15% at present to more than 50% over the southeastern United States in 2100 under Representative Concentration Pathway (RCP) 8.5 (Fig. 10 in Ford et al. (2018)). More importantly, as was illustrated in Strader (2018), the exposure to wildfire was closely related to built-environment, which is, indeed, more vulnerable in the southeastern United States compared to the western United States. All these issues together point to the essential issue that more attention should be paid to wildfire in the southeastern United States to improve future air quality in this area.
Supplementary Material
Acknowledgment.
This research was supported by the grant from Fundamental Research Funds for the Central Universities (201941006).
Appendix: Statistical metrics for evaluating model performance
The model performance evaluation criteria used in this study are MFB, MFE, and R, and the formulas are shown below. The model and obs in the formulas represent the WRF-CMAQ model simulation value and the AQS observation value, respectively.
Footnotes
Competing interests. The authors declare that they have no conflict of interest.
References
- Abatzoglou JT, Williams AP, 2016. Impact of anthropogenic climate change on wildfire across western US forests. Proceedings of the National Academy of Sciences of the United States of America. 113: 11770–11775. [DOI] [PMC free article] [PubMed] [Google Scholar]
- Bolton D, 1980. The computation of equivalent potential temperature. Monthly Weather Review. 108, 1046–1053, . [DOI] [Google Scholar]
- Boylan JW, Russell AG, 2006. PM and light extinction model performance metrics, goals, and criteria for three-dimensional air quality models. Atmospheric Environment. 40: 4946–4959. [Google Scholar]
- Brey SJ, Barnes EA, Pierce JR, Wiedinmyer C, Fischer EV, 2018. Environmental Conditions, Ignition Type, and Air Quality Impacts of Wildfires in the Southeastern and Western United States. Earths Future. 6: 1442–1456. [DOI] [PMC free article] [PubMed] [Google Scholar]
- Byun D, Schere KL, 2006. Review of the governing equations, computational algorithms, and other components of the models-3 Community Multiscale Air Quality (CMAQ) modeling system. Applied Mechanics Reviews. 59: 51–77. [Google Scholar]
- Chen JM, Li CL, Ristovski Z, Milic A, Gu YT, Islam MS, et al. , 2017. A review of biomass burning: Emissions and impacts on air quality, health and climate in China. Science of the Total Environment. 579: 1000–1034. [DOI] [PubMed] [Google Scholar]
- Chen L, Zhu J, Liao H, Gao Y, Qiu YL, Zhang MG, et al. , 2019. Assessing the formation and evolution mechanisms of severe haze pollution in the Beijing-Tianjin-Hebei region using process analysis. Atmospheric Chemistry and Physics. 19: 10845–10864. [Google Scholar]
- Chiodi AM, Larkin NS, Varner JM, 2018. An analysis of Southeastern US prescribed burn weather windows: seasonal variability and El Nino associations. International Journal of Wildland Fire. 27: 176–189. [Google Scholar]
- Ding A, Huang X, Fu C, 2017. Air Pollution and Weather Interaction in East Asia. Oxford University Press. [Google Scholar]
- Ding AJ, Fu CB, Yang XQ, Sun JN, Petaja T, Kerminen VM, et al. , 2013. Intense atmospheric pollution modifies weather: a case of mixed biomass burning with fossil fuel combustion pollution in eastern China. Atmospheric Chemistry and Physics. 13: 10545–10554. [Google Scholar]
- Ding AJ, Huang X, Nie W, Sun JN, Kerminen VM, Petaja T, et al. , 2016. Enhanced haze pollution by black carbon in megacities in China. Geophysical Research Letters. 43: 2873–2879. [Google Scholar]
- Eyth A, Vukovich J, Farkas C, Strum M, 2019. Technical Support Document (TSD) Preparation of Emissions Inventories for the Version 7.1 2016 North American Emissions Modeling Platform. Retrieved from USEPA. Research Triangle; Park, NC. Available: https://www.epa.gov/sites/production/files/2019-08/documents/2016v7.1_northamerican_emismod_tsd.pdf, access: 30/01/2020. [Google Scholar]
- Ford B, Martin MV, Zelasky SE, Fischer EV, Anenberg SC, Heald CL, et al. , 2018. Future Fire Impacts on Smoke Concentrations, Visibility, and Health in the Contiguous United States. Geohealth. 2: 229–247. [DOI] [PMC free article] [PubMed] [Google Scholar]
- Fu JS, Hsu NC, Gao Y, Huang K, Li C, Lin NH, et al. , 2012. Evaluating the influences of biomass burning during 2006 BASE-ASIA: a regional chemical transport modeling. Atmospheric Chemistry and Physics. 12: 3837–3855. [Google Scholar]
- Gao Y, Zhang MG, Liu XH, Wang LL, 2016. Change in diurnal variations of meteorological variables induced by anthropogenic aerosols over the North China Plain in summer 2008. Theoretical and Applied Climatology. 124: 103–118. [Google Scholar]
- Hardy CC, Hermann SM, Mutch RE, 2001. Smoke Management Guide for Prescribed and Wildland Fire. National Wildfire Coordination Group, Boise, ID. [Google Scholar]
- Hu YT, Odman MT, Chang ME, Jackson W, Lee S, Edgerton ES, et al. , 2008. Simulation of air quality impacts from prescribed fires on an urban area. Environmental Science & Technology. 42: 3676–3682. [DOI] [PubMed] [Google Scholar]
- Huang K, Fu JS, Hsu NC, Gao Y, Dong XY, Tsay SC, et al. , 2013. Impact assessment of biomass burning on air quality in Southeast and East Asia during BASE-ASIA. Atmospheric Environment. 78: 291–302. [Google Scholar]
- Huang R, Hu YT, Russell AG, Mulholland JA, Odman MT, 2019. The Impacts of Prescribed Fire on PM2.5 Air Quality and Human Health: Application to Asthma-Related Emergency Room Visits in Georgia, USA. International Journal of Environmental Research and Public Health. 16: 14. [DOI] [PMC free article] [PubMed] [Google Scholar]
- Huang X, Wang ZL, Ding AJ, 2018. Impact of Aerosol-PBL Interaction on Haze Pollution: Multiyear Observational Evidences in North China. Geophysical Research Letters. 45: 8596–8603. [Google Scholar]
- Jaffe D, Hafner W, Chand D, Westerling A, Spracklen D, 2008. Interannual variations in PM2.5 due to wildfires in the Western United States. Environmental Science & Technology. 42: 2812–2818. [DOI] [PubMed] [Google Scholar]
- Kaulfus AS, Nair U, Jaffe D, Christopher SA, Goodrick S, 2017. Biomass Burning Smoke Climatology of the United States: Implications for Particulate Matter Air Quality. Environmental Science & Technology. 51: 11731–11741. [DOI] [PubMed] [Google Scholar]
- Koplitz SN, Nolte CG, Pouliot GA, Vukovich JM, Beidler J, 2018. Influence of uncertainties in burned area estimates on modeled wildland fire PM2.5 and ozone pollution in the contiguous US. Atmospheric Environment. 191: 328–339. [DOI] [PMC free article] [PubMed] [Google Scholar]
- Liu YQ, Goodrick S, Achtemeier G, Jackson WA, Qu JJ, Wang WT, 2009. Smoke incursions into urban areas: simulation of a Georgia prescribed burn. International Journal of Wildland Fire. 18: 336–348. [Google Scholar]
- Liu YQ, Goodrick SL, Achtemeier GL, Forbus K, Combs D, 2013. Smoke plume height measurement of prescribed burns in the south-eastern United States. International Journal of Wildland Fire. 22: 130–147. [Google Scholar]
- Lou S, Yang Y, Wang H, Smith SJ, Qian Y, Rasch PJ, 2019. Black carbon amplifies haze over the North China Plain by weakening the East Asian winter monsoon. Geophysical Research Letters. 46, 452–460. doi: 10.1029/2018GL080941. [DOI] [Google Scholar]
- Martin MV, Heald CL, Lamarque JF, Tilmes S, Emmons LK, Schichtel BA, 2015. How emissions, climate, and land use change will impact mid-century air quality over the United States: a focus on effects at national parks. Atmospheric Chemistry and Physics. 15: 2805–2823. [Google Scholar]
- McClure CD, Jaffe DA, 2018. US particulate matter air quality improves except in wildfire-prone areas. Proceedings of the National Academy of Sciences of the United States of America. 115: 7901–7906. [DOI] [PMC free article] [PubMed] [Google Scholar]
- McMeeking GR, Kreidenweis SM, Lunden M, Carrillo J, Carrico CM, Lee T, et al. , 2006. Smoke-impacted regional haze in California during the summer of 2002. Agricultural and Forest Meteorology. 137: 25–42. [Google Scholar]
- Mitchell RJ, Liu YQ, O’Brien JJ, Elliott KJ, Starr G, Miniat CF, et al. , 2014. Future climate and fire interactions in the southeastern region of the United States. Forest Ecology and Management. 327: 316–326. [Google Scholar]
- Ottmar RD, Sandberg DV, Riccardi CL, Prichard SJ, 2007. An overview of the Fuel Characteristic Classification System - Quantifying, classifying, and creating fuelbeds for resource planning. Canadian Journal of Forest Research-Revue Canadienne De Recherche Forestiere. 37: 2383–2393. [Google Scholar]
- Petaja T, Jarvi L, Kerminen VM, Ding AJ, Sun JN, Nie W, et al. , 2016. Enhanced air pollution via aerosol-boundary layer feedback in China. Scientific Reports. 6. [DOI] [PMC free article] [PubMed] [Google Scholar]
- Pimonsree S, Vongruang P, Sumitsawan S, 2018. Modified biomass burning emission in modeling system with fire radiative power: Simulation of particulate matter in Mainland Southeast Asia during smog episode. Atmospheric Pollution Research. 9: 133–145. [Google Scholar]
- Prichard SJ, Ottmar RD, Anderson GK, 2007. Consume 3.0 User’s Guide. Retrieved from USDA Forest Service. Pacific Northwest Research Station, Seattle, WA. Available: https://www.fs.fed.us/pnw/fera/research/smoke/consume/consume30_users_guide.pdf, access: 01/03/2020. [Google Scholar]
- Qu WJ, Wang J, Zhang XY, Wang YQ, Gao SH, Zhao CH, et al. , 2018. Effect of weakened diurnal evolution of atmospheric boundary layer to air pollution over eastern China associated to aerosol, cloud - ABL feedback. Atmospheric Environment. 185: 168–179. [Google Scholar]
- Quan JN, Gao Y, Zhang Q, Tie XX, Cao JJ, Han SQ, et al. , 2013. Evolution of planetary boundary layer under different weather conditions, and its impact on aerosol concentrations. Particuology. 11: 34–40. [Google Scholar]
- Raffuse SM, Pryden DA, Sullivan DC, Larkin NK, Strand T, Solomon R, 2009. SMARTFIRE algorithm description. U.S. Environmental Protection Agency, Research Triangle; Park, NC. Prepared by Sonoma Technology, Inc., Petaluma, CA, and the US Forest Service, AirFire Team, Pacific Northwest Research Laboratory, Seattle, WA. STI-905517–3719. [Google Scholar]
- Rappold AG, Reyes J, Pouliot G, Cascio WE, Diaz-Sanchez D, 2017. Community Vulnerability to Health Impacts of Wildland Fire Smoke Exposure. Environmental Science & Technology. 51: 6674–6682. [DOI] [PMC free article] [PubMed] [Google Scholar]
- Sekiguchi A, Shimadera H, Kondo A, 2018. Impact of Aerosol Direct Effect on Wintertime PM2.5 Simulated by an Online Coupled Meteorology-Air Quality Model over East Asia. Aerosol and Air Quality Research. 18: 1068–1079. [Google Scholar]
- Souri AH, Choi Y, Jeon W, Kochanski AK, Diao LJ, Mandel J, et al. , 2017. Quantifying the Impact of Biomass Burning Emissions on Major Inorganic Aerosols and Their Precursors in the US. Journal of Geophysical Research-Atmospheres. 122: 12020–12041. [Google Scholar]
- Squizzato S, Masiol M, Rich DQ, Hopke PK, 2018. PM2.5 and gaseous pollutants in New York State during 2005–2016: Spatial variability, temporal trends, and economic influences. Atmospheric Environment. 183: 209–224. [Google Scholar]
- Strader SM, 2018. Spatiotemporal changes in conterminous US wildfire exposure from 1940 to 2010. Natural Hazards. 92: 543–565. [Google Scholar]
- Tesfaye M, Botai J, Sivakumar V, Tsidu GM, 2014. Simulation of biomass burning aerosols mass distributions and their direct and semi-direct effects over South Africa using a regional climate model. Meteorology and Atmospheric Physics. 125: 177–195. [Google Scholar]
- Tian D, Hu YT, Wang YH, Boylan JW, Zheng M, Russell AG, 2009. Assessment of Biomass Burning Emissions and Their Impacts on Urban and Regional PM2.5: A Georgia Case Study. Environmental Science & Technology. 43: 299–305. [DOI] [PubMed] [Google Scholar]
- Urbanski SP, Reeves MC, Corley RE, Silverstein RP, Hao WM, 2018. Contiguous United States wildland fire emission estimates during 2003–2015. Earth System Science Data. 10: 2241–2274. [Google Scholar]
- USEPA, 2019. Particulate Matter (PM2.5) Trends. Available: https://www.epa.gov/air-trends/particulate-matter-pm25-trends.
- Vongruang P, Wongwises P, Pimonsree S, 2017. Assessment of fire emission inventories for simulating particulate matter in Upper Southeast Asia using WRF-CMAQ. Atmospheric Pollution Research. 8: 921–929. [Google Scholar]
- Voulgarakis A, Marlier ME, Faluvegi G, Shindell DT, Tsigaridis K, Mangeon S, 2015. Interannual variability of tropospheric trace gases and aerosols: The role of biomass burning emissions. Journal of Geophysical Research-Atmospheres. 120: 7157–7173. [Google Scholar]
- Wang HF, Li ZQ, Lv Y, Xu H, Li KT, Li DH, et al. , 2019. Observational study of aerosol-induced impact on planetary boundary layer based on lidar and sunphotometer in Beijing. Environmental Pollution. 252: 897–906. [DOI] [PubMed] [Google Scholar]
- Wang J, Christopher SA, 2006. Mesoscale modeling of Central American smoke transport to the United States: 2. Smoke radiative impact on regional surface energy budget and boundary layer evolution. Journal of Geophysical Research-Atmospheres. 111. [Google Scholar]
- Wilkins JL, Pouliot G, Foley K, Appel W, Pierce T, 2018. The impact of US wildland fires on ozone and particulate matter: a comparison of measurements and CMAQ model predictions from 2008 to 2012. International Journal of Wildland Fire. 27: 684–698. [DOI] [PMC free article] [PubMed] [Google Scholar]
- Williams AP, Cook BI, Smerdon JE, Bishop DA, Seager R, Mankin JS, 2017. The 2016 southeastern US drought: an extreme departure from centennial wetting and cooling. Journal of Geophysical Research-Atmospheres. 122: 10888–10905. [DOI] [PMC free article] [PubMed] [Google Scholar]
- Wong DC, Pleim J, Mathur R, Binkowski F, Otte T, Gilliam R, et al. , 2012. WRF-CMAQ two-way coupled system with aerosol feedback: software development and preliminary results. Geoscientific Model Development. 5: 299–312. [Google Scholar]
- Wong DC, Yang CE, Fu JS, Wong K, Gao Y, 2015. An approach to enhance pnetCDF performance in environmental modeling applications. Geoscientific Model Development. 8: 1033–1046. [Google Scholar]
- Wu J, Winer AM, Delfino RJ, 2006. Exposure assessment of particulate matter air pollution before, during, and after the 2003 Southern California wildfires. Atmospheric Environment. 40: 3333–3348. [Google Scholar]
- Xing J, Wang JD, Mathur R, Pleim J, Wang SX, Hogrefe C, et al. , 2016. Unexpected Benefits of Reducing Aerosol Cooling Effects. Environmental Science & Technology. 50: 7527–7534. [DOI] [PubMed] [Google Scholar]
- Yang Y, Russell LM, Lou SJ, Liao H, Guo JP, Liu Y, et al. , 2017. Dust-wind interactions can intensify aerosol pollution over eastern China. Nature Communications. 8: 8. [DOI] [PMC free article] [PubMed] [Google Scholar]
- Yue X, Mickley LJ, Logan JA, Kaplan JO, 2013. Ensemble projections of wildfire activity and carbonaceous aerosol concentrations over the western United States in the mid-21st century. Atmospheric Environment. 77: 767–780. [DOI] [PMC free article] [PubMed] [Google Scholar]
- Zeng T, Wang YH, Yoshida Y, Tian D, Russell AG, Barnard WR, 2008. Impacts of Prescribed Fires on Air Quality over the Southeastern United States in Spring Based on Modeling and Ground/Satellite Measurements. Environmental Science & Technology. 42: 8401–8406. [DOI] [PubMed] [Google Scholar]
- Zhang X, Hecobian A, Zheng M, Frank NH, Weber RJ, 2010. Biomass burning impact on PM2.5 over the southeastern US during 2007: integrating chemically speciated FRM filter measurements, MODIS fire counts and PMF analysis. Atmospheric Chemistry and Physics. 10: 6839–6853. [Google Scholar]
- Zhang YY, Obrist D, Zielinska B, Gertler A, 2013. Particulate emissions from different types of biomass burning. Atmospheric Environment. 72: 27–35. [Google Scholar]
- Zhao C, Liu X, Leung LR, Johnson B, McFarlane SA, Gustafson WI, et al. , 2010. The spatial distribution of mineral dust and its shortwave radiative forcing over North Africa: modeling sensitivities to dust emissions and aerosol size treatments. Atmospheric Chemistry and Physics. 10: 8821–8838. [Google Scholar]
Associated Data
This section collects any data citations, data availability statements, or supplementary materials included in this article.


