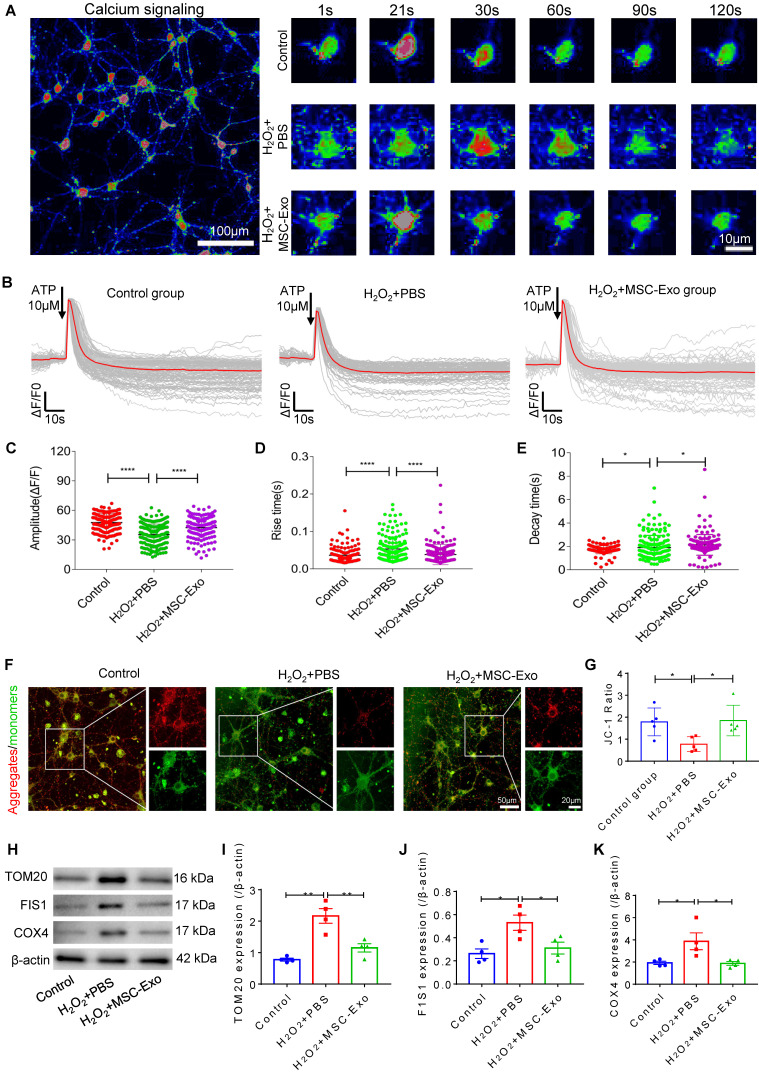
Figure 4.
Amelioration by MSC-EVs on the H2O2-induced calcium transients and mitochondrial changes in the primary culture. (A) Representative images show the Fluo-8 AM (a calcium indicator) signaling (left) and fluorescence properties (right, 1~120s) obtained with confocal microscopy in different cultures. Scale bar (left) = 100 µm, scale bar (right) = 10 µm. (B) Igor software assay for fluorescent signals of calcium transients in the first (20s) and second (100s) phases after ATP stimulation in the experimental groups (n > 100 per group). (C-E) Quantification of the amplitude (ΔF/F) (C), rise time (D), and decay time (E) of the intracellular calcium transients in each group (n > 100). (F) JC-1 staining of MMP (red fluorescence represents aggregates; green fluorescence represents monomers) in the primary culture of each group. (G) Histogram shows the ratio of JC-1 fluorescence (Red/Green) in each group (n = 5 per group). Scale bar (G) = 50 µm, bar (H, right images) = 20 µm. (H) Western blotting of TOM20, FIS1, and COX IV expression in different cultures. (I-K) Statistical analysis shows TOM20 (I), FIS1 (J), and COX IV (K) expression in the experimental groups (n = 4 per group). MSC-EVs: mesenchymal stem cell-derived extracellular vesicles; n: number; ATP: adenosine monophosphate; MMP: mitochondrial membrane potential; TOM20: translocase of the outer mitochondrial membrane 20; FIS1: fission 1; COX IV: cytochrome c oxidase IV. * p < 0.05, ** p < 0.01, **** p < 0.0001.

