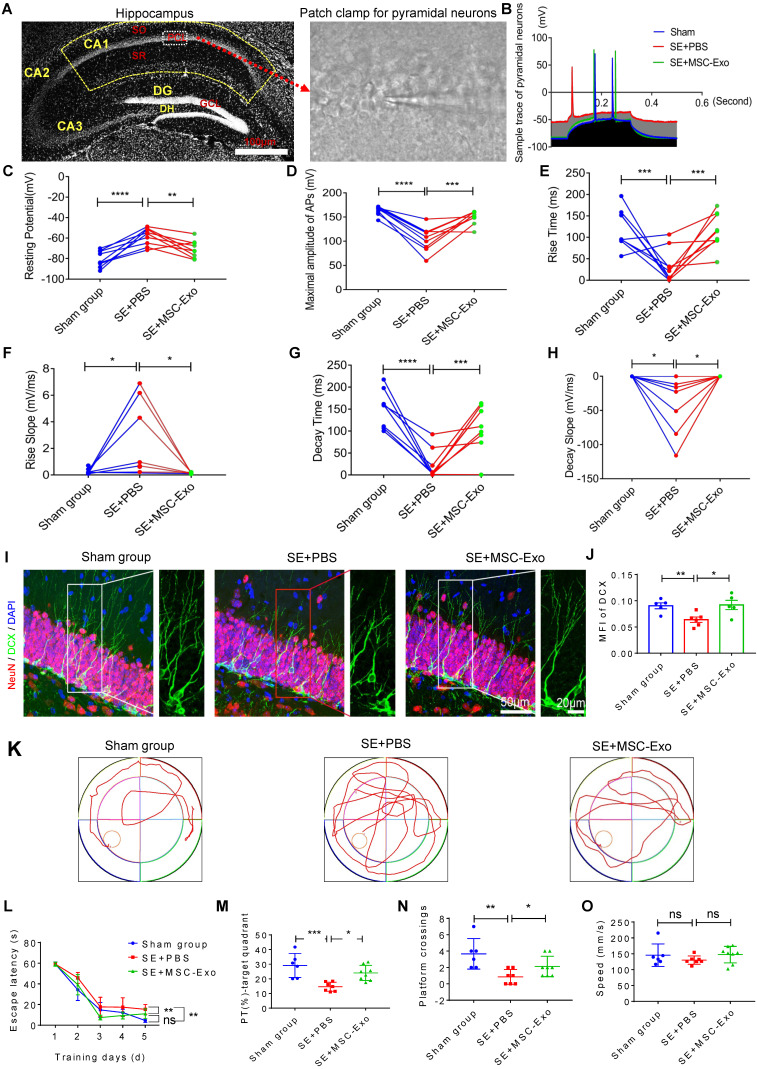
Figure 7.
Restorative effects of MSC-EVs on hippocampal neurons in the chronic stage of seizures. (A) Representative images show hippocampal subfields (left) and whole-cell patch-clamp for CA1 pyramidal neurons (right). Scale bar = 100 µm. (B) Representative potential traces of pyramidal neurons in each group. (C-H) Statistical analysis of the resting potential (C), maximal amplitude of APs (D), rise time (E), slope (F), decay time (G), and slope (H) in hippocampal CA1 pyramidal neurons of each group (n = 6~9 cells per group). (I) Representative images of DCX (green) immunostaining with NeuN (red) and DAPI (blue) in the hippocampal dentate gyms (DG) of experimental groups, right images show the magnification of DCX (green) staining. Scale bar (left images) = 50 µm, scale bar (right magnified images) = 20 µm. (J) Statistical analysis of the MFI of DCX in the DG of each group (n = 4 per group). (K-O) Representative traces show the MWM test for experimental groups (K), statistical analysis for the escape latency (L), PT (%) target quadrant (M), platform crossings (N) and swim speed (O) in each group (n = 6~8 per group). MSC-EVs: mesenchymal stem cell-derived extracellular vesicles; SO: stratum oriens; PCL: pyramidal cell layer; SR: stratum radiatum; ns: no significance; n: number; DG: dentate gyrus; GCL: granular cell layer; DH: dentate hilus; DCX: doublecortin; DAPI: 4',6-Diamidino-2-phenylindole; DG: dentate gyrus; MFI: mean fluorescence intensity; MWM: Morris water maze. * p < 0.05, ** p < 0.01, *** p < 0.001, **** p < 0.0001, ns p > 0.05.

