

Abstract
Common germline variants of the APOE gene are major risk modifiers of neurodegenerative and atherosclerotic diseases1–3, but their impact on cancer outcome is poorly defined. Here, we report that, in a reversal of their impact on Alzheimer’s disease, the APOE4 and APOE2 variants confer favorable and poor outcomes in melanoma, respectively. Mice bearing the human APOE4 variant exhibited reduced melanoma progression in comparison to APOE2 mice. APOE4 mice exhibited enhanced anti-tumor immune activation relative to APOE2 mice, and T cell depletion experiments showed that the impact of APOE genotype on melanoma progression was mediated by altered anti-tumor immunity. Consistently, melanoma patients carrying the APOE4 variant experienced improved survival in comparison to APOE2 carriers. Importantly, APOE4 mice also showed improved outcomes under PD1 checkpoint blockade relative to APOE2 mice, and patients carrying APOE4 experienced improved anti-PD1 immunotherapy survival after progression on frontline regimens. Finally, enhancing APOE expression via pharmacologic activation of liver-X-receptors, previously shown to boost anti-tumor immunity4, exhibited therapeutic efficacy in APOE4 but not in APOE2 mice. These findings demonstrate that prevalent human germline variants can impact the outcome trajectory of a future malignancy and warrant prospective investigation of APOE genotype as a biomarker for melanoma outcome and therapeutic response.
The secreted glycoprotein APOE exerts pleiotropic effects on organismal metabolism and immunity3,5. In humans, there are three highly prevalent genetic variants of APOE, termed APOE2, APOE3, and APOE4. The products of these gene variants differ by only one or two amino acids but exhibit differential binding to, and activation of, APOE receptors (Fig. 1a)6–9. Importantly, the APOE4 variant is the largest monogenetic risk factor for Alzheimer’s disease, while APOE2 is protective1,2. In addition, APOE variants modulate other inflammation-associated pathologies, including atherosclerosis3. The potential association between APOE genotype and cancer outcome has remained inconclusive10,11. We previously reported that tumoral and stroma-derived APOE suppresses melanoma progression4,12,13. In contrast to tumoral APOE, for which expression becomes repressed during melanoma progression, stroma-derived APOE expression is dictated by the genetics of the host12. We thus reasoned that distinct APOE germline variants may differentially regulate melanoma progression and tested this hypothesis through experimental and clinical association approaches.
Fig. 1 |. Human APOE variants modulate progression of murine melanoma.
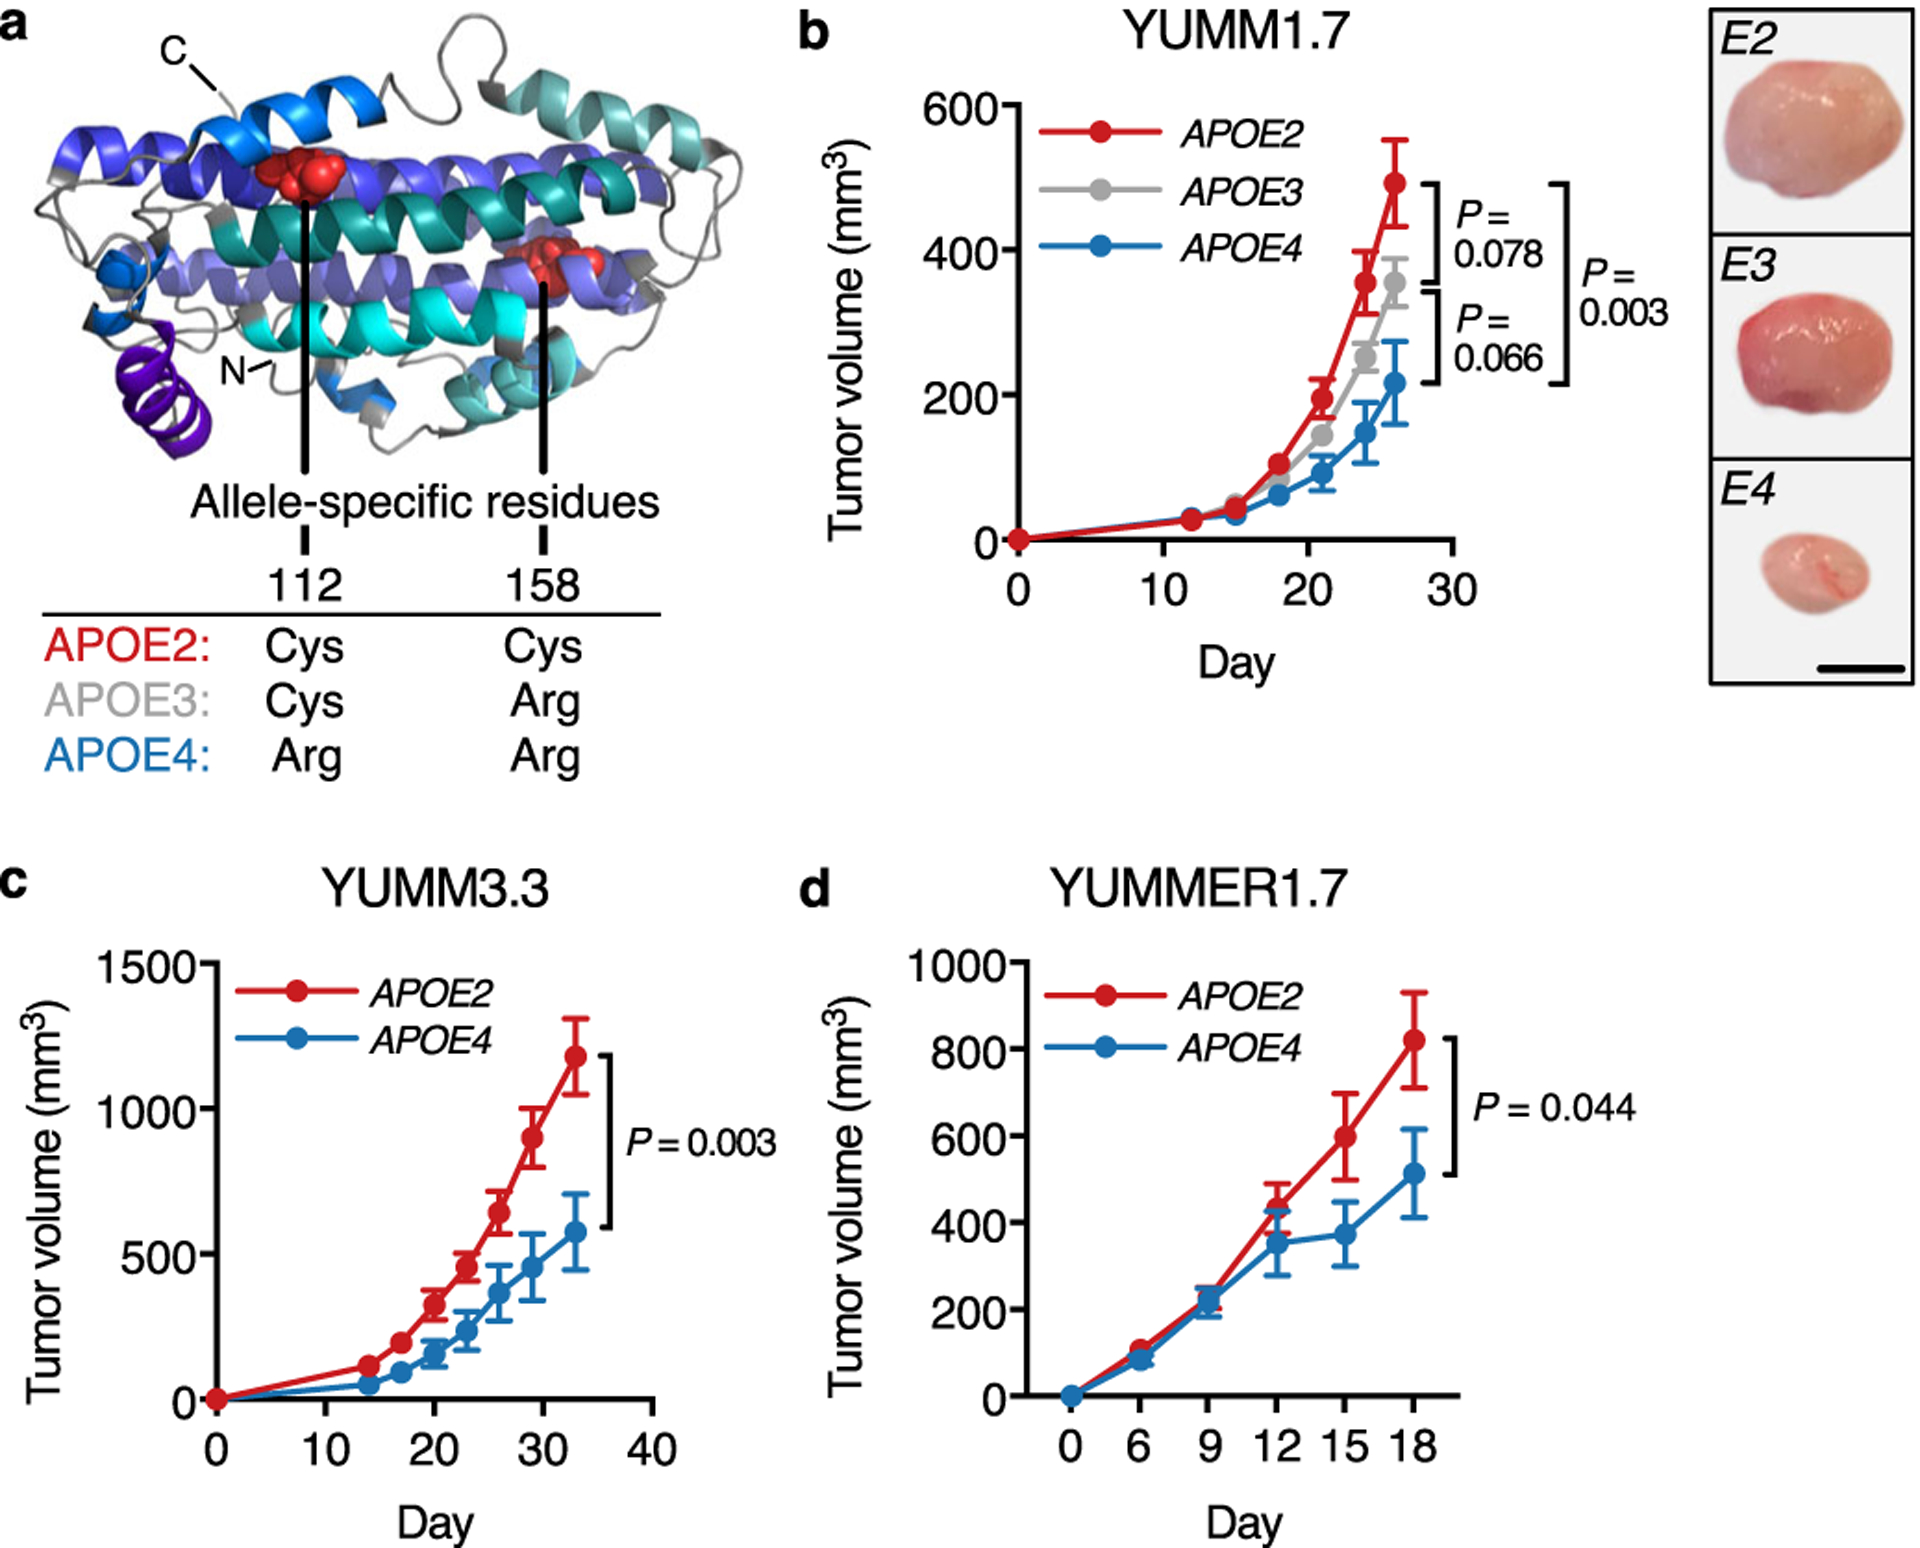
a, Structural representation of APOE3 (based on structure by Chen and colleagues6). b, Growth of murine YUMM1.7 tumors in APOE knock-in mice (n = 11 mice per group, representative of two independent experiments). Representative tumors correspond to day 26 (scale bar, 3 mm). c, Growth of murine YUMM3.3 melanomas in human APOE knock-in mice (n = 13 mice per group, representative of two independent experiments). d, Growth of murine YUMMER1.7 melanomas in APOE knock-in mice (n = 13 and 11 mice for APOE2 and APOE4, respectively; representative of two independent experiments). Graphs represent mean values ± s.e.m. All P values are based on two-tailed t-tests.
To assess whether host APOE variants impact melanoma outcome, we used mice in which the endogenous murine Apoe locus has been replaced with human APOE variants14–16. Remarkably, progression of syngeneic YUMM1.7 mouse melanoma tumors was significantly slower in APOE4 relative to APOE2 mice (Fig. 1b). We validated these findings in the independent YUMM3.3 model and in the YUMMER1.7 melanoma model, a more immunogenic derivative of the YUMM1.7 model17 (Fig. 1c–d). To assess the impact of APOE genotype on melanoma metastasis, we used B16F10 melanoma cells, which reproducibly metastasize in tail vein colonization assays. Consistent with our observations in primary tumor progression, APOE4 mice showed reduced metastatic progression compared to APOE2 mice (Extended Data Fig. 1a–b). Thus, stromal APOE genotype causally impacted progression in murine melanoma models.
APOE modulates immune responses in a number of different contexts18–21. In cancer, APOE enhances anti-tumor immunity by modulating myeloid immune cell populations4. We therefore sought to determine whether APOE variants differentially impact the immune response in cancer. Flow cytometry revealed enhanced recruitment of CD45+ leukocytes into melanoma tumors hosted by APOE4 mice compared to APOE2 mice (Fig. 2a and Extended Data Fig. 2a–d). The proportions of immunosuppressive Ly6G+ granulocytic myeloid-derived suppressor cells (G-MDSCs) and tumor-associated macrophages were reduced in APOE4 relative to APOE2 mice (Fig. 2b). Concomitantly, we observed increased proportions of anti-tumor effector cells in APOE4 mice, such as natural killer (NK) and CD8+ T cells (Fig. 2c). We validated enhanced CD8+ T cell recruitment into tumors hosted by APOE4 versus APOE2 mice by histology (Extended Data Fig. 2e). Intracellular flow cytometry revealed enhanced activation of NK, CD4+, and CD8+ T cells in APOE4 mice relative to APOE2 mice, as illustrated by increased Granzyme B and Interferon-γ expression (Fig. 2d–f). To more comprehensively characterize the immune microenvironment, we performed single-cell RNA-sequencing (scRNA-seq) of CD45+ leukocytes sorted from tumors in APOE variant mice (Fig. 2g and Extended Data Fig. 3a). Consistent with the flow cytometry results, APOE4 hosts exhibited expansion and activation of NK and CD8+ T effector cells, as well as profound shifts in the myeloid compartment (Fig. 2h and Extended Data Fig. 3b–d). Analysis of differentially expressed genes in individual clusters between APOE4 and APOE2 mice revealed enrichment of pathways implicated in anti-tumor immune activity, such as Interferon signaling. This was accompanied by depletion of pathways implicated in pro-tumor phenotypes, such as angiogenesis (Fig. 2i). These data suggest that APOE genotype modulated both the abundance and the functional state of the tumor immune microenvironment, with the APOE4 variant eliciting an enhanced anti-tumor immune profile relative to the APOE2 variant.
Fig. 2 |. Human APOE variants modulate the tumor immune microenvironment.
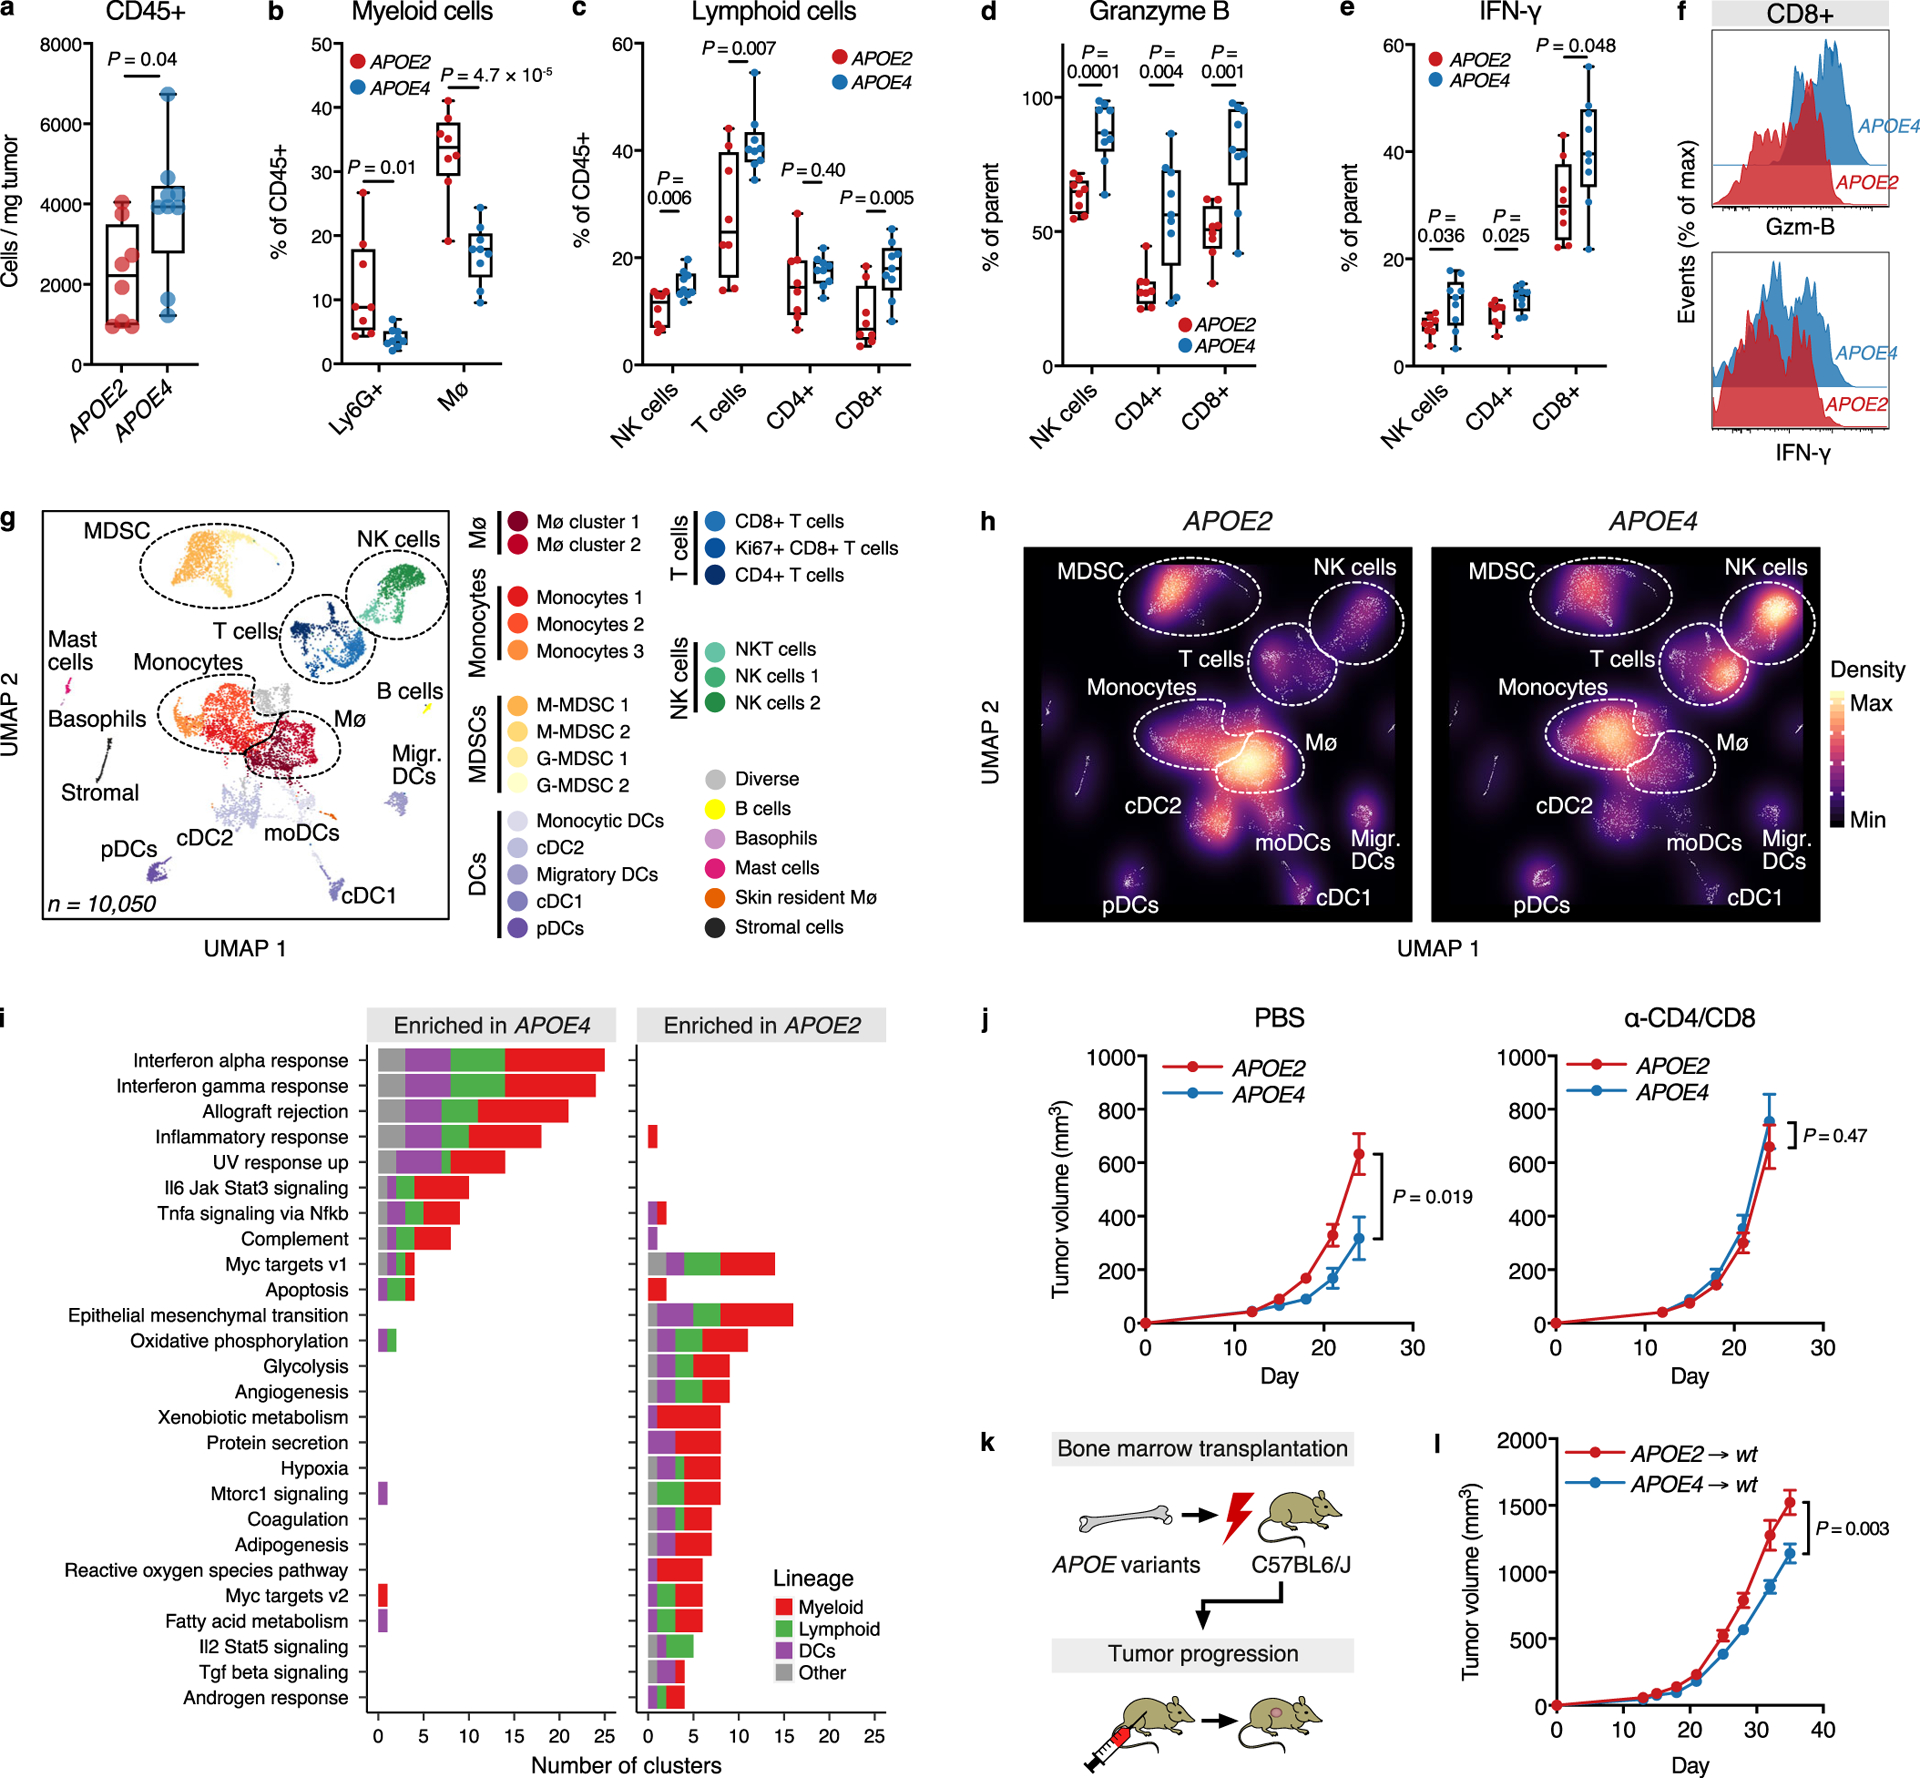
a, Abundance of CD45+ leukocytes in YUMM1.7 tumors in APOE2 and APOE4 knock-in mice (two-tailed t-test). b-c, Proportion of tumor-infiltrating myeloid (b) and lymphoid (c) immune subsets in YUMM1.7 melanoma-bearing APOE2 and APOE4 mice (two-tailed t-tests). d-e, Expression of Granzyme B (Gzm-B) (d) and Interferon-γ (IFN-γ) (e) in immune effector cells infiltrating YUMM1.7 melanomas in APOE2 versus APOE4 mice (one-tailed t-tests). f, Representative flow cytometry plots from (d-e) illustrating the expression of activation markers in YUMM1.7-infiltrating CD8+ T cells in APOE2 and APOE4 mice. g, Uniform manifold approximation and projection (UMAP) plot of 10,050 CD45+ RNA-sequenced tumor-infiltrating immune cells from APOE2 and APOE4 hosts. h, Density plot of (g) stratified by APOE genotype. i, Number of immune cell clusters as identified by scRNA-seq with pathway enrichment in genes differentially expressed between APOE4 and APOE2 (pathways listed with significance in > 3 clusters; significance based on two-sided permutation testing and adjusted for number of tested pathways by FDR). j, Impact of T cell depletion on YUMM1.7 tumor growth in human APOE knock-in mice (n = 24, 11, 11, and 10 mice for APOE2/PBS, APOE4/PBS, APOE2/depletion and APOE4/depletion groups, respectively; two-tailed t-tests; representative of two independent experiments). k, Experimental approach to determine the impact of hematopoietic cell-derived APOE variants on melanoma progression. l, Growth of YUMM1.7 tumors in C57BL/6J wild-type mice transplanted with bone marrow from human APOE knock-in mice (n = 15 per group, two-tailed t-test). Box plots in (a-e) show median, and whiskers represent minimum and maximum). For (a-f), n = 8 and 9 mice for APOE2 and APOE4 groups, respectively, and data are representative of two independent experiments. Graphs in (j) and (l) represent mean values ± s.e.m. For (g-i), n = 6 biologically averaged mice per group.
We next sought to investigate whether immune modulation causally mediated the differential impact of APOE genotype on melanoma progression. Remarkably, T cell depletion completely abrogated growth differences of YUMM1.7 tumors in APOE4 versus APOE2 mice (Fig. 2j and Extended Data Fig. 4). To assess whether the hematopoietic cell compartment could mediate APOE genotype-dependent effects on melanoma progression, we transplanted hematopoietic stem cells from APOE4 and APOE2 mice into lethally irradiated wild-type mice harboring the murine Apoe gene. YUMM1.7 tumor progression was slower in mice transplanted with APOE4 versus APOE2 bone marrow (Fig. 2k–l). Thus, APOE genotype impacted melanoma progression by modulating the anti-tumor immune response, and APOE genotype within the hematopoietic compartment was sufficient to drive differential melanoma progression.
In addition to its immunomodulatory effects, APOE exerts pleiotropic anti-tumor effects in part by suppressing melanoma cell invasion and endothelial recruitment12. We therefore assessed whether APOE variants could also differentially impact these tumoral phenotypes. Indeed, recombinant APOE4 protein was more efficient than APOE2 in suppressing invasion of melanoma cells (Extended Data Fig. 5a). APOE4 was also more potent than APOE2 in suppressing endothelial recruitment by melanoma cells (Extended Data Fig. 5b). Consistent with this in vitro finding, blood vessel density in vivo in YUMM1.7 tumors was significantly reduced in APOE4 versus APOE2 mice (Extended Data Fig. 5c). Thus, APOE variants differentially impacted multiple key phenotypes associated with enhanced tumor progression and metastasis.
To determine if APOE genotype associates with outcomes in human melanoma, we assessed germline APOE variant status in patients from The Cancer Genome Atlas (TCGA), who were originally diagnosed with primary melanomas at risk for relapse (stage II/III) (Fig. 3a)22. Neither APOE2 nor APOE4 carriers were enriched in the TCGA-SKCM study in comparison to a control group with similar age and ethnic composition23, indicating that neither genotype associated with increased melanoma incidence (Extended Data Fig. 6a–b). Strikingly, however, APOE carrier status was significantly associated with survival (median survival of 2.4, 5.2, and 10.1 years in APOE2 carriers, APOE3 homozygotes, and APOE4 carriers, respectively; P = 0.0038, log-rank test; Fig. 3b). Cox proportional hazard regression analysis revealed an increased hazard ratio in this dataset for APOE2 carriers versus APOE3 homozygotes (HR = 2.08, P = 0.01) and versus APOE4 carriers (HR = 3.69, P < 0.001) (Fig. 3c). There were no significant differences between APOE carrier groups in potentially confounding clinical characteristics at the time of diagnosis, and APOE genotype remained significantly associated with survival in a multivariable analysis (Extended Data Fig. 7). The distribution of APOE carrier status was not significantly different between normal tissue and tumor samples, and the same carrier status was identified in sample pairs of 95.6% of individuals with available results (94.2% of all samples) (Extended Data Fig. 8), suggesting our genotyping approach to be robust and loss of heterozygosity events in the tumor to be rare. Our observation of improved melanoma survival outcomes of APOE4 carriers relative to APOE2 carriers was especially surprising since APOE4 status associates with reduced longevity and would thus be expected to counter potential enhanced cancer survival effects24. We reasoned that our ability to observe this effect of APOE genotype on survival was likely due to the fact that survival in the TCGA melanoma study is primarily determined by the high rates of melanoma-associated death in this group of high-risk patients22,25. To validate these findings in an independent study, we imputed APOE genotype in a melanoma genome-wide association study26 (Extended Data Fig. 9a–b). Consistent with our findings in the TCGA-SKCM study, APOE2 genotype was associated with the shortest survival in patients at high risk of melanoma-associated death (Clark level 5). In contrast, APOE2 carriers trended towards better survival in patients with low risk of melanoma-associated death (Extended Data Fig. 9c–g), consistent with the known association of APOE2 with enhanced lifespan in the general population24. Of note, overall survival of patients in the MDACC study was significantly better than survival in the TCGA study, likely attributable to significant differences in factors predisposing for better outcome such as younger age and lower Clark level (Extended Data Fig. 9h–k). Indeed, restricting the analysis to the subset of patients at the highest risk for relapse and melanoma-associated death as defined by age and high Clark level revealed a pronounced association of APOE genotype with survival in this dataset (Fig. 3d), mirroring the findings in the TCGA study. Thus, germline genetic variants of APOE differentially associated with survival in patients with advanced melanoma who were at increased risk for melanoma-associated death.
Fig. 3 |. APOE germline variants predict survival in human melanoma.
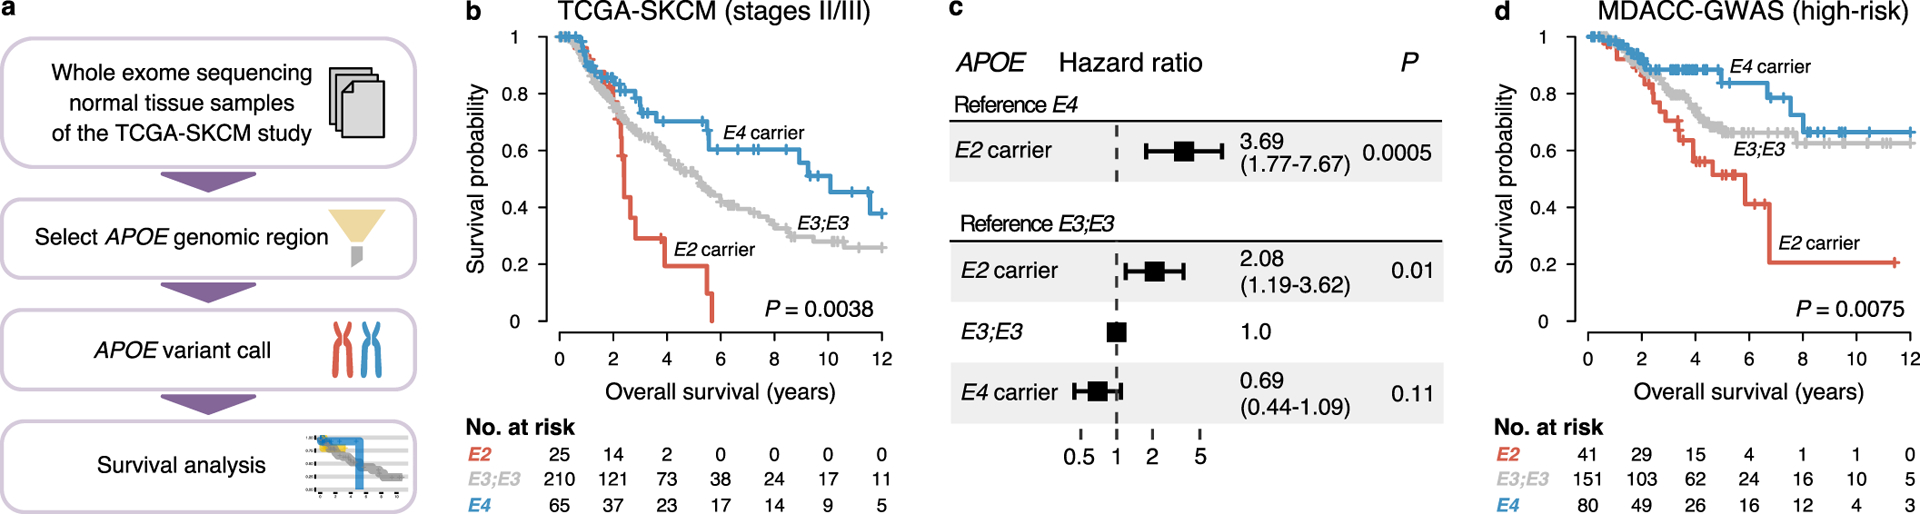
a, Computational pipeline to analyze the impact of APOE genotype on melanoma outcome in the TCGA-SKCM study. b-c, Survival (b) and hazard ratios (c) of stage II/III melanoma patients in the TCGA-SKCM study stratified by APOE carrier status (P values according to two-sided log-rank test (b) and two-sided Cox proportional hazards model (c); numbers in parentheses indicate 95% confidence interval). d, Survival of high-risk melanoma patients in the MDACC GWAS study as defined by advanced local melanoma and older age (P value according to two-sided log-rank test).
Immunotherapy has transformed melanoma treatment27–29, prompting us to assess whether APOE genotype could also impact melanoma progression in the context of immunotherapy. To this end, we analyzed the effect of APOE genotype on progression of the immunogenic YUMMER1.7 melanoma model, which is susceptible to anti-PD1 checkpoint therapy17. APOE4 mice survived significantly longer than APOE2 mice upon anti-PD1 treatment, suggesting that APOE genotype modulates melanoma outcome also in the context of immunotherapy (Fig. 4a–b). To assess whether this effect could also be observed in humans, we analyzed melanoma patients who received anti-PD1 checkpoint inhibition therapy after progressing on anti-CTLA4 checkpoint blockade30. Indeed, APOE genotype was significantly associated with survival in this study. Consistent with our observations on survival of mostly non-immunotherapy-treated patients of the TCGA and MDACC studies described above, APOE4 and APOE2 carriers exhibited the longest and shortest survival outcomes, respectively, upon anti-PD1 therapy (Fig. 4c). We validated these findings in an independent study of patients receiving anti-PD1 therapy upon progressing on CTLA4 blockade31. APOE4 and APOE2 carriers in this study also exhibited the longest and shortest survival outcomes, respectively (Fig. 4d). Thus, in both of these studies, APOE genotype associated with survival in patients who had progressed on prior immunotherapy. We observed no significant impact of APOE genotype on survival in patients of the study of Riaz et al. who received PD1-blockade with no prior checkpoint immunotherapy (Extended Data Fig. 10). This could be either due to the small sample size or suggest a potential contextual basis for APOE-dependent modulation of immunotherapy outcome.
Fig. 4 |. APOE genotype modulates melanoma progression in the context of immunotherapy.
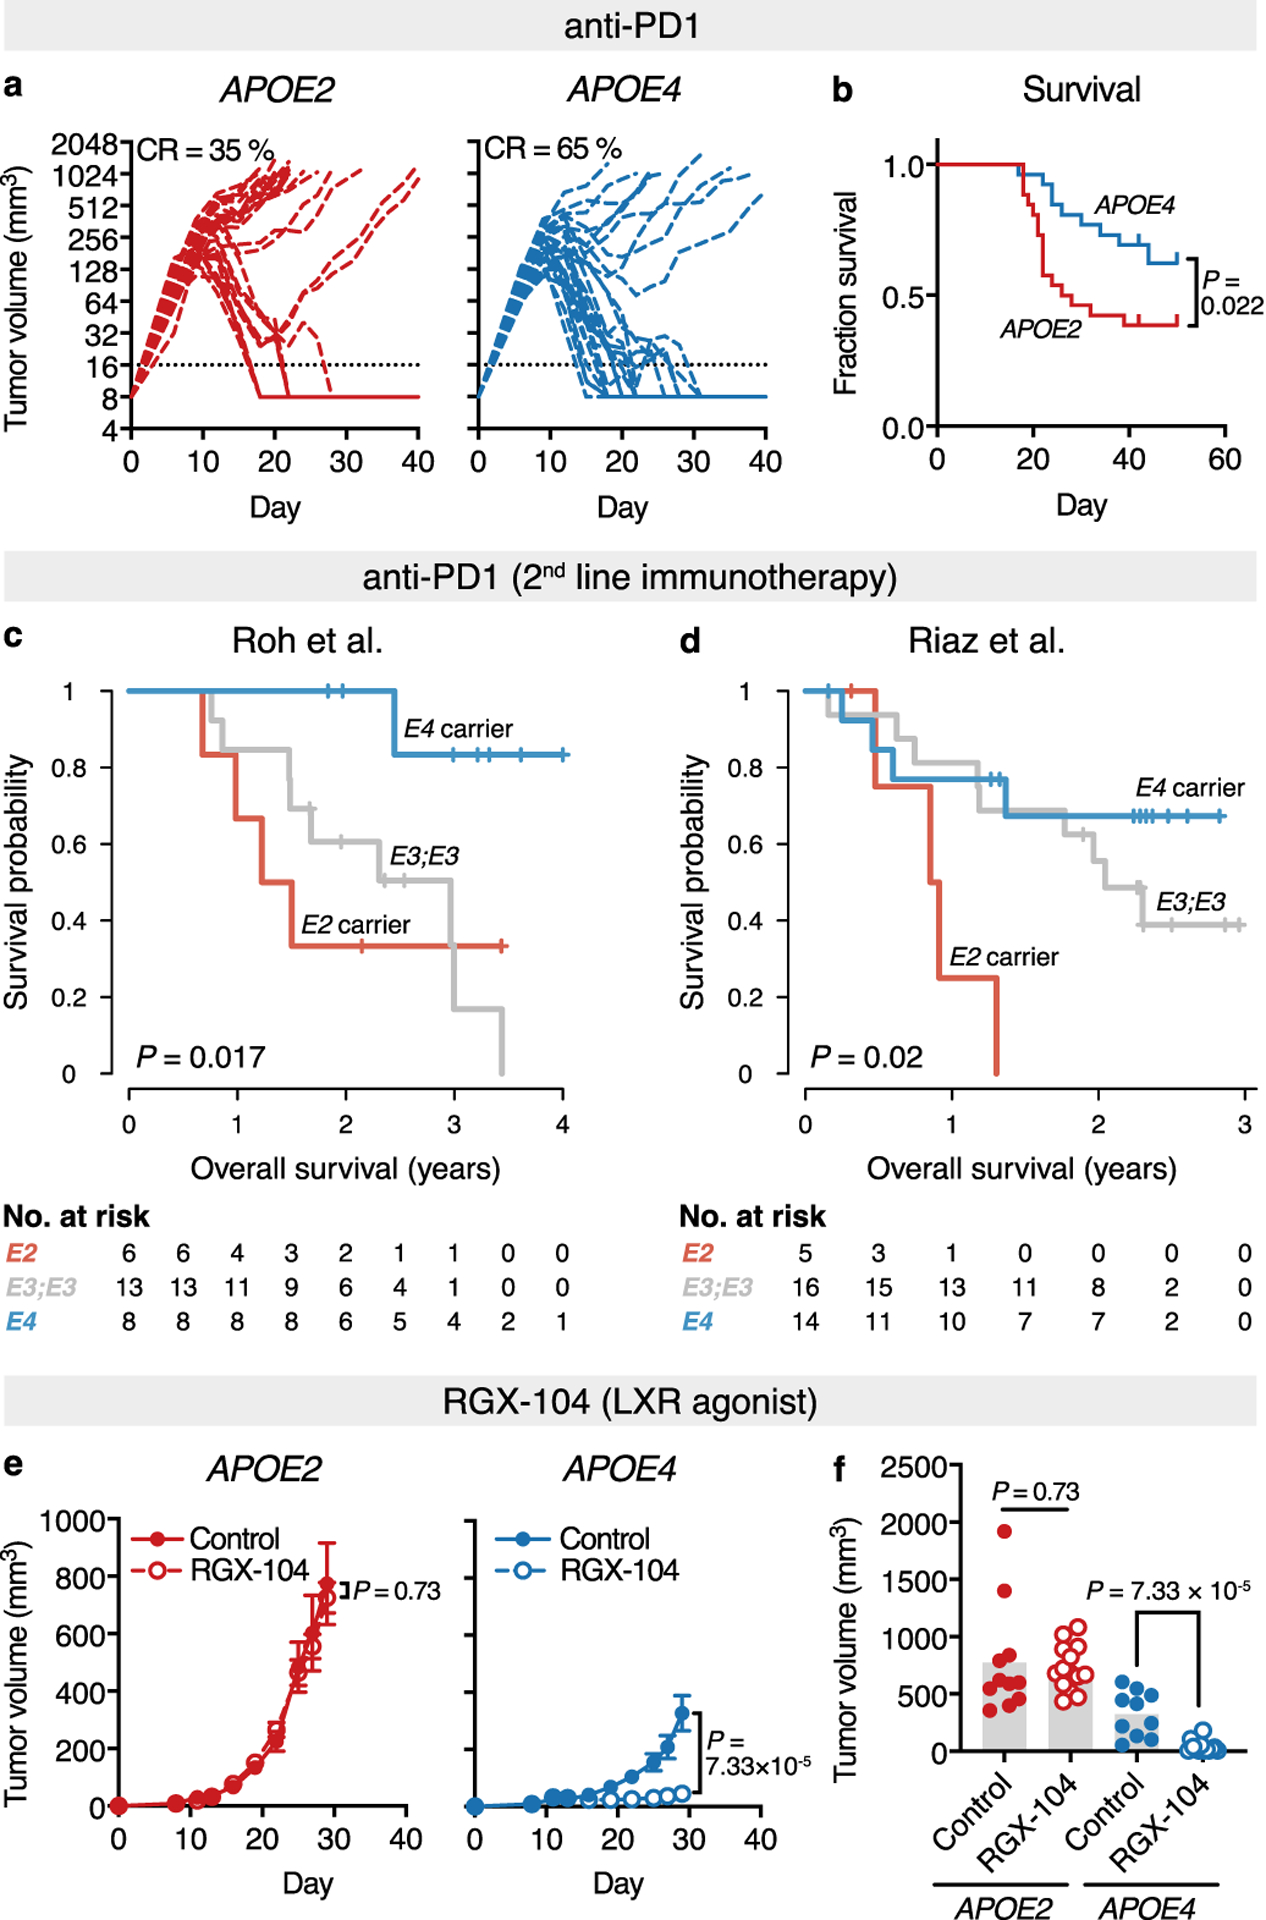
a-b, Tumor growth (a) and survival (b) of human APOE knock-in mice injected with YUMMER1.7 tumors and treated with anti-PD1 antibody (n = 26 per group; P = 0.022, two-tailed log-rank test; data pooled from two independent experiments; CR = complete remission). c-d, Survival of melanoma patients treated with anti-PD1 immunotherapy after failing anti-CTLA4 treatment in the Roh et al. (c) and Riaz et al. (d) studies stratified by APOE carrier status (P values according to two-sided log-rank tests). e, Effect of LXR-agonistic treatment on growth of YUMM1.7 tumors in human APOE knock-in mice (n = 11, 14, 10, and 13 for APOE2/ctrl, APOE2/RGX-104, APOE4/ctrl, and APOE4/RGX-104 groups, respectively; graphs represent mean values ± s.e.m., two-tailed t-test; representative of two independent experiments). f, Individual tumor volume on day 29 post injection from (e).
Finally, we reasoned that pharmacologic activation of APOE may augment the differential impact of APOE variants on melanoma progression. Liver-X-receptors (LXR) are nuclear hormone receptors that transcriptionally activate a number of genes implicated in cholesterol and lipid metabolism, including APOE32,33. LXR agonism has been shown to enhance anti-tumor immunity—an effect primarily mediated by APOE4,13. Indeed, the efficacy of LXR agonism was completely abrogated in APOE2 mice, while APOE4 mice benefitted from robust anti-tumor effects of treatment, augmenting the differences in tumor progression between APOE2 and APOE4 mice (Fig. 4e–f). Thus, distinct APOE genotypes elicited differential responsiveness to LXR agonistic therapy and may serve as potential genetic biomarkers for current clinical efforts investigating the use of LXR agonism in cancer therapy4.
APOE variants modulate multiple inflammation-associated pathologies. Our work provides causal evidence that, in a reversal of their role in neurodegenerative diseases, the highly prevalent APOE4 and APOE2 variants confer favorable and poor outcomes in melanoma, respectively, by impacting anti-tumor immunity. Previous reports have revealed differential activation of APOE receptors by APOE variants, potentially explaining the differential biological impact of these variants7–9. APOE2 has been shown to exhibit reduced binding to APOE receptors7,8. In contrast, APOE4 has been observed to exhibit enhanced receptor binding and/or signaling9,34. Our findings in this report are consistent with these past biochemical observations of enhanced (APOE4) and reduced (APOE2) APOE function in cancer, given the previously described roles of APOE in suppressing innate immune suppression, invasiveness, and endothelial recruitment4,12. Of note, despite the multitude of potential mechanisms that have been invoked to explain the impact of APOE variants on Alzheimer’s disease risk, a unifying explanation remains elusive, likely stemming from APOE’s pleiotropic organismal effects. In analogy, future studies will need to explore whether additional mechanisms account for the impact of APOE genotype on melanoma progression.
Our findings have several potential clinical implications. Most importantly, they suggest that common germline variants may serve as biomarkers to identify melanoma patients at high risk for relapse and melanoma-associated death for treatment with adjuvant systemic therapy. Importantly, these clinical association findings will need to be assessed in prospective studies. It will be important to also assess the impact of APOE genotype on the outcome of additional cancer types. More generally, our findings support the notion that hereditary germline variants in the same gene can positively or negatively impact future progression and survival outcomes and responsiveness to therapy in a common human malignancy.
Methods
Animal studies
All animal experiments were conducted in accordance with a protocol approved by the Institutional Animal Care and Use Committee at The Rockefeller University. Human APOE2 (strain #1547), APOE3 (#1548), and APOE4 (#1549) targeted replacement (knock-in) mice were obtained from Taconic Biosciences. C57BL/6J mice (#000664) were obtained from The Jackson Laboratory.
Cell lines
YUMM1.7 cells, originally derived from a BrafV600E/+;Pten−/−;Cdkn2a−/− mouse melanoma, and their more immunogenic derivative YUMMER1.7, were generously provided by Marcus Bosenberg17,35. Mouse B16F10 melanoma cells, YUMM3.3 melanoma cells (BrafV600E/+;Cdkn2a−/−) and human umbilical vein endothelial cells (HUVEC) were obtained from American Tissue Type Collection and cultured according to the supplier’s conditions. B16F10 cells transduced with a retroviral construct to express luciferase36 and shRNA targeting murine Apoe (shRNA clone TRCN0000011799; B16F10-TR-shApoe) were described previously13. MeWo melanoma cells were originally obtained from American Tissue Type Collection. The highly metastatic MeWo-LM2 subclone was described previously12. B16F10 and MeWo-LM2 cells were cultured in DMEM medium with Pyruvate and Glutamine (11995, Gibco) supplemented with 10 % FBS (F4135, Sigma), Penicillin-Streptomycin (15140, Gibco), and Amphotericin B (17–936E, Lonza). YUMM1.7, YUMM3.3 and YUMMER1.7 cells were cultured in DMEM/F-12 medium with L-Glutamine and 15mM HEPES (11330, Gibco) supplemented with 10 % FBS, Penicillin-Streptomycin, Amphotericin B, and 1 % non-essential amino acids (111400, Gibco). Contamination with mycoplasma was ruled out by PCR testing according to standard protocols37.
Tumor growth studies and treatments
To assess the impact of APOE genotype on the growth of syngeneic melanoma, we subcutaneously injected 1 × 10⁵ YUMM1.7 or YUMM3.3 cells into the flank of 6–10-weeks-old, sex-matched human APOE targeted replacement mice. Cells were injected in a total volume of 100 μL, and YUMM1.7 cells were mixed 1:1 with growth factor reduced Matrigel (356231, Corning) before injection. Tumor size was measured on the indicated days using digital calipers and tumor volume was calculated as (small diameter)2 × (large diameter) × Π / 6. In experiments employing YUMMER1.7 cells, 5 × 10⁵ cells resuspended in PBS were injected subcutaneously into the flank. The sex of the mice for experiments with YUMM1.7, YUMM3.3 and B16F10 cells was matched to the sex of the tumor cell line (males for YUMM1.7 and B16F10, females for YUMM3.3). YUMMER1.7 cells were injected into female mice.
To deplete T cells in-vivo, 400 μg each of anti-CD4 (BioXCell, clone GK1.5) and anti-CD8 (BioXCell, clone 53–6.7) antibodies were injected intraperitoneally on days 7, 14, and 21 post-tumor cell injection. Control mice received PBS injections on the same days. Efficient depletion was verified by flow cytometry on day 27 post-tumor injection. For LXR-agonistic treatment, mice were administered chow supplemented with the synthetic LXR-agonist RGX-104 (Rgenix4) at 628.5 mg/kg (Research Diets, approximate target dose of 100 mg/kg body weight) starting on day 3 post-injection. For anti-PD1 treatment, mice were injected intraperitoneally with 250 μg and 125 μg of anti PD-1 antibody (BioXCell, clone RMP1–14) on days 6 and 9 post-tumor cell injection, respectively. Control mice received PBS injections on the same days. For survival analysis in the YUMMER1.7 model, mice were euthanized when the tumor volume exceeded 1000 mm3. Therapy responses were considered complete (CR, complete response) when tumor volumes fell below 16 mm3 (lowest limit of detection).
Tail-vein metastasis assays
For tail-vein assays, B16F10-shApoe cells stably expressing a retroviral construct encoding luciferase were used in order to assess cancer progression by bioluminescence imaging as described previously13. Since our previous work demonstrated that tumor-derived APOE significantly modulates progression in the metastatic but not the primary tumor site12,13, we silenced tumoral Apoe-expression in B16F10 cells employed in tail-vein assays using RNA-interference. To assess whether APOE genotype impacts metastatic progression, 1 × 10⁵ cells were resuspended in 100 μL of PBS and injected into the tail vein of 6–8-weeks-old male human APOE knock-in mice. Bioluminescence imaging was performed approximately twice a week and the signal was normalized to the signal obtained on day 0.
Mouse genotyping
Genotyping to distinguish between mouse and human APOE was performed using standard PCR with independent reactions for mouse and human APOE (PCR product lengths of 200 bp and approximately 600 bp, respectively). In order to distinguish between human APOE alleles, we used PCR-based restriction fragment length polymorphism genotyping38. In brief, a 244 bp fragment of APOE was amplified using standard PCR and digested with HhaI (R0139S, New England Biolabs), and allele-specific products were resolved on a 15% polyacrylamide gel. The following primers were used for the indicated PCR reactions:
Mouse versus human knock-in APOE mice
Common forward: 5’ – TAC CGG CTC AAC TAG GAA CCA T – 3’
Mouse Apoe reverse: 5’ – TTT AAT CGT CCT CCA TCC CTG C – 3’
Human APOE reverse: 5’ – GTT CCA TCT CAG TCC CAG TCTC – 3’
Human APOE allele restriction length polymorphism
Human APOE forward: 5’ – ACA GAA TTC GCC CCG GCC TGG TAC AC – 3’
Human APOE reverse: 5’ – TAA GCT TGG CAC GGC TGT CCA AGG A – 3’
Hematopoietic stem cell transplantation
Six to 7-weeks-old C57BL/6J mice were whole-body irradiated with 10.5 Gray (two doses of 525 rad each 3.5 hours apart). Six hours after the last dose of irradiation, 2–3 × 10⁶ nucleated bone marrow cells isolated from 6–8-weeks old APOE knock-in mice (n = 5 per group) were infused into recipient mice by retroorbital injection. Bone marrow chimeras were reconstituted for 8 weeks before experimental use.
Quantitative real-time PCR
Total RNA from cells cultured in triplicates was isolated with the Total RNA Purification Kit (17200, Norgen Biotek). The SuperScript III First-Strand Synthesis System (18080051, ThermoFisher) was used to reverse-transcribe 1 μg of total RNA into cDNA according to the manufacturer’s instructions using oligo(dT) primers. Subsequently, quantitative real-time PCR was performed using Fast SYBR Green Master Mix (Applied Biosystems) and an Applied Biosystems 7900HT system. Expression of Apoe was normalized to Gapdh expression for each sample. Primer sequences were as follows:
Apoe forward: 5’-- CTG ACA GGA TGC CTA GCC G -- 3’
Apoe reverse: 5’ -- CGC AGG TAA TCC CAG AAG C -- 3’
Gapdh forward: 5’ -- GCA CAG TCA AGG CCG AGA AT-- 3’
Gapdh reverse: 5’ -- GCC TTC TCC ATG GTG GTG AA-- 3’
Isolation of tumor-infiltrating leukocytes
To isolate tumor-infiltrating leukocytes, YUMM1.7 tumors were resected on day 21 after injection and thoroughly minced on ice using scalpels. Tumor pieces were incubated in HBSS2+ (HBSS with Calcium and Magnesium (24020, Gibco) supplemented with 2% FBS, 1 mM sodium pyruvate (11360, Gibco), 25 mM HEPES (15630, Gibco), 500 U/mL Collagenase IV (LS004188, Worthington), 100 U/mL Collagenase I (LS004196, Worthington), and 0.2 mg/mL DNAse I (10104159001, Roche)) for 30 minutes at 37°C on an orbital shaker (80 rpm). After thorough trituration, the mixture was passed through a 70 μm strainer and diluted with HBSS2- (HBSS without Calcium and Magnesium (14170, Gibco), 2% FBS, 1 mM sodium pyruvate, and 25 mM HEPES). After centrifugation, the cell pellet was resuspended in a 35 % Percoll solution (170891, GE Healthcare) and a phase of 70 % Percoll was underlaid using a glass Pasteur pipette. The resulting gradient was centrifuged at 800 × g for 20 minutes at room temperature without brakes. After removal of the red blood cell-containing pellet on the bottom and excess buffer containing cellular debris on the top, the cell population at the Percoll interphase enriched for tumor-infiltrating leukocytes was washed twice with HBSS2-.
Flow cytometry
Unless otherwise mentioned, all steps were performed on ice and under protection from light. Fc receptors were blocked by incubation with 2.5 μg/mL anti-CD16/32 antibody (clone 93; 101320, BioLegend) in staining buffer (25 mM HEPES, 2 % FBS, 10 mM EDTA (351–027, Quality Biological), and 0.1 % sodium azide (7144.8–16, Ricca) in PBS) for 10 minutes. Cells were incubated with antibodies diluted in staining buffer for 20 minutes, washed with PBS, incubated with Zombie NIR Fixable Live/Dead Stain (423105, BioLegend) for 20 minutes at room temperature, and washed twice with staining buffer. Cells were analyzed on an LSR Fortessa (BD Biosciences). For cell quantification, CountBright counting beads (C36950, Thermo Fisher) were added to the samples before analysis. For compensation, single color controls with UltraComp beads (01-2222-42, ThermoFisher) for antibodies and amine-reactive beads (A10628, ThermoFisher) for Zombie live-dead stain were used.
For intracellular staining of cytokines, cells were incubated with 500 ng/mL ionomycin (I0634, Sigma), 100 ng/mL Phorbol 12-myristate 13-acetate (P8139, Sigma), and 10 μg/mL Brefeldin A (B7651, Sigma) for 3–4 hours at 37°C prior to surface labelling and live/dead staining as described above. Cells were then incubated in fixation/permeabilization buffer (00–5523, eBioscience) for 30 minutes, washed with permeabilization buffer (00–5523, eBioscience), and incubated with antibodies diluted in permeabilization buffer for 20 minutes. Finally, cells were washed with permeabilization buffer and subsequently with staining buffer.
Single cell RNA-sequencing of tumor-infiltrating leukocytes
Human APOE knock-in mice (n = 6 per group) were subcutaneously injected with 1 × 10⁵ YUMM1.7 cells on the flank (mixed 1:1 with growth factor reduced Matrigel (356231, Corning)). Tumors were resected on day 19 after injection and tumor-infiltrating leukocytes were isolated as outlined above. Fc receptors were blocked with anti-CD16/32 antibody (clone 93; 101320 BioLegend) and cells were stained with an anti-CD45 antibody and DAPI in flow cytometry buffer without sodium azide. Subsequently, 10,000 CD45+/DAPI- leukocytes from each mouse were independently sorted on a BD FACSAria II cell sorter and samples from the same genotype were pooled (i.e., total of 60,000 cells per genotype). Five-thousand cells per genotype were targeted for single-cell RNA-sequencing (scRNAseq) on a Chromium Single Cell System (10x Genomics). Samples were processed as per the manufacturer’s instructions (Chromium single cell 3’ reagents, v3 chemistry) and libraries were sequenced on an Illumina NextSeq sequencer.
Pre-processing of sequencing results to generate transcript matrices was performed using the 10x genomics Cell Ranger pipeline with default settings (v3.0.1). Further downstream analysis was performed in R using the Seurat package v3.0.2. Cells were excluded if fewer than 200 or more than 6000 genes were detected, or if mitochondrial transcripts accounted for more than 10% of reads; genes were excluded if they were detected in fewer than five cells. The two datasets were integrated using Seurat’s default settings, resulting in an expression matrix of 10,050 cells by 15,495 genes. Data were scaled and principal component analysis performed using Seurat’s default settings. Cells were clustered using the FindNeighbors (20 dimensions of reduction) and FindClusters functions at default settings; uniform manifold approximation and projection (UMAP) was calculated for visualizing clusters. Differential gene expression analysis between each cluster was performed using a Wilcoxon rank sum test. The identity of cell clusters was determined by cross-referencing top differentially expressed transcripts with the immunological genome project39 (Extended Data Fig. 3a). The identity of one cell cluster remained ambiguous, and further sub-clustering revealed the presence of a mixed population (data not shown), prompting us to label this cluster as “diverse”.
For gene set enrichment analysis (GSEA), differential expression of genes between APOE4 and APOE2 for each cluster was calculated using a Wilcoxon rank sum test and genes were ranked using the metric [-log10(p-value)]/[sign of log-fold change]. The ranked gene list was used for calculating GSEA using the clusterProfiler package with the Hallmark gene sets in the MSigDB database40,41. For visualization, the number of clusters with significant enrichment were plotted for pathways that were significant in more than three clusters. For lineage summarization, all macrophage, monocyte, MDSC, basophil, and mast cell clusters were grouped as “myeloid”, T cell, B cell, and NK clusters as “lymphoid”, all DC clusters as “DCs”, and the remaining clusters as “other”.
Antibodies
The following anti-mouse fluorophore-conjugated antibodies were used for flow cytometry: CD45-BV785 (clone: 30-F11, cat#: 103149, supplier: BioLegend, dilution: 1:3,000), B220-BUV395 (RA3–6B2, 563793, BD Biosciences, 1:400), CD11b-BV605 (M1/70, 101257, BioLegend, 1:6,000), CD11b-FITC (M1/70, 101206, BioLegend, 1:4,000), Ly6G-PerCP/Cy5.5 (1A8, 127616, Biolegend, 1:500), Ly6C-BV711 (HK1.4, 128037, BioLegend, 1:12,000), I-A/I-E-BV421 (M5/114.15.2, 107632, BioLegend, 1:9,000), F4/80-FITC (BM8, 123108, BioLegend, 1:500), CD24-PE (M1/69, 101808, BioLegend, 1:5,000), CD103-APC (2E7, 121414, BioLegend, 1:500), CD19-FITC (1D3/CD19, 152404, BioLegend, 1:1,500), TCRβ-PerCP/Cy5.5 (H57–597, 109228, BioLegend, 1:200), CD49b-APC (HMa2, 103516, BioLegend, 1:300), CD4-BV605 (GK1.5, 100451, BioLegend, 1:200), CD8α-AF700 (53–6.7, 100730, BioLegend, 1:1,000), Granzyme B-PE (QA16A02, 372208, BioLegend, 1:200), IFNγ-PE/Cy7 (XMG1.2, 25-7311-82, eBioscience, 1:500).
Immunofluorescence microscopy
YUMM1.7 tumors were excised and fixed in 4% paraformaldehyde at 4°C for 24 hours. Fixed tumors were embedded in paraffin and sectioned in 5 μm thick slices. Sections were dewaxed and rehydrated by incubation with xylene and descending ethanol concentrations. Antigen retrieval was performed by microwaving samples in citrate buffer (C9999, Sigma) for 30 minutes. Samples were blocked by incubation with 5 % goat serum in PBST (PBS with 0.1 % Tween-20) for one hour. Subsequently, the sections were stained with anti-Endomucin (clone V.7C7, Santa Cruz; 1:200 in PBST with 5 % goat serum) or anti-CD8 antibody (rabbit polyclonal, Synaptic Systems, 1:200 in PBST with 5% goat serum) at 4°C overnight. Slides were washed three times with PBS and stained with AF555-conjugated anti-rat or AF488-conjugated anti-rabbit antibody (1:200 in PBST, ThermoFisher Scientific) for 45 minutes. Slides were washed with PBS and nuclei were counterstained with DAPI (2.5 μg/ml, Roche) before mounting with Prolong Gold (ThermoFisher Scientific). Images of tumor sections were acquired using an RS-G4 confocal microscope (Caliber I.D.). Images were quantified using CellProfiler (v3.1.8). Four sections per tumor were analyzed and averaged. Samples without addition of primary antibody served as negative controls.
Matrigel invasion assay
The assay was performed similarly to as described previously12. B16F10-TR-shApoe mouse melanoma cells were serum starved overnight in DMEM supplemented with 0.2 % FBS. Prior to starting the assay, four Matrigel invasion chambers per condition (Corning, 354480) were equilibrated at 37°C with 500 μL of 0.2% FBS DMEM in the top and bottom chambers. After 30 minutes, the starvation media in the top chamber was removed and replaced with 500 μL of starvation media containing 1 × 10⁵ melanoma cells and either 10 μg/mL of recombinant APOE2 or APOE4 (Tonbo Biosciences 21–9195 and 21–9190), or an equimolar concentration of BSA (20 μg/mL; Sigma A3059). Chambers were then kept at 37°C for 24 hours to allow for invasion. Subsequently, the chambers were washed with 1× PBS, the tops were scraped with cotton swabs to remove residual non-invading cells, and the inserts were fixed in 4% paraformaldehyde for 20 minutes. After washing again with PBS, inserts were stained with DAPI (Roche, 10236276001) for 5 minutes, cut out, and then mounted bottom-up on slides with ProLong Gold Antifade Mountant (Invitrogen, P36930). Four representative images per insert were taken using a Zeiss Axiovert 40 CFL fluorescence microscope at 10 × magnification, and the number of invaded cells was quantified.
Endothelial recruitment assay
Human umbilical endothelial vein cells (HUVEC) were serum-starved overnight in EGM-2 media (Lonza, CC-3162) containing 0.2% FBS. Concurrently, 5 × 10⁴ highly metastatic MeWo-LM2 human melanoma cells were plated in a 24-well plate in DMEM supplemented with 10% FBS. On the day of the assay, the medium was replaced with EGM-2 starvation medium, and Mewo-LM2 cells were allowed to enrich the media for 6–8 hours at 37°C. Subsequently, BSA (20 ug/mL; Sigma, A3059), APOE2, or APOE4 (10ug/ml; Tonbo Biosciences 21–9195 and 21–9190) were added to the media, and 3.0 μm PET membrane inserts (Falcon, 353492) were placed in the wells. HUVEC cells were trypsinized, resuspended, and seeded equally into the top chambers. The cells were allowed to migrate for 16 to 18 hours, after which the inserts were mounted and analyzed as described for the invasion assay above.
Analysis of APOE genotype in the TCGA-SKCM study
To assess APOE genotypes in melanoma patients from the TCGA-SKCM study, we downloaded aligned whole exome sequencing BAM files sliced for the genomic coordinates chr19:44904748–44910394 (GRCh38) from the TCGA-SKCM project using the Genomic Data Commons API22. We called APOE variants using the samtools/bcftools package, providing allele frequencies for chr19:44908684 (rs429358) and chr19:44908822 (rs7412) as determined in the Atherosclerosis Risk in Communities (ARIC) study23 as a prior distribution. Normal tissue samples (either blood, solid tissue, or buccal cells) were available for 470 patients. No genotype could be determined in 10 patients. Additionally, patients that exhibited the APOE2;APOE4 genotype (n = 5) were excluded from analyses except for genotype frequency assessment. APOE genotype abundance in the normal population was based on the assessment of Caucasian patients in the ARIC study.
Clinical data including survival times and clinical response were used as recently curated25. The R package ‘TCGAbiolinks’ was used to add clinical data for Breslow depth and Clark level. To assess the impact of APOE genotypes on survival, Kaplan-Meier survival analyses were performed, and statistical significance was assessed with the log-rank test using the ‘survival’ and ‘survminer’ packages. Hazard ratios were calculated according to a Cox proportional hazards regression model using the ‘survival’ R package. For multivariable analysis, variables found to be significantly associated with survival in univariate analysis were tested for significance in a multivariable Cox proportional hazard model. For visualization purposes, survival data were truncated at 12 years. Given the sample sizes in the TCGA dataset, our analyses had greater than 80% power to detect a hazard ratio (HR) of approximately 1.4 or larger, assuming a type I error of 5%. All analyses were performed using R v3.5 (The R Foundation for Statistical Computing) and RStudio v1.1.3.
Analysis of APOE genotype in the MDACC melanoma study
GWAS genotyping results of the MDACC melanoma study26 were downloaded from dbGap, and the APOE variant-defining SNPs rs429358 and rs7412 were selected using Plink. Genotyping data were filtered to exclude variants with minor allele frequency < 1 %, genotyping rate < 95 %, and departure from the Hardy-Weinberg equilibrium at P < 1E-06. Samples were excluded if the missing genotype call rate exceeded 5 %. Genomic coordinates were lifted from genome assembly hg18 to hg19 using the UCSC liftOverPlink utility, and strands were aligned using GenotypeHarmonizer and the 1000 genomes reference genome. Since no individual was found to exhibit the minor allele at rs429358, inadequate genotyping at this locus was assumed as described by others42, prompting us to impute the genotype at this locus based on a previously validated approach42 prior to performing survival analysis (Extended Data Fig. 9a–b). Pre-phasing was performed using ShapeIt v2, and variants in the genomic region 19:45411941–45422946 were imputed using Impute2 with parameters as suggested specifically for APOE imputation (-NE 20000 -iter 100 -call_thresh 0.8 -align_by_maf_g)42. Subsequent analysis of the association between clinical variables and APOE genotype was performed as described for the TCGA-SKCM study above.
Analysis of APOE genotype in the anti-PD1 melanoma studies by Riaz et al. and Roh et al.
Analyses of the Roh et al.30 and Riaz et al.31 studies were performed as described for the TCGA-SKCM study. In brief, normal tissue whole-exome sequencing data were downloaded from dbGaP (BioProject IDs PRJNA369259 and PRJNA359359) and APOE genotype was called as detailed above. No genotype could be determined for one patient in the Roh et al. study. For the Roh et al. study, only patients that received both anti-CTLA4 and anti-PD1 treatment were considered. In the Riaz et al. study, patients were stratified by prior CTLA4 treatment status. Kaplan-Meier survival analyses were performed using the ‘survival’ and ‘survminer’ packages, as detailed above.
Statistical analysis
Unless otherwise noted, all data are expressed as mean ± standard error of the mean. Groups were compared using tests for significance as indicated in the figure legends and the text. A significant difference was concluded at P < 0.05.
Reporting summary
Further information on research design is available in the Nature Research Life Sciences Reporting Summary linked to this article.
Extended Data
Extended Data Fig. 1. Human APOE variants modulate metastatic progression of murine melanoma.
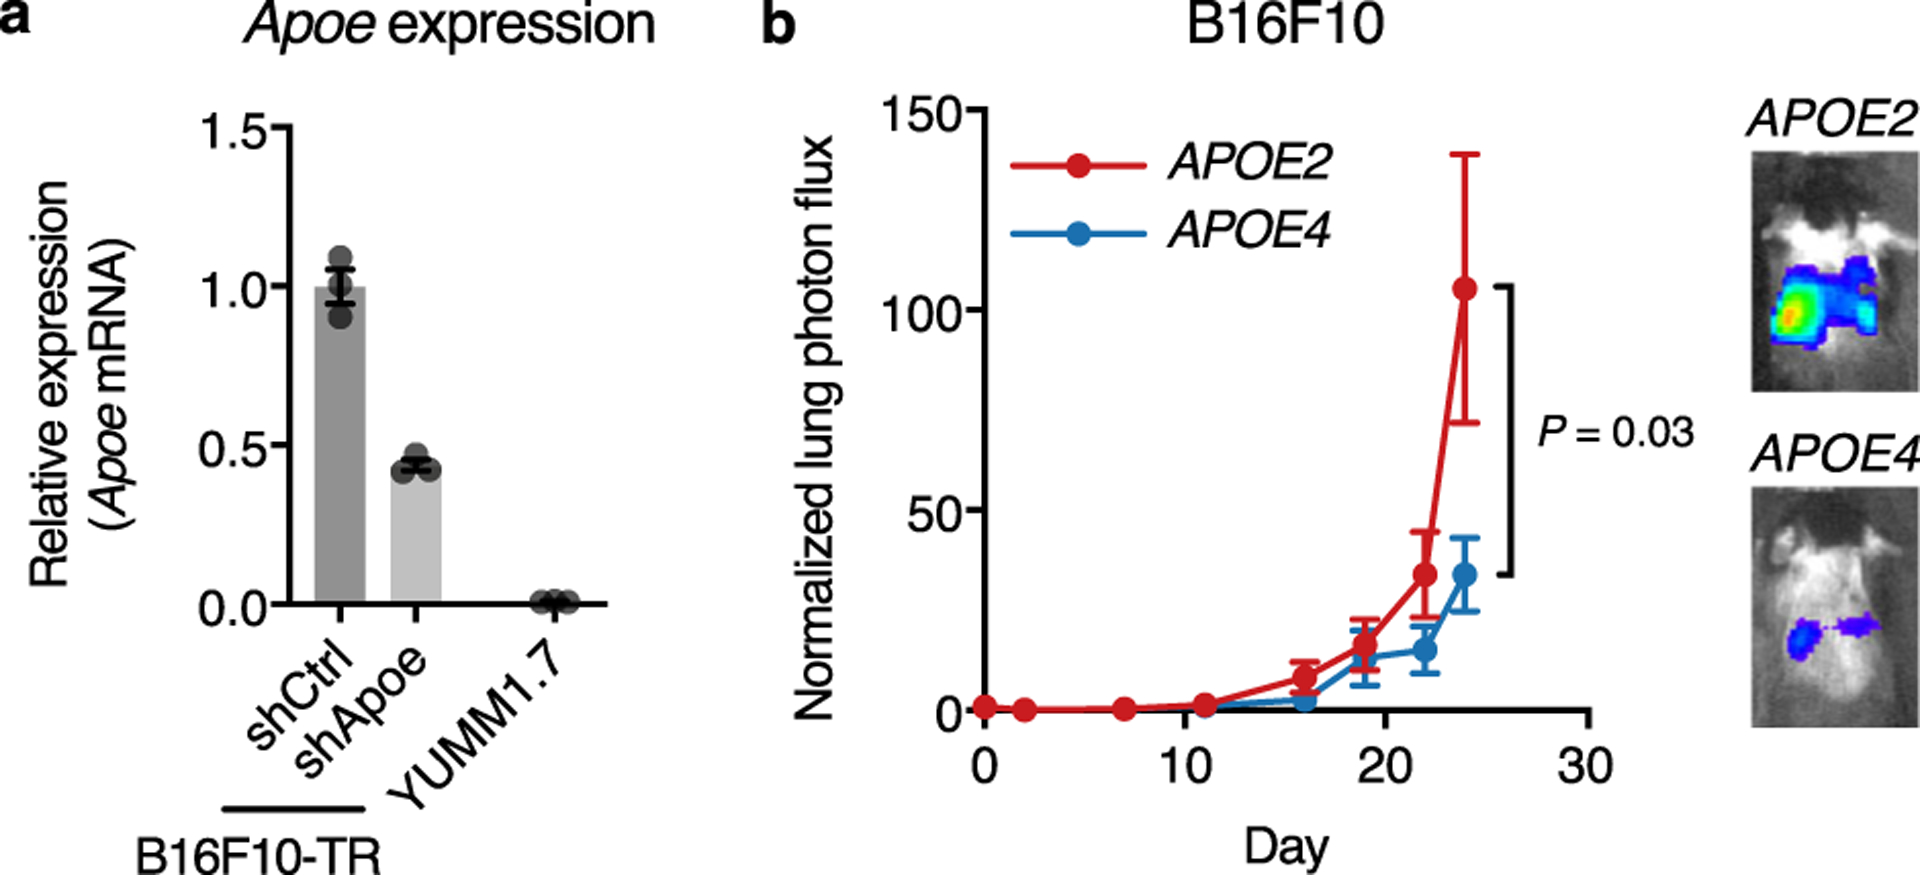
a, Relative expression of murine Apoe determined by qRT-PCR in B16F10 cells expressing shCtrl and shApoe hairpins and in YUMM1.7 cells (n = 3 cell culture replicates per group, graph represents mean values ± s.e.m.). b, Bioluminescence imaging of metastatic progression of murine melanoma B16F10-TR-shApoe cells intravenously injected into APOE knock-in mice (n = 10 mice per group; one-tailed Mann-Whitney test; graph represents mean values ± s.e.m.; representative of two independent experiments). Images correspond to representative mice on day 24 after injection.
Extended Data Fig. 2. Immunoprofiling of the tumor microenvironment in APOE2 versus APOE4 mice.
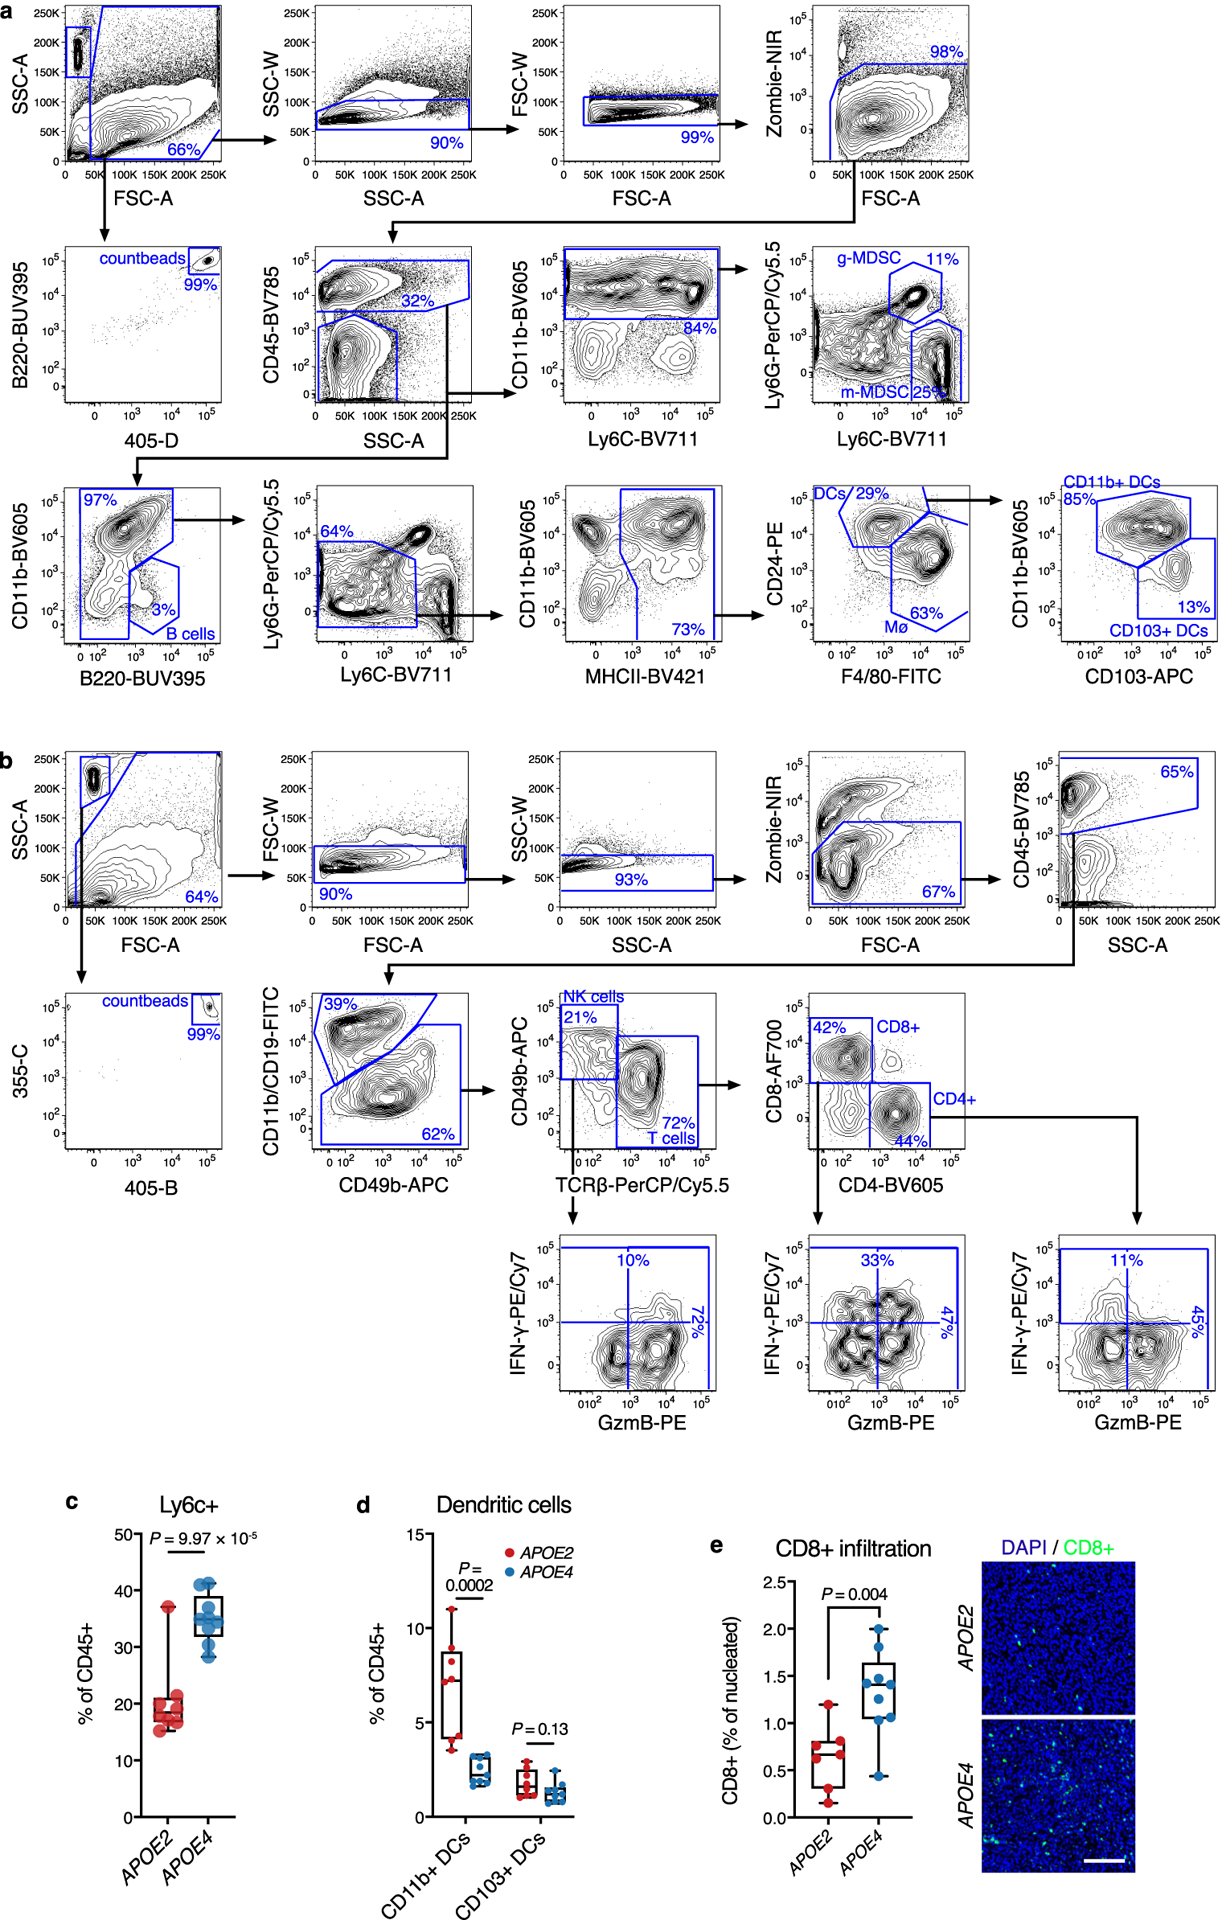
a-b, Representative flow cytometry plots from two independent experiments demonstrating the gating strategy to identify major myeloid (a) and lymphoid (b) cell subsets in the tumor microenvironment. c-d, Proportion of monocytic Ly6C+ (c) and dendritic cell (d) subsets in the immune microenvironment of YUMM1.7 tumors in APOE2 and APOE4 mice (n = 8 and 9 mice for APOE2 and APOE4, respectively; representative of two independent experiments). e, Intratumoral CD8+ T cell infiltration in YUMM1.7 tumors from APOE2 and APOE4 mice (n = 7 and 9 mice for APOE2 and APOE4 groups, respectively). Images show representative sections (scale bar = 100 μm). All P values are based on two-tailed t-tests. Box plots show median, first and third quartiles, and whiskers represent minimum and maximum values.
Extended Data Fig. 3. Extended single cell RNA-sequencing data.
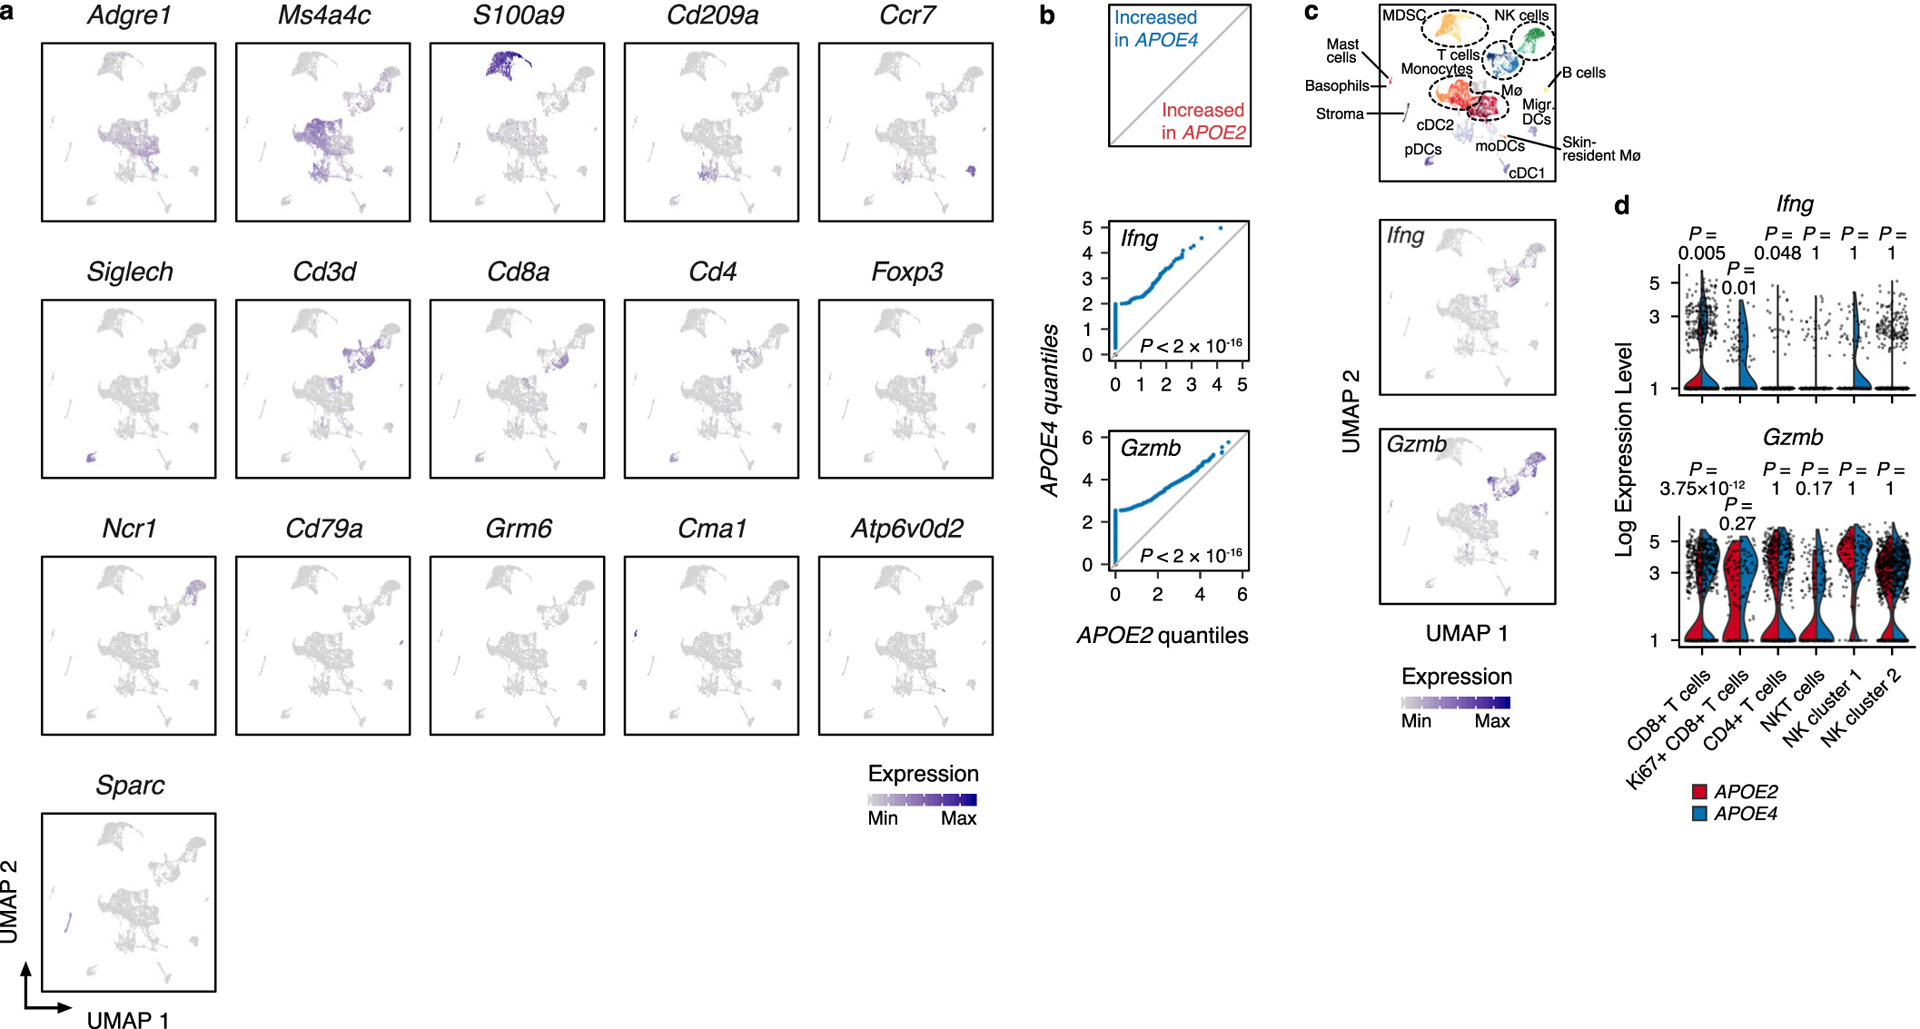
a, Uniform manifold approximation and projection (UMAP) plots illustrating the distribution of the expression of manually curated, lineage-defining genes. b, Paired quantile-quantile plots for the expression of Ifng and Gzmb in CD45+ cells infiltrating tumors in APOE2 and APOE4 mice (P values according to two-sided Wilcoxon rank-sum test). c, Uniform manifold approximation and projection (UMAP) plots illustrating the distribution of Ifng and Gzmb expression across immune cell clusters. d, Violin plots showing the distribution of Ifng and Gzmb expression across T and NK cell subsets from (b-c) (P values according to two-sided Wilcoxon rank-sum test adjusted for total number of clusters by FDR; plots extend from minimum to maximum values). A total of 10,050 cells were sequenced (n = 4,665 and 5,385 cells for APOE2 and APOE4 groups, respectively). Cells were harvested from n = 6 biologically averaged mice for each group. For single-cell RNA-sequencing, a total of 10,050 cells were sequenced (n = 4,665 and 5,385 cells for APOE2 and APOE4 groups, respectively).
Extended Data Fig. 4. Efficiency of in-vivo T cell depletion.
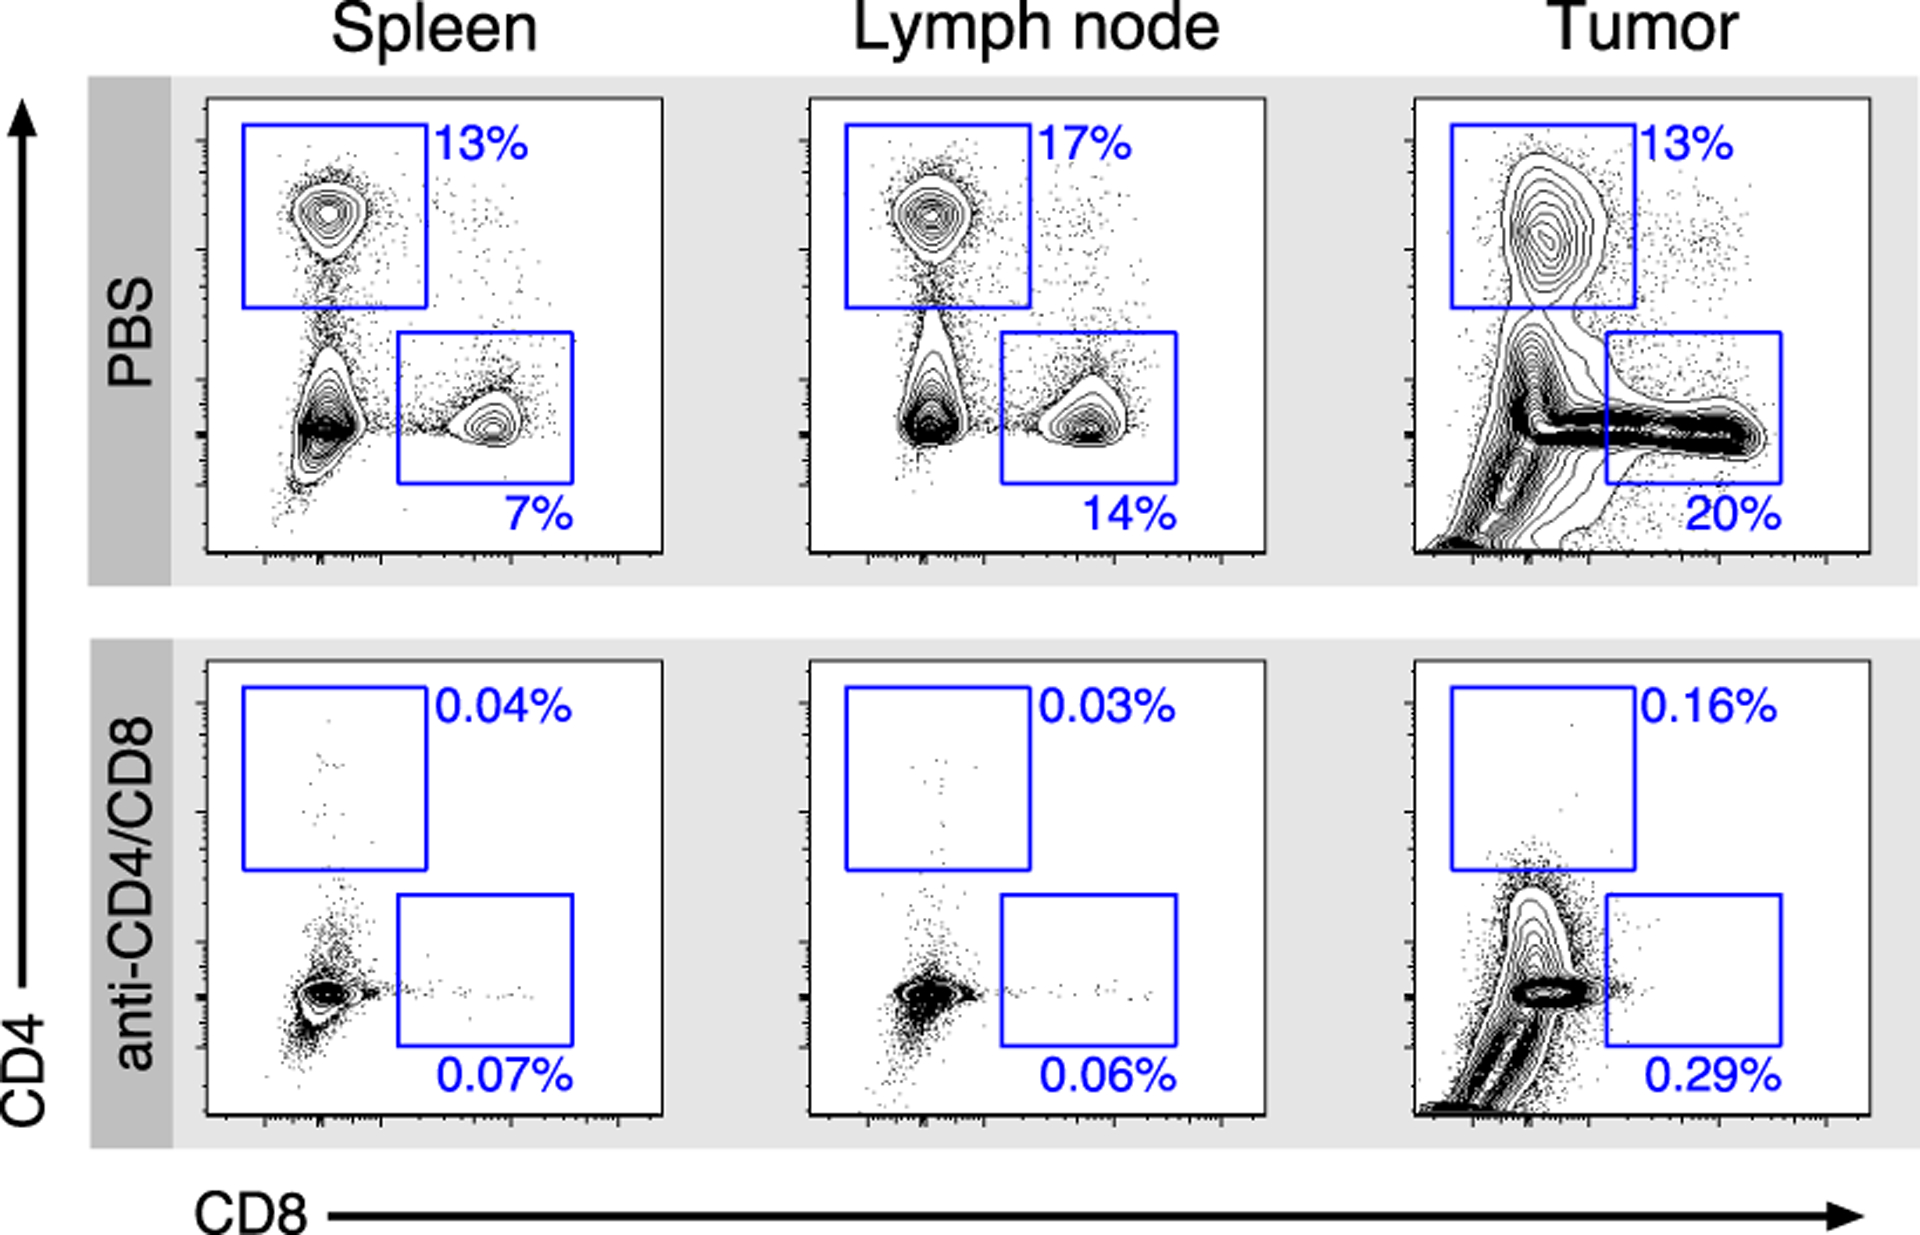
Representative flow cytometry plots of two independent experiments of samples from spleens, lymph nodes, and tumors of mice treated with PBS versus anti-CD4 and anti-CD8 antibodies.
Extended Data Fig. 5. APOE variants differentially impact cancer cell invasion and endothelial recruitment.

a, Matrigel invasion by 1 × 10⁵ mouse melanoma B16F10-TR-shApoe cells treated with the indicated recombinant proteins (n = 4 biologically independent samples; one tailed t-test). b, Trans-well recruitment of 1 × 10⁵ human umbilical vein endothelial cells treated with the indicated recombinant proteins by 5 × 10⁴ human melanoma MeWo-LM2 cells (n = 4 biologically independent samples; one tailed t-tests). Data in (a-b) are representative of three independent experiments. c, Blood vessel density in YUMM1.7 tumors from APOE2 and APOE4 mice (n = 8 and 9 mice for APOE2 and APOE4 groups, respectively; two-tailed Mann-Whitney test; box plots show median, first and third quartiles, and whiskers represent minimum and maximum values.). Images show representative sections (scale bar = 100 μm).
Extended Data Fig. 6. Distribution of APOE genotype in the TCGA-SKCM study.
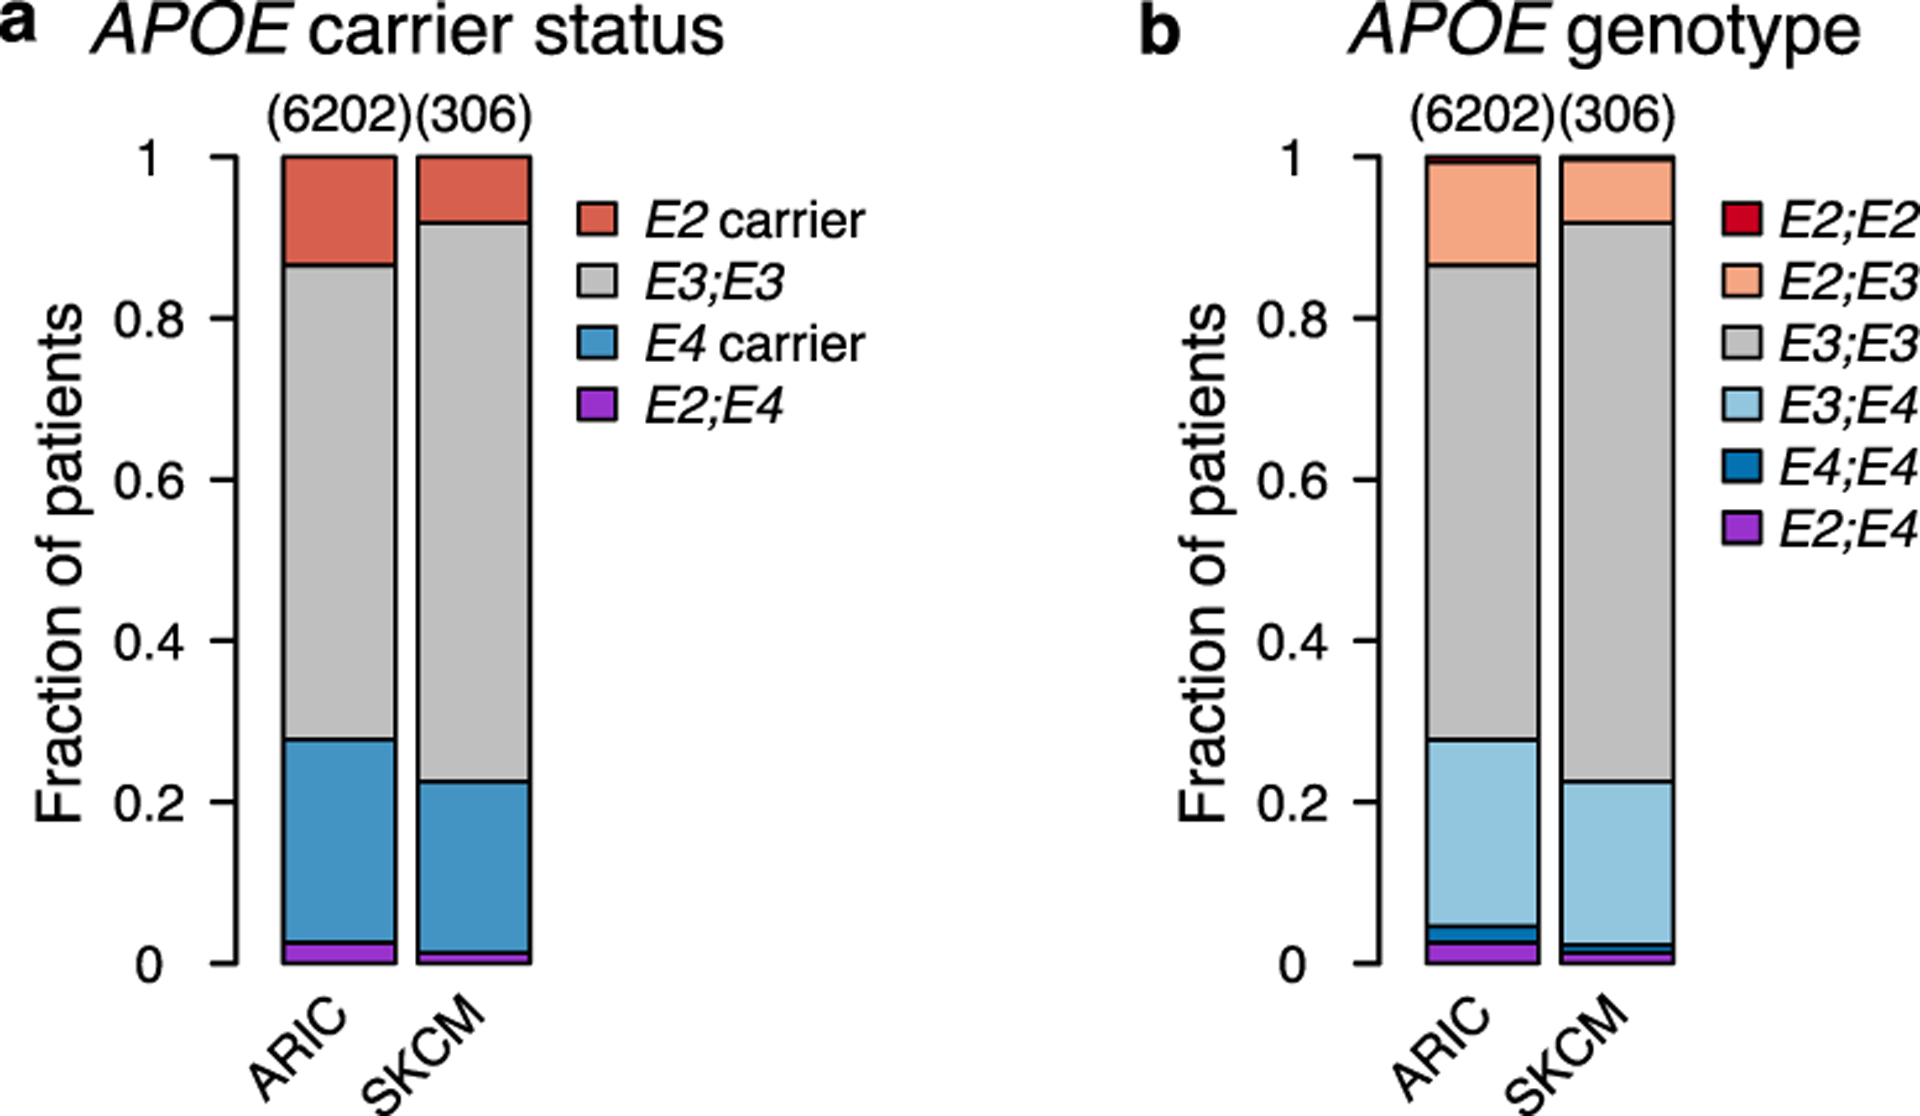
a-b, Proportion of APOE2 and APOE4 carrier status (a) and bi-allelic genotype (b) in the Atherosclerosis Risk in Communities study (ARIC) and in patients with stage II/III melanoma in the TCGA-SKCM study (P = 0.0017 and 0.0066, respectively; χ2 test).
Extended Data Fig. 7. Clinical characteristics of stage II/III patients in the TCGA-SKCM study.
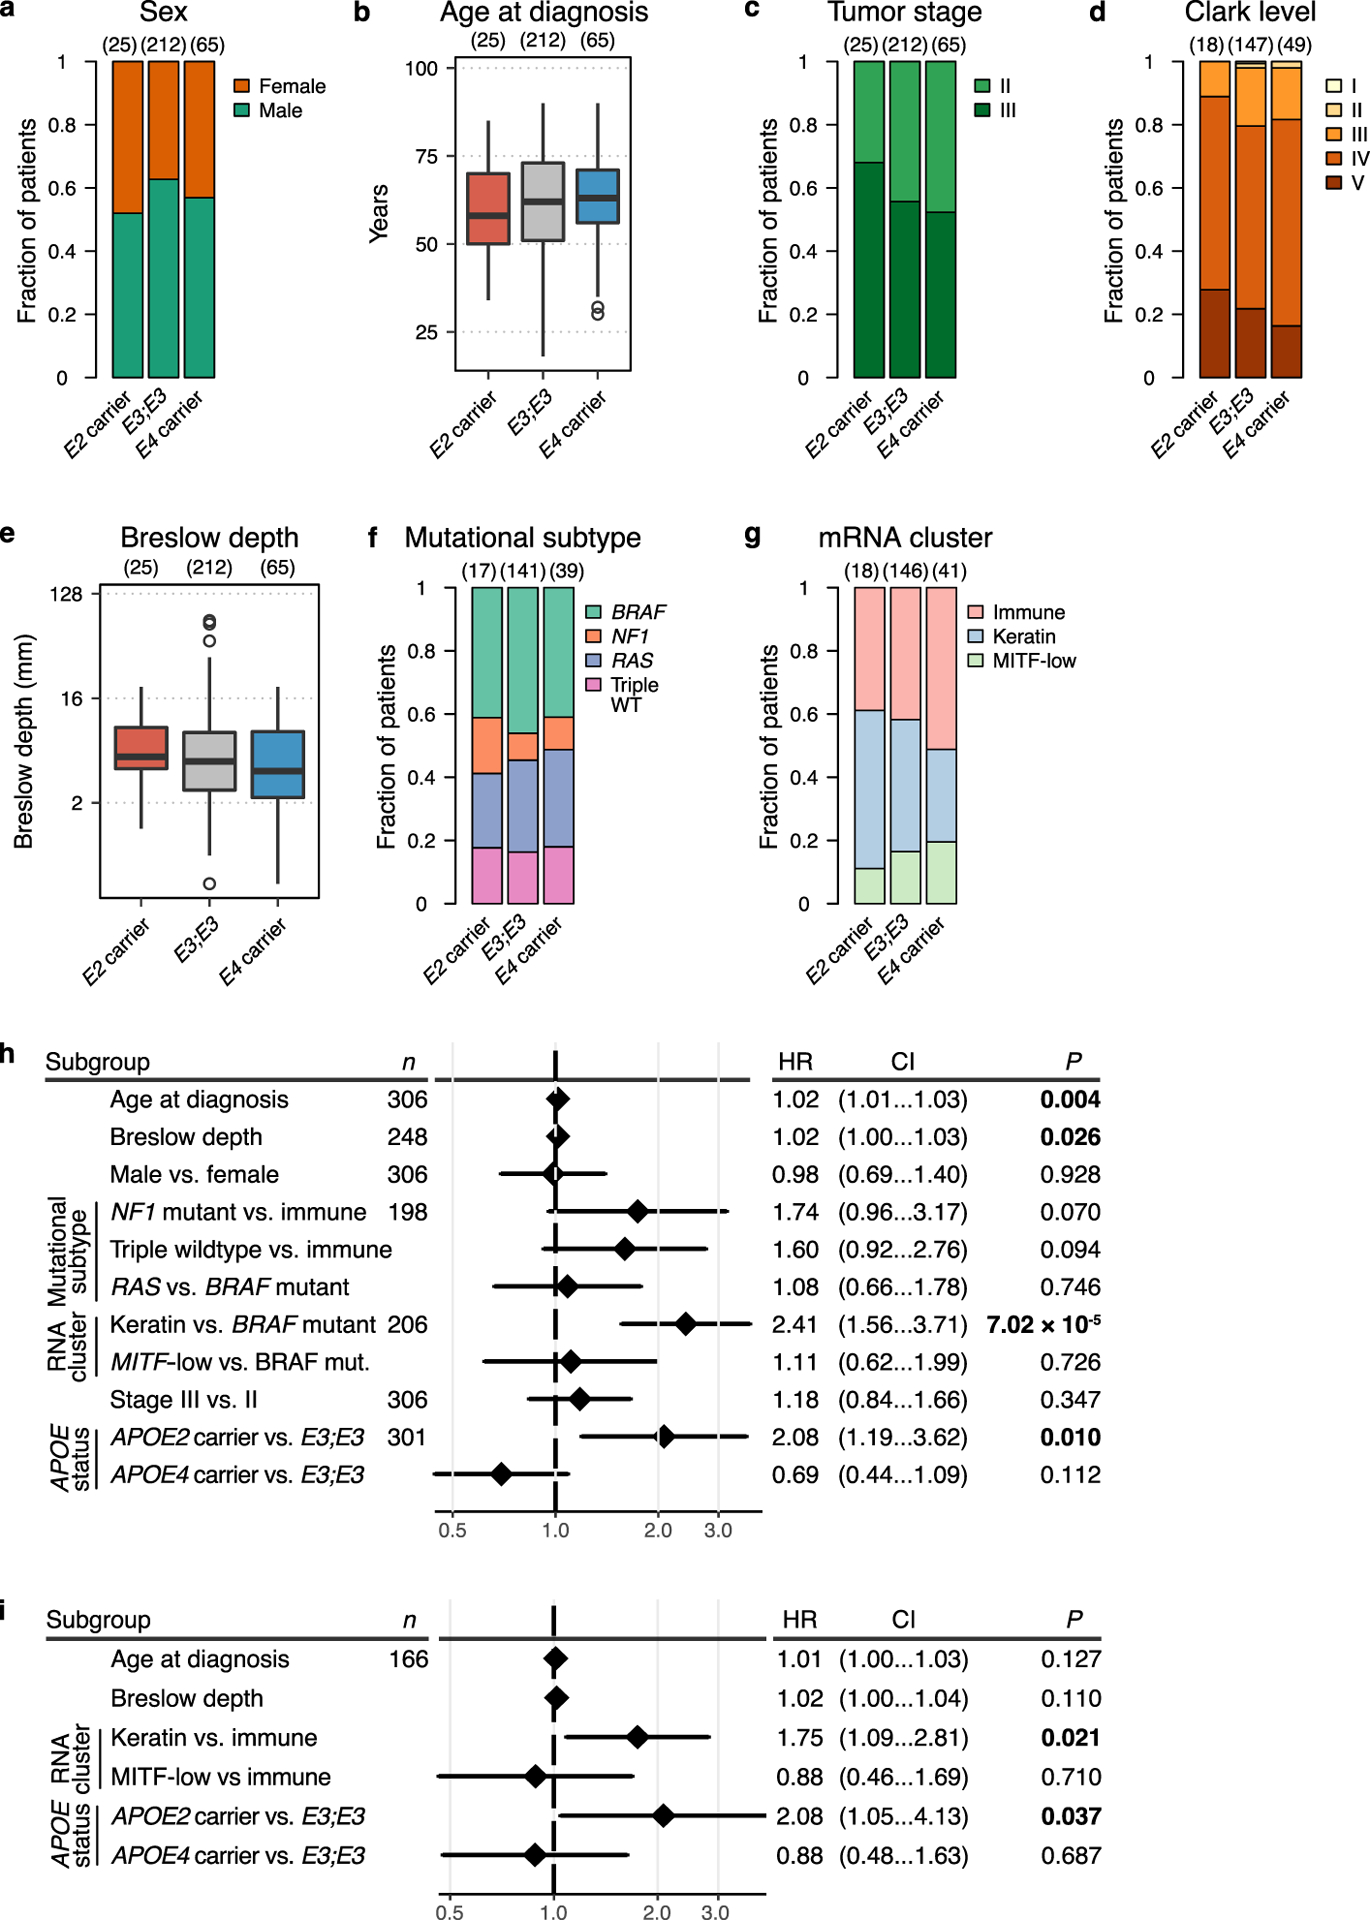
a, Sex proportions were not significantly different between APOE carrier groups (P = 0.46, χ2 test). b, Age at diagnosis was not significantly different between APOE carrier groups (P = 0.45, Kruskal-Wallis rank sum test). c, Tumor stage at diagnosis was not significantly different between APOE carrier groups (P = 0.4, χ2 test). d, Melanoma Clark level at diagnosis was not significantly different between APOE carrier groups (P = 0.95, χ2 test). e, Breslow depth was not significantly different between APOE carrier groups at diagnosis (P = 0.24, Kruskal-Wallis rank sum test). f, APOE carrier status was not significantly associated with common tumor mutations (P = 0.93, χ2 test). g, APOE carrier status was not significantly associated with transcriptomic cluster (P = 0.55, χ2 test). h, Univariate analysis of the impact of clinical and molecular characteristics on survival of stage II/III melanoma patients (P values according to univariate Cox proportional hazards model). i, Multivariable analysis of the impact of clinical and molecular characteristics with significant impact in univariate analysis on survival of stage II/III melanoma patients (P values according to multivariable Cox proportional hazards model). For (h-i), the number of patients with available information for a given characteristic is indicated in column “n”, and plots represent hazard ratios with 95% confidence intervals. Hinges of boxplots represent the first and third quartiles, whiskers extend to the smallest and largest value within 1.5 × interquartile ranges of the hinges, and points represent outliers.
Extended Data Fig. 8. APOE genotype in normal tissue versus tumor samples of stage II/III patients in the TCGA-SKCM study.
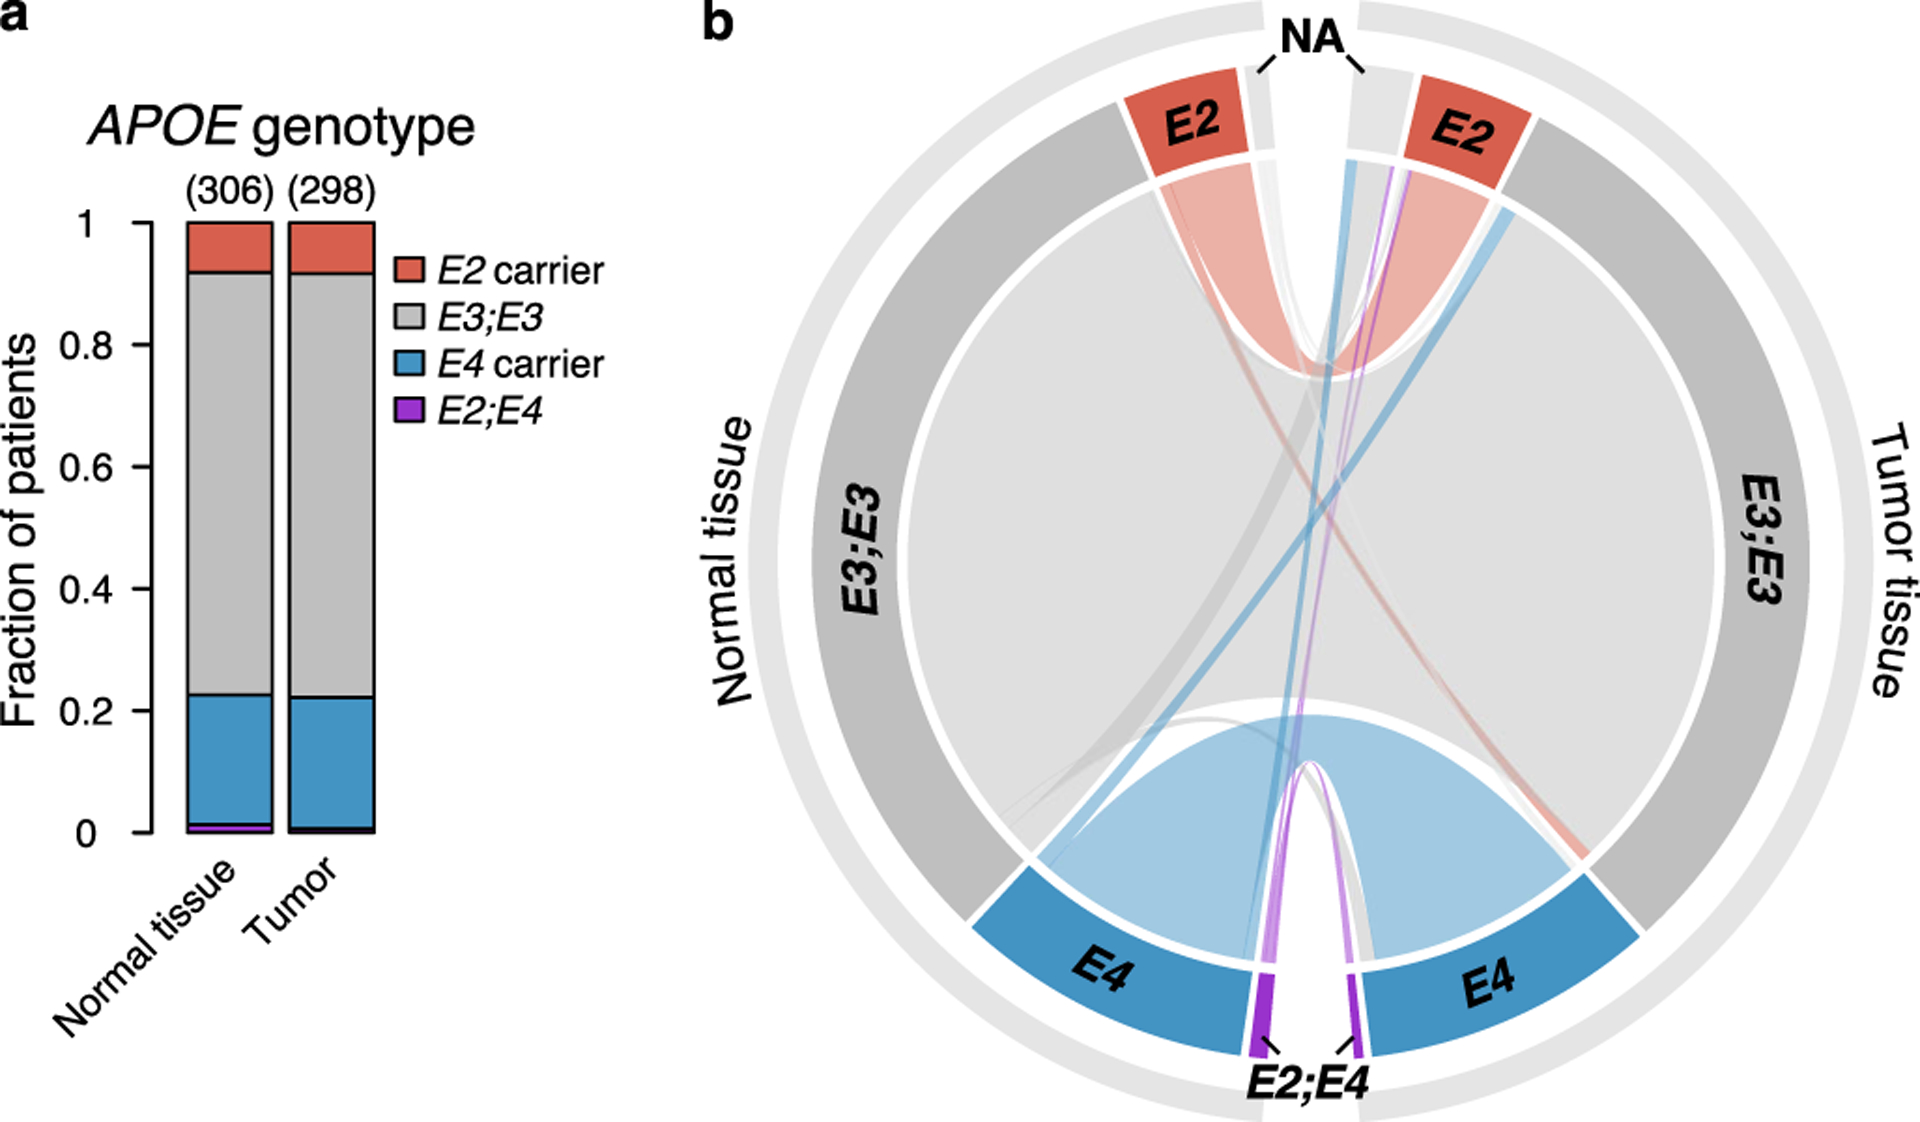
a, Proportion of APOE2 and APOE4 carrier status in normal tissue and tumor samples of patients with stage II/III melanoma in the TCGA-SKCM study (P = 0.8899; χ2 test). b, Chord diagram of APOE carrier status as identified in paired normal and tumor tissue samples of stage II/III melanoma patients in the TCGA-SKCM study.
Extended Data Fig. 9. Characteristics of the MDACC GWAS study and comparison to TCGA-SKCM.
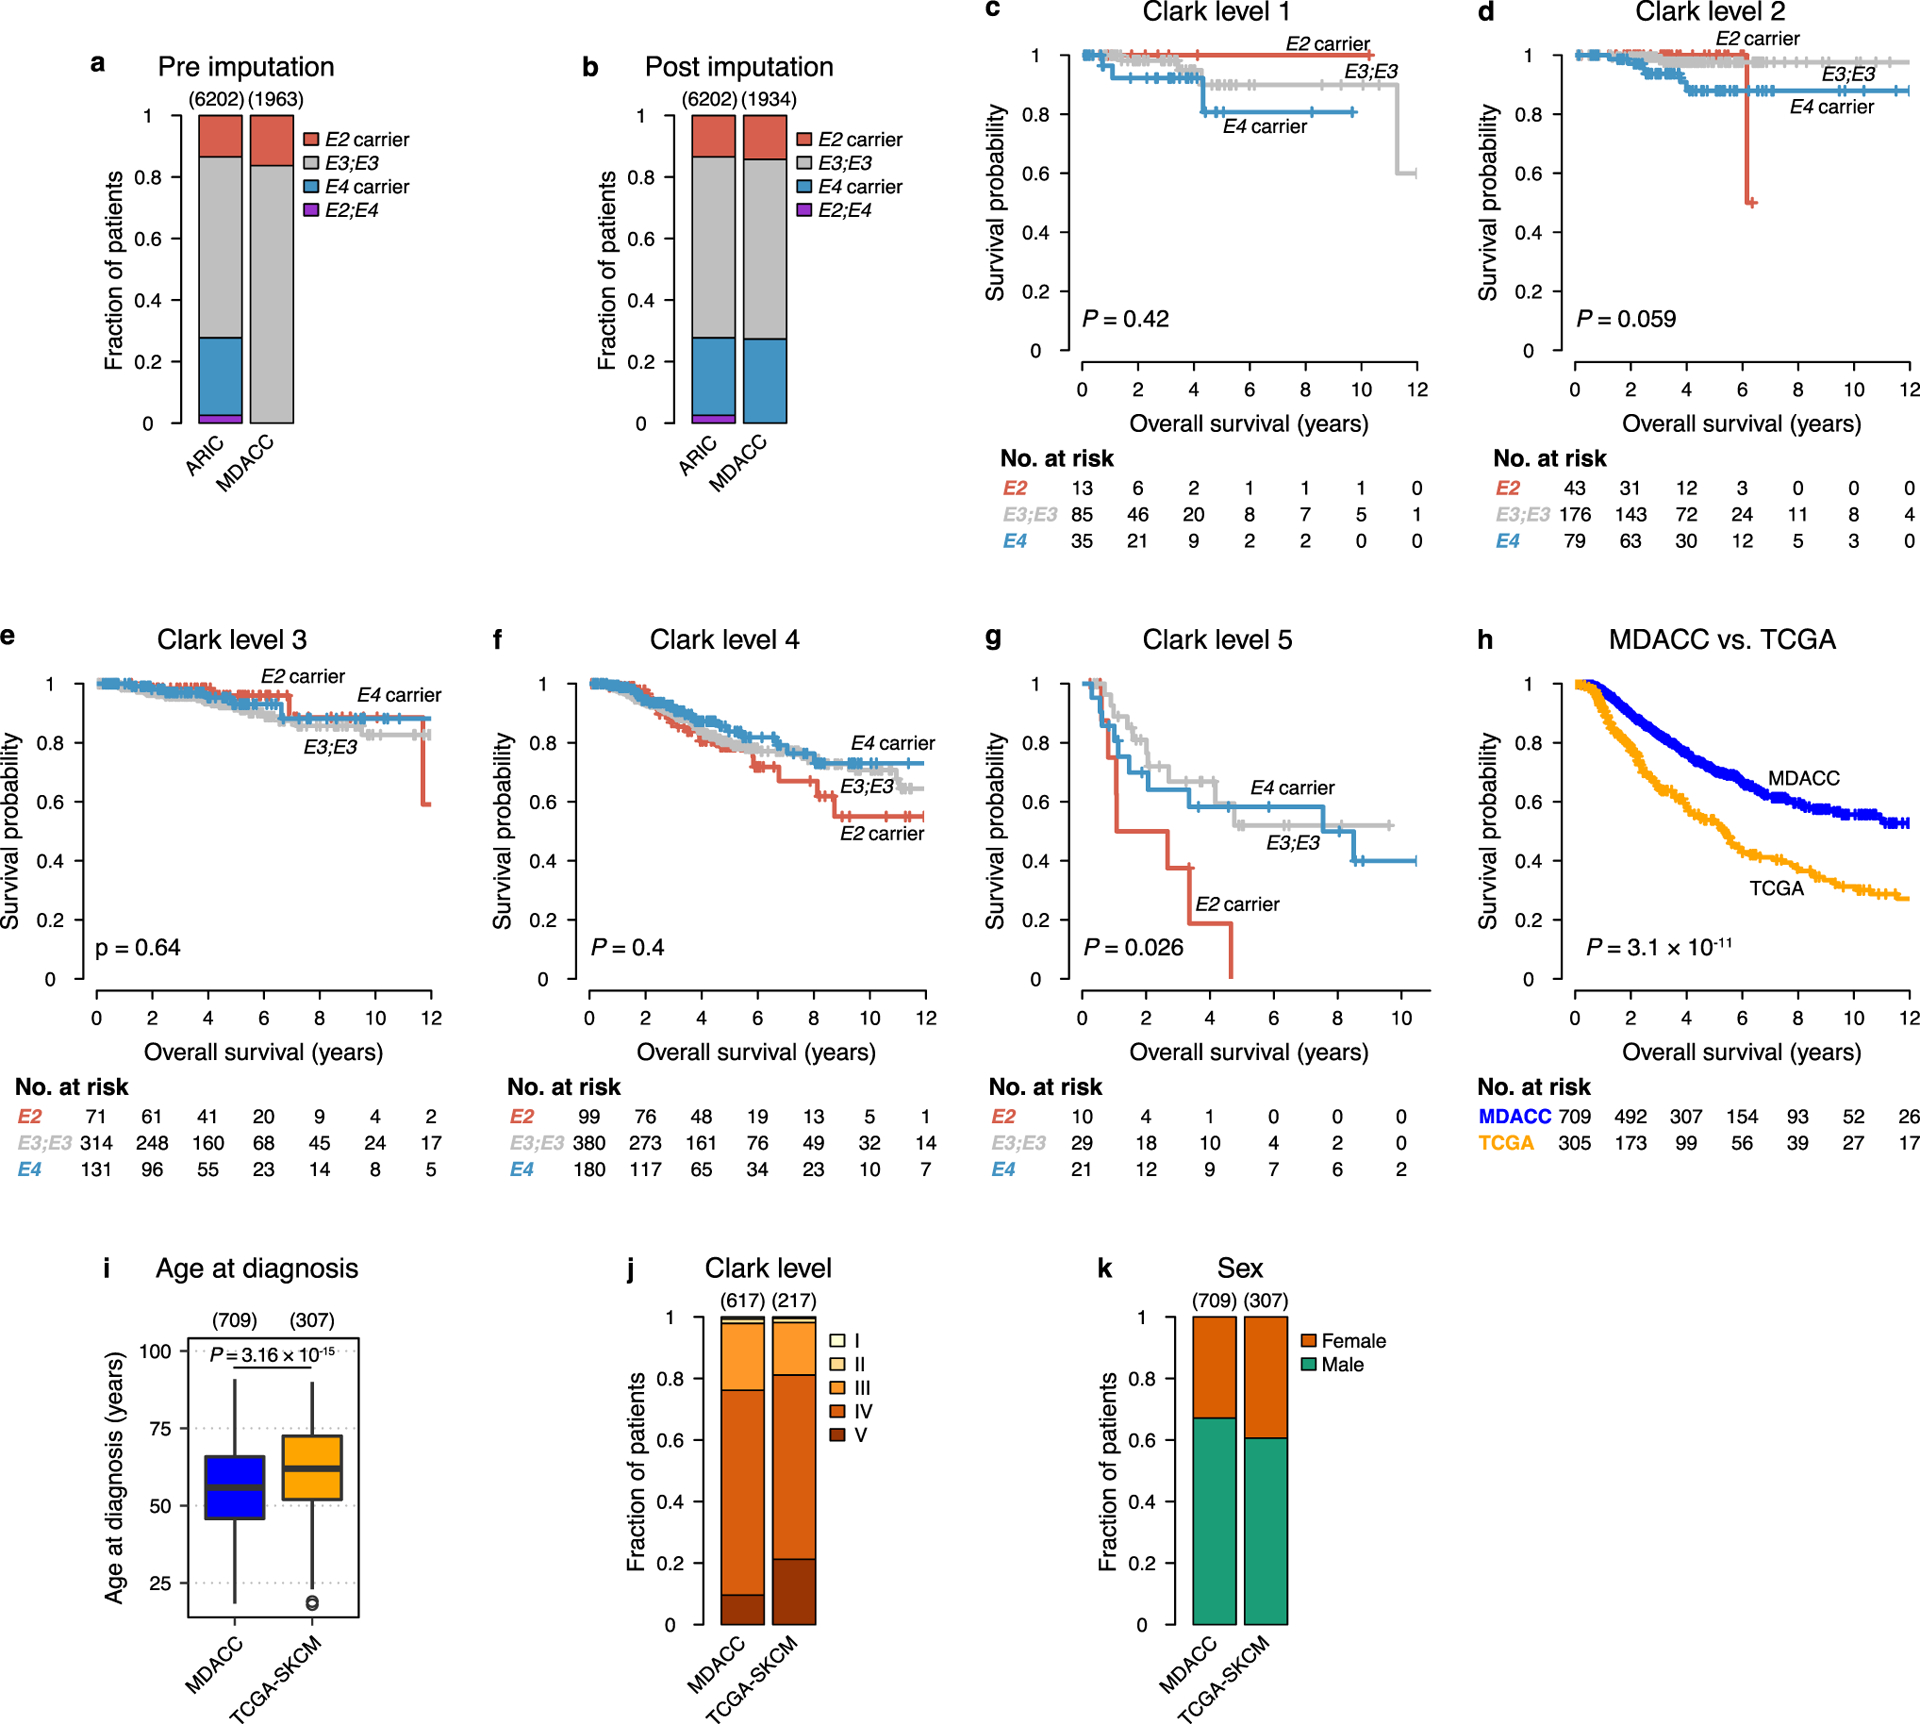
a-b, Distribution of APOE carrier status in the Atherosclerosis Risk in Communities study (ARIC) and the MDACC melanoma study before (a) and after (b) imputation of APOE genotype (P < 2.2 × 10⁻¹⁶ and P = 1.82 × 10⁻¹¹, respectively; χ2 test). c-g, Survival of melanoma patients in the MDACC study stratified by local melanoma stage and APOE genotype (two-sided log-rank tests). h, Survival of stage II/III melanoma patients in the MDACC and TCGA-SKCM studies (two-sided log-rank test). i-k, Distribution of age (i), melanoma Clark level (j), and sex (k) in stage II/III patients of the MDACC and TCGA-SKCM melanoma studies (respective significance tests: P = 6.42 × 10⁻⁹, Kruskal-Wallis rank sum test; P = 0.0005, χ2 test; P = 0.052, χ2 test). Hinges of boxplots represent the first and third quartiles, whiskers extend to the smallest and largest value within 1.5 × interquartile ranges of the hinges, and points represent outliers.
Extended Data Fig. 10. Association of APOE genotype with outcome in upfront anti-PD1 immunotherapy-treated melanoma patients.
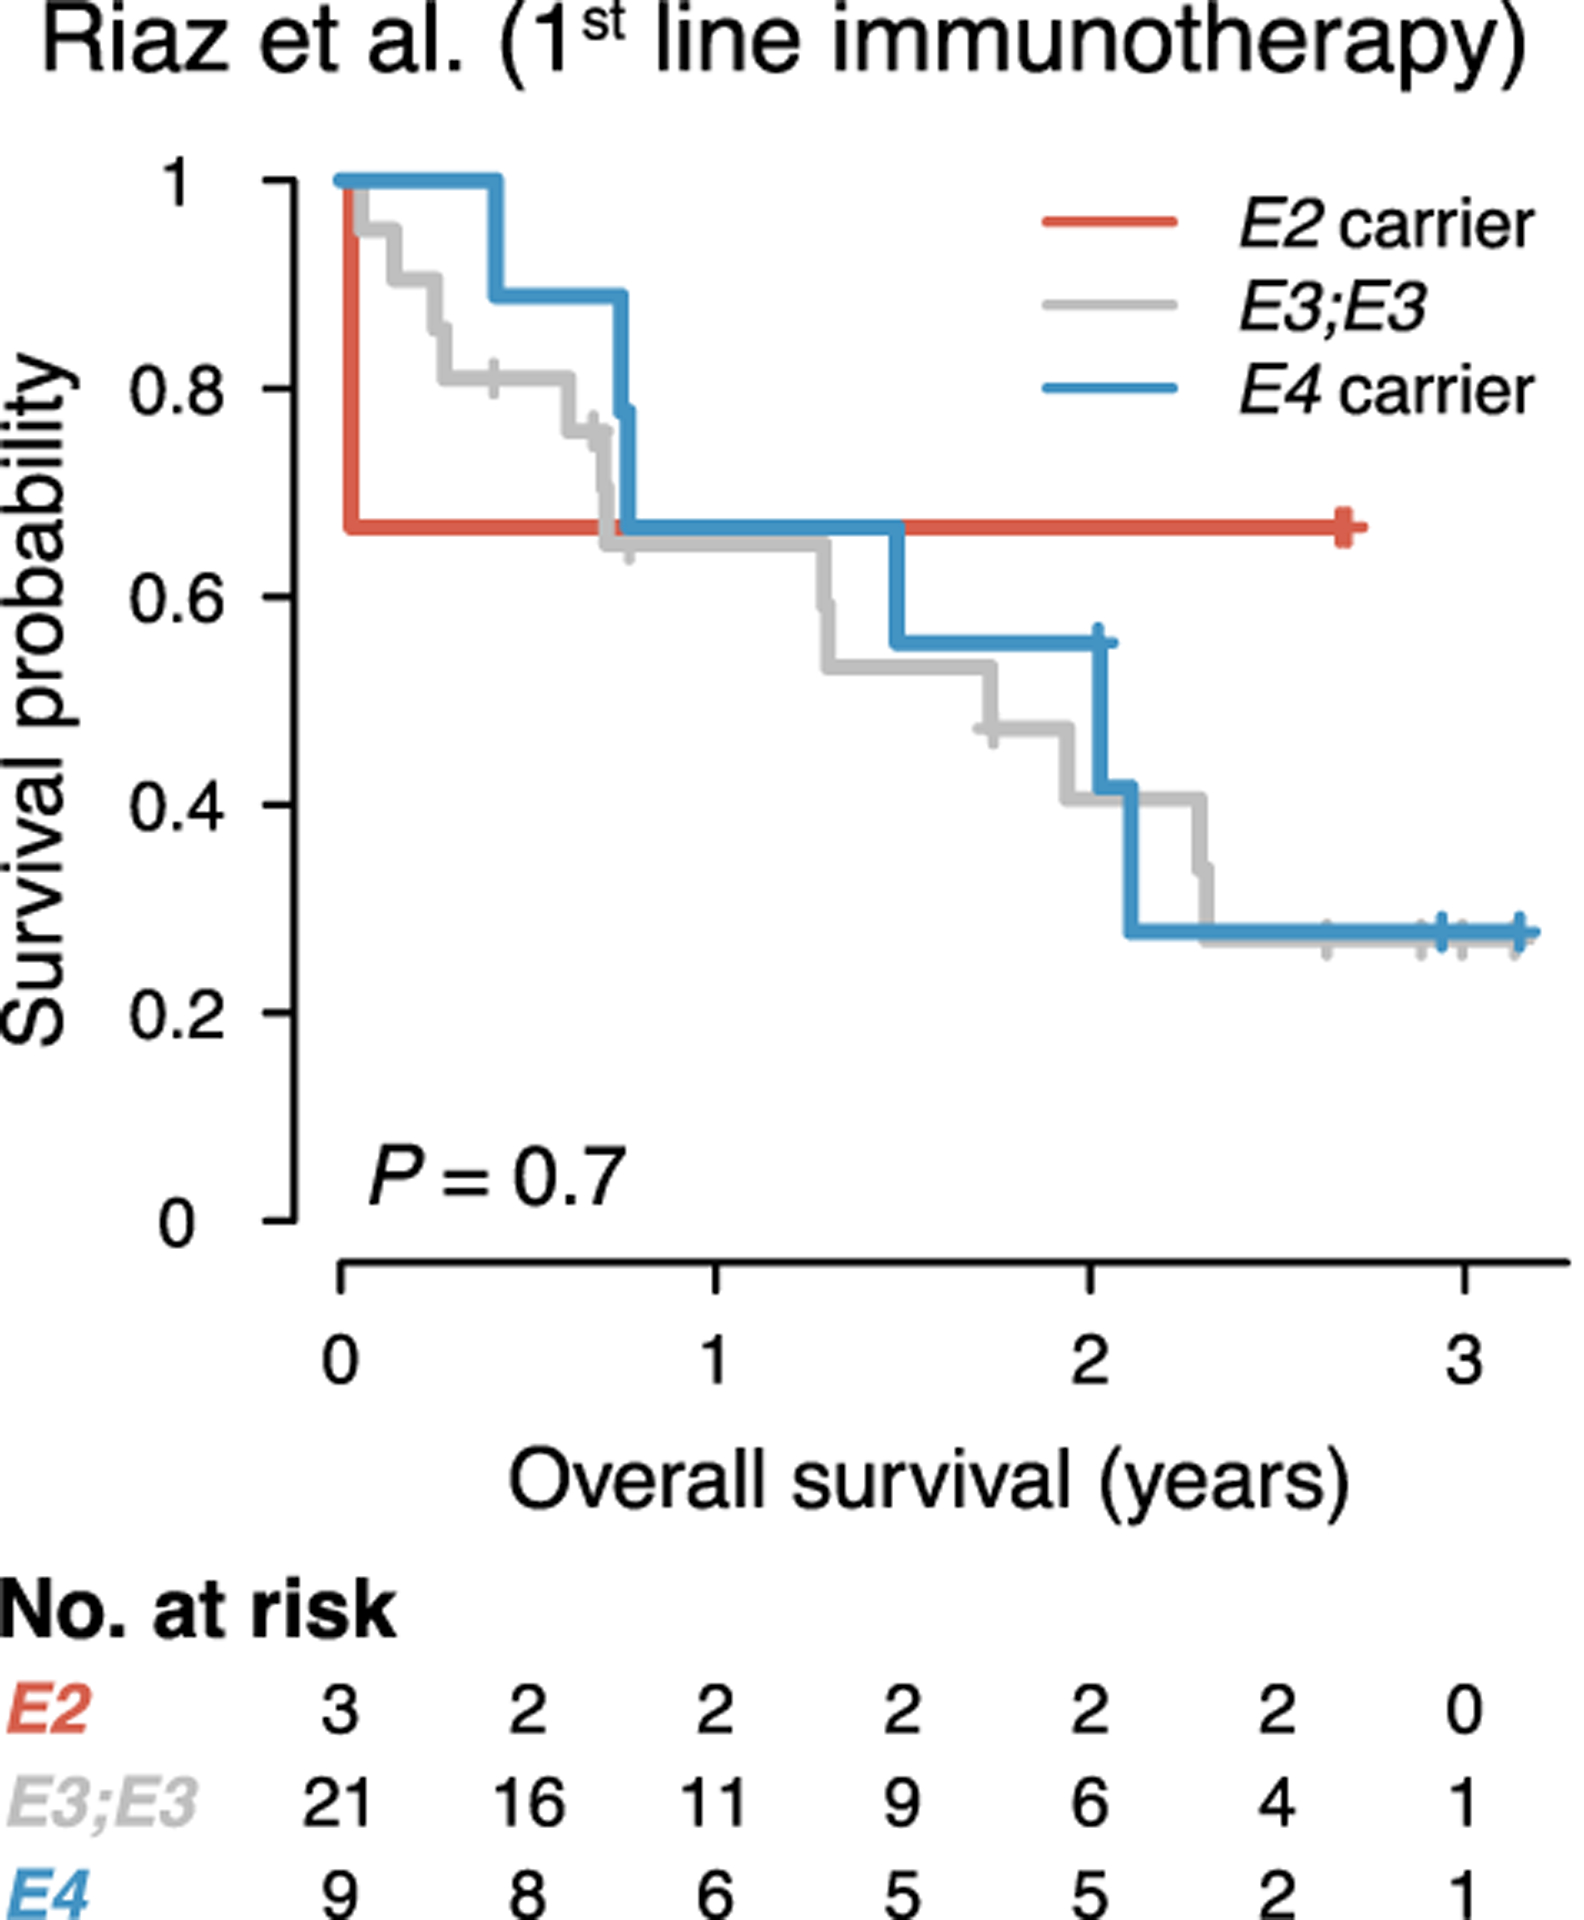
Survival of melanoma patients treated with anti-PD1 therapy with no prior checkpoint therapy from the Riaz et al. study (P value according to two-sided log-rank test).
Supplementary Material
Acknowledgments
We thank members of our laboratory and M. Tavazoie for comments on previous versions of the manuscript. We are grateful for assistance by Rockefeller University resource centers: S. Mazel and staff of the flow cytometry resource center, V. Francis and other veterinary staff of the Comparative Bioscience Center for animal husbandry and care, C. Zhao and staff at the genomics resource center for assistance with scRNA-seq, and A. North and staff at the Bio-Imaging Resource Center. We express gratitude to M. Bosenberg (Yale University) for kindly providing the YUMM1.7 and YUMMER1.7 cell lines. We thank the groups of P. Sullivan and N. Maeda for generating the human APOE targeted replacement mice and making them available through Taconic Biosciences. We are grateful to E. McMillan for early help with whole exome sequencing analysis. We also thank M. Szarek and H. Mostafavi for statistical advice. This work was supported by a National Institutes of Health grant RO1CA184804-01A2 (to S.F.T.). B.N.O. was supported by a Deutsche Forschungsgemeinschaft (DFG) postdoctoral fellowship (OS 498/1-1). J.B. and K.T. were supported by scholarships from the German National Academic Foundation. N.A. was supported by Medical Scientist Training Program grant T32GM007739 from the National Institutes of Health. B.T. was supported by the Lucy Lee Chiles Fellowship from the Hope Funds for Cancer Research. R.D.V. was in part supported by grant # UL1 TR001866 from the National Center for Advancing Translational Sciences, National Institutes of Health Clinical and Translational Science Award program. S.F.T. was supported by a Faculty Scholars grant from the Howard Hughes Medical Institute and the Reem-Kayden award.
Footnotes
Competing interests
S.F.T and B.N.O. are inventors on a US provisional patent application encompassing aspects of this work. S.F.T. is a co-founder, shareholder, and member of the scientific advisory board of Rgenix.
Data availability
All data analyzed from published studies are referenced and publicly available under the following accession numbers: TCGA-SKCM, dbGaP accession phs000178.v10.p8; MDACC GWAS study, phs000187.v1.p1; Roh et al. anti-PD1 treatment study, dbGaP BioProject ID PRJNA369259; Riaz et al. anti-PD1 treatment study, dbGaP BioProject ID PRJNA359359. Single-cell RNA-sequencing data has been deposited at the Gene Expression Omnibus (GEO) under accession number GSE146613. All other data are available from the corresponding author upon request.
References
- 1.Strittmatter WJ et al. Apolipoprotein E: high-avidity binding to beta-amyloid and increased frequency of type 4 allele in late-onset familial Alzheimer disease. Proc Natl Acad Sci U S A 90, 1977–81 (1993). [DOI] [PMC free article] [PubMed] [Google Scholar]
- 2.Corder EH et al. Protective effect of apolipoprotein E type 2 allele for late onset Alzheimer disease. Nat Genet 7, 180–4 (1994). [DOI] [PubMed] [Google Scholar]
- 3.Mahley RW Apolipoprotein E: from cardiovascular disease to neurodegenerative disorders. J Mol Med (Berl) 94, 739–46 (2016). [DOI] [PMC free article] [PubMed] [Google Scholar]
- 4.Tavazoie MF et al. LXR/ApoE Activation Restricts Innate Immune Suppression in Cancer. Cell 172, 825–840.e18 (2018). [DOI] [PMC free article] [PubMed] [Google Scholar]
- 5.Shi Y & Holtzman DM Interplay between innate immunity and Alzheimer disease: APOE and TREM2 in the spotlight. Nat Rev Immunol 18, 759–772 (2018). [DOI] [PMC free article] [PubMed] [Google Scholar]
- 6.Chen J, Li Q & Wang J Topology of human apolipoprotein E3 uniquely regulates its diverse biological functions. Proc Natl Acad Sci U S A 108, 14813–8 (2011). [DOI] [PMC free article] [PubMed] [Google Scholar]
- 7.Weisgraber KH, Innerarity TL & Mahley RW Abnormal lipoprotein receptor-binding activity of the human E apoprotein due to cysteine-arginine interchange at a single site. J Biol Chem 257, 2518–21 (1982). [PubMed] [Google Scholar]
- 8.Kowal RC et al. Opposing effects of apolipoproteins E and C on lipoprotein binding to low density lipoprotein receptor-related protein. J Biol Chem 265, 10771–9 (1990). [PubMed] [Google Scholar]
- 9.Xian X et al. Reversal of ApoE4-induced recycling block as a novel prevention approach for Alzheimer’s disease. Elife 7, (2018). [DOI] [PMC free article] [PubMed] [Google Scholar]
- 10.Kulminski AM et al. Age, gender, and cancer but not neurodegenerative and cardiovascular diseases strongly modulate systemic effect of the Apolipoprotein E4 allele on lifespan. PLoS genetics 10, e1004141 (2014). [DOI] [PMC free article] [PubMed] [Google Scholar]
- 11.Anand R, Prakash SS, Veeramanikandan R & Kirubakaran R Association between apolipoprotein E genotype and cancer susceptibility: a meta-analysis. J Cancer Res Clin Oncol 140, 1075–85 (2014). [DOI] [PMC free article] [PubMed] [Google Scholar]
- 12.Pencheva N et al. Convergent multi-miRNA targeting of ApoE drives LRP1/LRP8-dependent melanoma metastasis and angiogenesis. Cell 151, 1068–82 (2012). [DOI] [PMC free article] [PubMed] [Google Scholar]
- 13.Pencheva N, Buss CG, Posada J, Merghoub T & Tavazoie SF Broad-spectrum therapeutic suppression of metastatic melanoma through nuclear hormone receptor activation. Cell 156, 986–1001 (2014). [DOI] [PubMed] [Google Scholar]
- 14.Sullivan PM et al. Targeted replacement of the mouse apolipoprotein E gene with the common human APOE3 allele enhances diet-induced hypercholesterolemia and atherosclerosis. The Journal of biological chemistry 272, 17972–17980 (1997). [DOI] [PubMed] [Google Scholar]
- 15.Sullivan PM, Mezdour H, Quarfordt SH & Maeda N Type III hyperlipoproteinemia and spontaneous atherosclerosis in mice resulting from gene replacement of mouse Apoe with human Apoe*2. J Clin Invest 102, 130–5 (1998). [DOI] [PMC free article] [PubMed] [Google Scholar]
- 16.Knouff C et al. Apo E structure determines VLDL clearance and atherosclerosis risk in mice. The Journal of clinical investigation 103, 1579–1586 (1999). [DOI] [PMC free article] [PubMed] [Google Scholar]
- 17.Wang J et al. UV-induced somatic mutations elicit a functional T cell response in the YUMMER1.7 mouse melanoma model. Pigment Cell & Melanoma Research 30, 428–435 (2017). [DOI] [PMC free article] [PubMed] [Google Scholar]
- 18.Bonacina F et al. Myeloid apolipoprotein E controls dendritic cell antigen presentation and T cell activation. Nat Commun 9, 3083 (2018). [DOI] [PMC free article] [PubMed] [Google Scholar]
- 19.Toledo A, Monzón JD, Coleman JL, Garcia-Monco JC & Benach JL Hypercholesterolemia and ApoE deficiency result in severe infection with Lyme disease and relapsing-fever Borrelia. Proceedings of the National Academy of Sciences 112, 5491–5496 (2015). [DOI] [PMC free article] [PubMed] [Google Scholar]
- 20.Shi Y et al. ApoE4 markedly exacerbates tau-mediated neurodegeneration in a mouse model of tauopathy. Nature 549, 523–527 (2017). [DOI] [PMC free article] [PubMed] [Google Scholar]
- 21.Krasemann S et al. The TREM2-APOE Pathway Drives the Transcriptional Phenotype of Dysfunctional Microglia in Neurodegenerative Diseases. Immunity 47, 566–581.e9 (2017). [DOI] [PMC free article] [PubMed] [Google Scholar]
- 22.TCGA. Genomic Classification of Cutaneous Melanoma. Cell 161, 1681–1696 (2015). [DOI] [PMC free article] [PubMed] [Google Scholar]
- 23.Blair CK et al. APOE genotype and cognitive decline in a middle-aged cohort. Neurology 64, 268–76 (2005). [DOI] [PubMed] [Google Scholar]
- 24.Deelen J et al. A meta-analysis of genome-wide association studies identifies multiple longevity genes. Nat Commun 10, 3669 (2019). [DOI] [PMC free article] [PubMed] [Google Scholar]
- 25.Liu J et al. An Integrated TCGA Pan-Cancer Clinical Data Resource to Drive High-Quality Survival Outcome Analytics. Cell 173, 400–416.e11 (2018). [DOI] [PMC free article] [PubMed] [Google Scholar]
- 26.Amos CI et al. Genome-wide association study identifies novel loci predisposing to cutaneous melanoma. Hum Mol Genet 20, 5012–23 (2011). [DOI] [PMC free article] [PubMed] [Google Scholar]
- 27.Larkin J et al. Five-Year Survival with Combined Nivolumab and Ipilimumab in Advanced Melanoma. N Engl J Med 381, 1535–1546 (2019). [DOI] [PubMed] [Google Scholar]
- 28.Leach DR, Krummel MF & Allison JP Enhancement of antitumor immunity by CTLA-4 blockade. Science 271, 1734–1736 (1996). [DOI] [PubMed] [Google Scholar]
- 29.Okazaki T & Honjo T PD-1 and PD-1 ligands: from discovery to clinical application. International Immunology 19, 813–824 (2007). [DOI] [PubMed] [Google Scholar]
- 30.Roh W et al. Integrated molecular analysis of tumor biopsies on sequential CTLA-4 and PD-1 blockade reveals markers of response and resistance. Sci Transl Med 9, (2017). [DOI] [PMC free article] [PubMed] [Google Scholar]
- 31.Riaz N et al. Tumor and Microenvironment Evolution during Immunotherapy with Nivolumab. Cell 171, 934–949.e16 (2017). [DOI] [PMC free article] [PubMed] [Google Scholar]
- 32.Evans RM & Mangelsdorf DJ Nuclear Receptors, RXR, and the Big Bang. Cell 157, 255–66 (2014). [DOI] [PMC free article] [PubMed] [Google Scholar]
- 33.Hong C & Tontonoz P Liver X receptors in lipid metabolism: opportunities for drug discovery. Nat Rev Drug Discov 13, 433–44 (2014). [DOI] [PubMed] [Google Scholar]
- 34.Nathan BP et al. Differential effects of apolipoproteins E3 and E4 on neuronal growth in vitro. Science 264, 850–2 (1994). [DOI] [PubMed] [Google Scholar]
- 35.Meeth K, Wang JX, Micevic G, Damsky W & Bosenberg MW The YUMM lines: a series of congenic mouse melanoma cell lines with defined genetic alterations. Pigment Cell Melanoma Res 29, 590–7 (2016). [DOI] [PMC free article] [PubMed] [Google Scholar]
- 36.Ponomarev V et al. A novel triple-modality reporter gene for whole-body fluorescent, bioluminescent, and nuclear noninvasive imaging. European Journal of Nuclear Medicine and Molecular Imaging 31, 740–751 (2004). [DOI] [PubMed] [Google Scholar]
- 37.Young L, Sung J, Stacey G & Masters JR Detection of Mycoplasma in cell cultures. Nature Protocols 5, 929–934 (2010). [DOI] [PubMed] [Google Scholar]
- 38.Hixson JE & Vernier DT Restriction isotyping of human apolipoprotein E by gene amplification and cleavage with HhaI. Journal of lipid research 31, 545–548 (1990). [PubMed] [Google Scholar]
- 39.Yoshida H et al. The cis-Regulatory Atlas of the Mouse Immune System. Cell 176, 897–912.e20 (2019). [DOI] [PMC free article] [PubMed] [Google Scholar]
- 40.Yu G, Wang LG, Han Y & He QY clusterProfiler: an R package for comparing biological themes among gene clusters. OMICS 16, 284–7 (2012). [DOI] [PMC free article] [PubMed] [Google Scholar]
- 41.Subramanian A et al. Gene set enrichment analysis: a knowledge-based approach for interpreting genome-wide expression profiles. Proc Natl Acad Sci U S A 102, 15545–50 (2005). [DOI] [PMC free article] [PubMed] [Google Scholar]
- 42.Radmanesh F et al. Accuracy of imputation to infer unobserved APOE epsilon alleles in genome-wide genotyping data. Eur J Hum Genet 22, 1239–42 (2014). [DOI] [PMC free article] [PubMed] [Google Scholar]
Associated Data
This section collects any data citations, data availability statements, or supplementary materials included in this article.