Abstract
Bile acids serve as one of the most important classes of biological molecules in the gastrointestinal system. Due to their structural similarity, bile acids have historically been difficult to accurately annotate in complex biological matrices using mass spectrometry. They often have identical or nominally similar mass-to-charge ratios and similar fragmentation patterns that make identification by mass spectrometry arduous, normally involving chemical derivatization and separation via liquid chromatography. Here, we demonstrate the use of drift tube ion mobility (DTIM) to derive collision cross section (CCS) values in nitrogen drift gas (DTCCSN2) for use as an additional descriptor to facilitate expedited bile acid identification. We also explore trends in DTIM measurements and detail structural characteristics for differences in DTCCSN2 values between subclasses of bile acid molecules.
Graphical Abstract
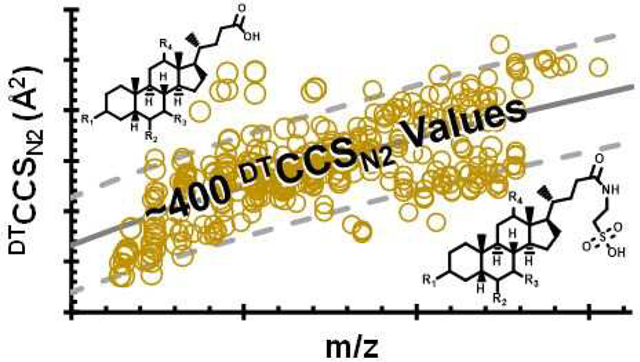
Bile acids are compounds that are essential for human health. These compounds primarily assist in the solubilization of dietary lipids and promote their absorption through the digestive tract.1 Bile acids are the primary mechanism governing the elimination of cholesterol, aid in the motility of bacteria in the small intestine, and act as signaling molecules for the mitogen-activated protein kinase (MAPK) pathways, nuclear hormone receptors (FXRα), and the G-protein-coupled receptor (GPCR) TGR5.1,2 The function of any individual compound from this class of molecules is dictated by its specific structure, so the accurate identification of these molecules is of growing importance. However, the separation of bile acids remains challenging due to their structural similarities, often resulting in indistinguishable MS/MS fragmentation patterns and similar chromatographic retention times.
Bile acids are derived from cholesterol and possess a fused four ring core with four primary substitution sites (typically on carbons 3, 6, 7, and 12 as shown in red in Figure 1). Bile acids are characterized by conjugation at carbon 24 (designated in blue in Figure 1) and the functionalization of these substitution sites.3 The most common modification, a hydroxyl group, can vary in position and/or orientation, and often determines molecular function. For example, chenodeoxycholic acid (CDCA) and deoxycholic acid (DCA) are two bile acids that differ in the position of the hydroxyl group. Both compounds solubilize lipids as part of the enterohepatic circulatory system, but DCA additionally acts as a hepatotoxin and oncometabolite.4,5
Figure 1.
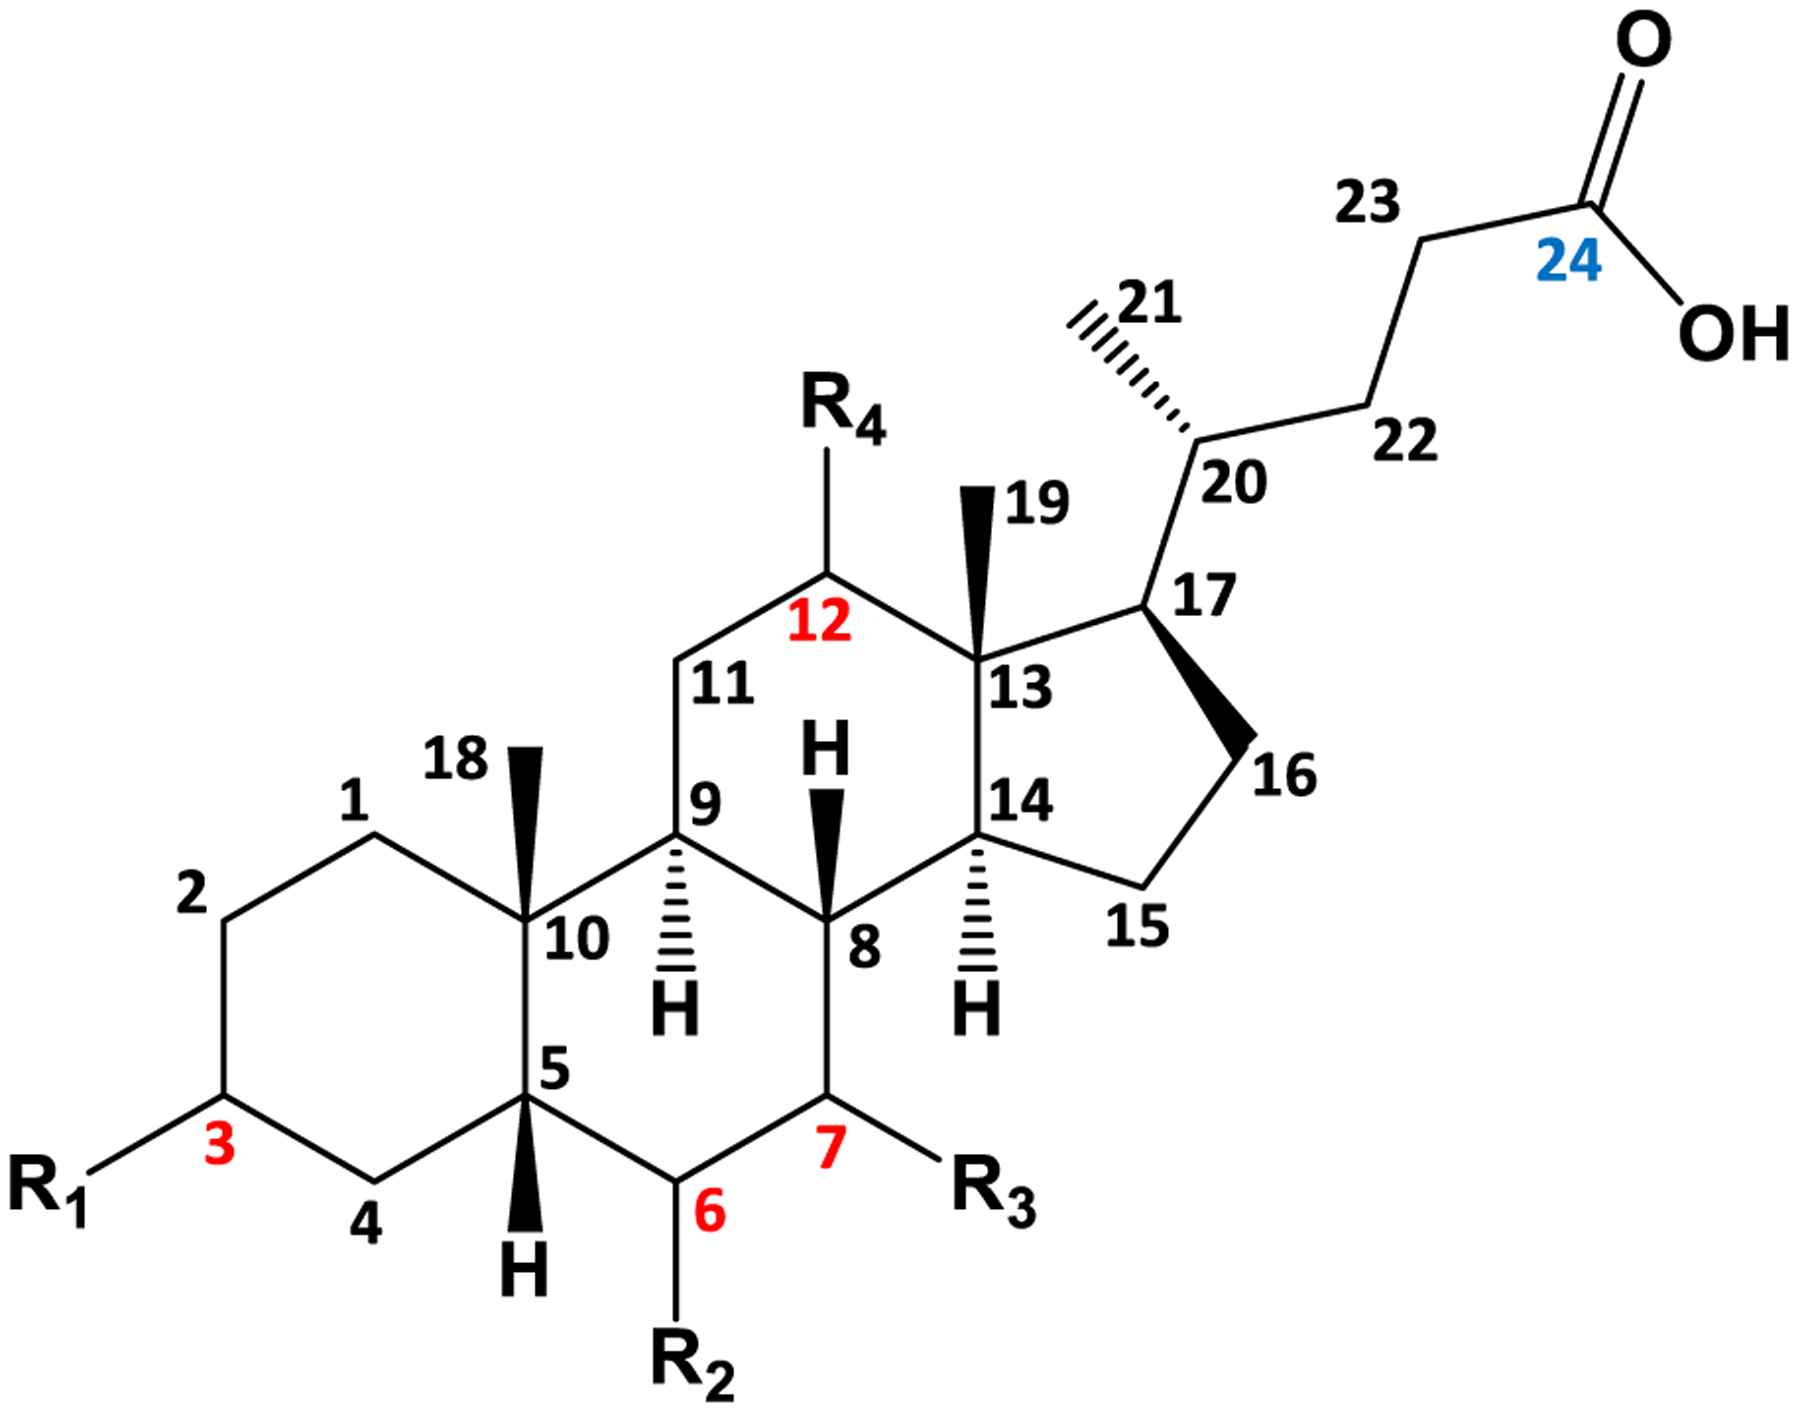
Four ring structure common to all bile acids. Carbons are numbered with substituents located at carbons 3, 6, 7, and 12, highlighted in red font. R groups are −H, −OH, or −HSO4 groups. Carbon 24, highlighted in blue font, is conjugated with glycine or taurine to yield glycocholates and taurocholates, respectively.
Bile acids are difficult to distinguish from each other with liquid chromatography–mass spectrometry (LC–MS) methods alone, due in part to their similar polarities.6 One example, the isomeric pair α- and β-muricholic acid, only differ in the orientation of the hydroxyl group on carbon 6. Zheng et al. recently demonstrated that α- and β-muricholic acid could be resolved using ion mobility (IM), even with these slight structural differences.8 This demonstrates the utility of IM as an additional dimension of separation, in conjunction with LC.7,8 Accurate identification and quantification of bile acids are of great biological importance, as it is becoming more apparent that both the host and commensal gut bacteria play a role in bile acid composition and function.9 In addition, with the discovery of novel bile acids conjugated with leucine and glycine, the need to identify bile acids is more important.10
Picache et al. recently published and released the Unified Collision Cross Section (CCS) Compendium containing a myriad of compounds including lipids, carbohydrates, amino acids, peptides, and other small molecules.11 The motivation for the Unified CCS Compendium is to provide an open source database for the IM community to collect and compare CCS values that meet specific criteria for precision and accuracy. CCS values can then be used as an additional descriptor for omic studies to aid in the identification and validation of unknown small molecules. It has been demonstrated that molecules with similar chemical motifs tend to exhibit correlations in conformational space.12–14 Compounds of a given biomolecular class that adopt similar gas phase structures fall along specific mass-mobility trendlines. Using both CCS values and mass-to-charge (m/z) ratios, it is possible to increase confidence in metabolite annotation to identify unknown molecules and predict biomolecular class when performing global untargeted metabolomic studies.12,14–21 The Unified CCS Compendium previously contained a limited number of bile acid entries, with proton loss [M − H]− being the most reported ion state. In this report, we expand on previously obtained CCS values of bile acids by adding conjugated, unsaturated, and sulfated bile acids in both positive and negative ionization modes. While several ion forms were observed in negative ionization mode, [M − H]− was the predominant ion form. Positive ionization mode analyses contained a variety of ion forms including [M + Na]+, [M − H2O + H]+, [M − 2H2O + H]+, [M − H2O − SO3 + H]+, [M − 2H2O − SO3 + H]+, and [M − 3H2O − SO3 + H]+. Given the increased complexity of bile acid data in positive ionization mode due to the formation of numerous abundant ion forms, it is our recommendation that negative ionization mode be prioritized for bile acid identification.
METHODS
Standards and Chemicals.
Optima grade acetonitrile and water were purchased from Fisher Scientific (Loughborough, UK). Ammonium acetate was purchased from Sigma-Aldrich (Dorset, UK). Formic acid was purchased from Fluka (Buchs, Switzerland). Bile acid standards were purchased from Steraloids, Inc. (Newport, RI) and included tauro-alpha-muricholic acid (T-α-MCA), tauro-beta-muricholic acid (T-β-MCA), tauro-omega-muricholic acid (T-ω-MCA), alpha-muricholic acid (α-MCA), beta-muricholic acid (β-MCA), taurohyocholic acid (THCA), glycoursodeoxycholic acid (GUDCA), tauroursodeoxycholic acid (TUDCA), hyocholic acid (HCA), taurohyoxydeoxycholic acid (THDCA), taurocholic acid (TCA), cholic acid (CA), ursodeoxycholic acid (UDCA), hyodeoxycholic acid (HDCA), glycodeoxycholic acid (GDCA), taurodeoxycholic acid (TDCA), chenodeoxycholic acid (CDCA), and deoxycholic acid (DCA).
Measurements of CCS of Bile Acids.
The DTCCSN2 values for 50 bile acids were determined based on the Agilent 6560 standardized single field DTCCSN2 protocol established by Stow et al.22 This allows for the most consistent determination of DTCCSN2 values with precisions generally lower than 0.2% RSD (n = 3 taken on 3 separate days). Injection procedures were similar to a previously described method,21 in which bile acid standards were first diluted to 10 μg/mL in acetonitrile and stored in glass autosampler vials at 4 °C. Aliquots of 10 μL were injected at 100 μL/min via a 100 μL sample loop directly to the Agilent Jet Stream electrospray ionization source (i.e., no LC column was used). Source settings included drying gas at 300 °C and 4 L/min, sheath gas at 200 °C and 8 L/min, nebulizer pressure at 12 psi, and electric potential of the entrance capillary and nozzle held at 2800 and 1750 V, respectively. The mobile phase was 50% acetonitrile with 0.1% formic acid and 50% water with 0.1% formic acid. Similar to a previously described method,23 the initial flow rate of 800 μL/min was decreased to 30 μL/min from 0.15 to 0.16 min, where it was held at 30 μL/min until 0.90 min. From 0.90 to 1.00 min, the flow rate was increased to 800 μL/min and maintained for 1.00 min to wash and prevent sample carryover. In the 2.00 min data acquisition, features from each sample injection were detected from 0.20 to 1.00 min. DTCCSN2 values were collected in this window in both positive and negative ionization mode, with a 1350 V bias and nitrogen at 3.94 Torr and 26 °C in the IM drift tube with nitrogen used as the drift gas. Data was collected once per day for 3 days to yield three replicates per sample. All bile acid standards were analyzed individually, and methods were in agreement with the DTCCSN2 data handling protocol described by Picache et al. with relative standard deviations generally lower than 0.2%.9 DTCCSN2 values measured in this work have been submitted to the Unified CCS Compendium for community access.
Retrospective Analysis.
To demonstrate the utility in using CCS values, data previously generated in our lab was re-evaluated with the DTCCSN2 values provided in this manuscript. Briefly, three groups of mice were compared after gastric bypass surgery including a control group, a group that received a less extreme biliary diversion surgery, and a group that received a more extreme biliary diversion surgery.21 Stool samples were acquired 4 weeks postsurgery, and comparative global, untargeted analyses were performed for the extracted metabolites. Data was analyzed via Progenesis QI software (version 2.3, Nonlinear Dynamics, Newcastle, UK). TWCCSN2 values were collected for all metabolites, including detected bile acids. The CCS trendline generated using the data in this manuscript was used to identify potential bile acids previously unidentified in the data set. This retrospective analysis identified an additional 20 features corresponding to bile acids and highlights the strength of using CCS values for annotating and identifying metabolites in global, untargeted data sets.
DISCUSSION
The bile acids in this study were found to ionize readily via electrospray ionization. While [M − H]− was the predominant ion form in negative ionization mode, other ion forms were observed at lower relative abundance including [M + Cl]−, [M + HCOO]−, and [M + Na − H + HCOO]−. In positive ionization mode, coordination of a proton or sodium ion were common, with proton-coordinated species solely appearing with neutral losses, including loss of H2O and/or SO3. Multimeric species were observed at high abundance in both polarities, although the scope of this work was limited to measurement of DTCCSN2 values of singly charged, monomeric bile acids. The multiple ion forms observed in positive ionization mode for β-muricholic acid are depicted in the IM–MS plot in Figure 2. In this IM–MS spectrum, the [M + H]+ ion is present in very low relative abundance, while the [M + Na]+ ion is prominent. As for most bile acids in this study, neutral water loss was common, with [M − H2O + H]+, [M − 2H2O + H]+, and [M − 3H2O + H]+ ion forms present in high relative abundance. The arrival time distributions of the four most abundant ion forms of β-muricholic acid can be found in Figure S1. Due to hydroxyl and/or sulfate groups being the main differentiating features between bile acids, the common appearance of such a wide variety of ion forms across both polarities makes it extremely challenging to distinguish functionalized bile acids from one another in complex mixtures. Additionally, close alignment was observed between higher and lower m/z ion forms for some bile acids, with multiple ion mobility features observed for the lower m/z ion forms of those molecules (the ion mobility features of fastest drift time have been reported here), indicating the higher m/z ion forms may be metastable adducts (Figure S2). Metastable ion forms may be measured in the ion mobility region as the larger ion form and then dissociate to a smaller ion form prior to being measured in the mass spectrometer; the putative nonadducted species is reported herein.
Figure 2.
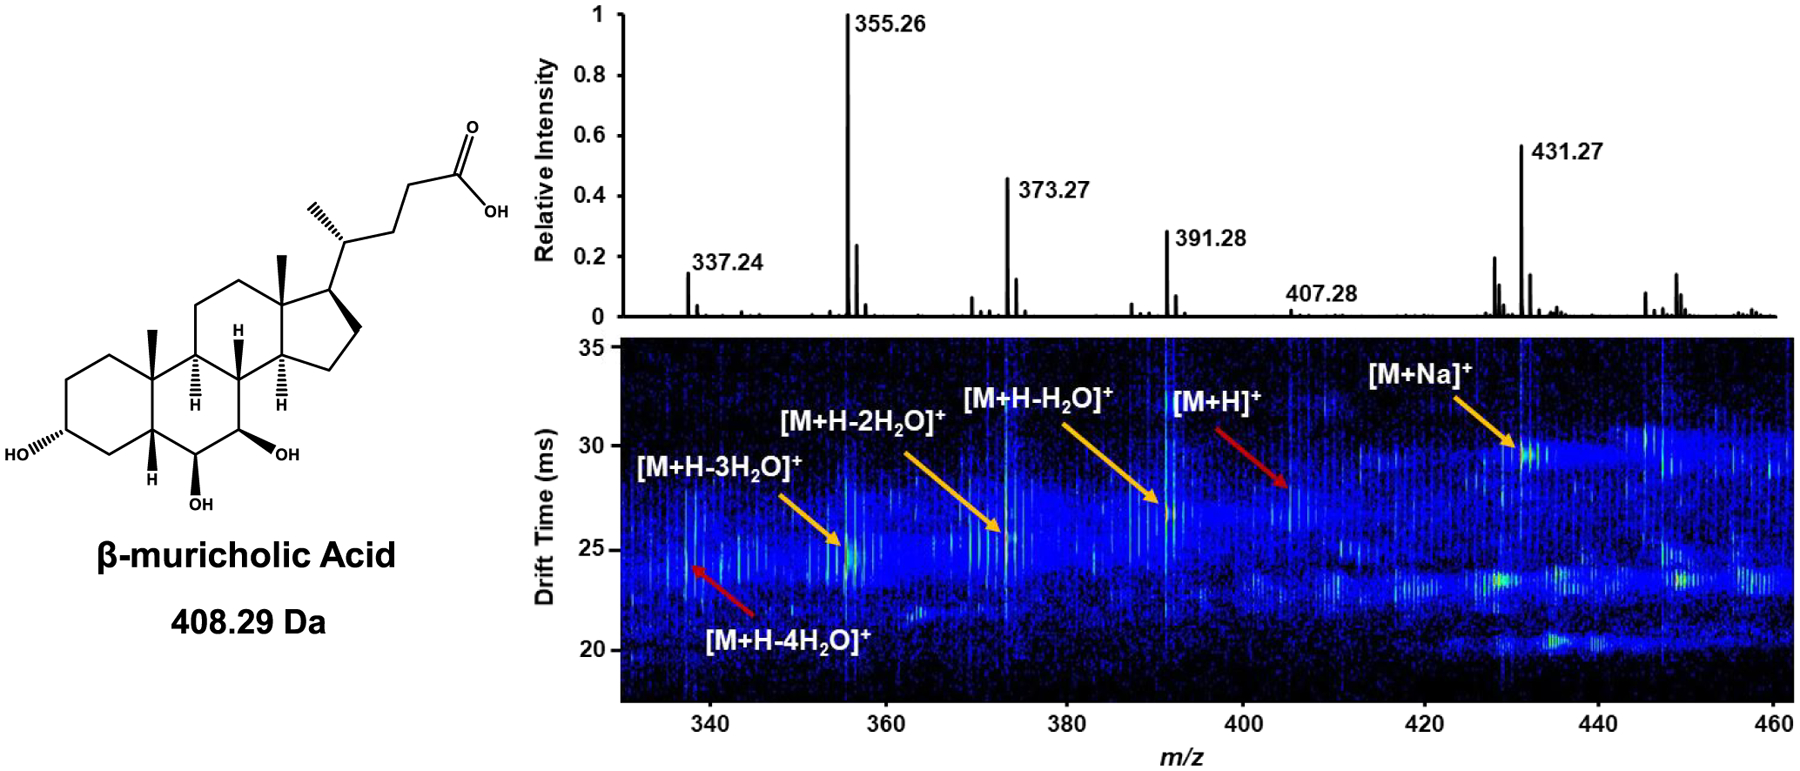
Representative IM–MS spectrum of β-muricholic acid in positive ionization mode. Multiple ion forms were observed in both polarities, with water loss commonly exhibited for proton-coordinated species in positive ionization mode. Collision cross sections are reported for species denoted by yellow arrows; however, those species denoted by red arrows are not reported due to low intensity.
Nomenclature, molecular formula, R substituents, m/z, and DTCCSN2 values for the unsulfated bile acids (including both glycine and taurine conjugated species) are found in Table 1. Bile acid subclasses are based on glycine and taurine conjugation of the carbon 24 carboxyl group, bond saturation, sulfation, and oxidation of one of the hydroxyl groups. Figure 3 depicts the mobility–mass conformational space of the [M − H]− ion forms of bile acids analyzed in this study, grouped by subclass, as well as the trendline representing the correlation of DTCCSN2 to m/z. The grouping within each plotted subclass indicates how they cluster in different regions of conformational space. DTCCSN2 values can be found in Tables S1–S3. Similar to other classes in the Unified CCS Compendium, bile acids cluster in DTCCSN2 vs m/z space based on their structural similarity and degree of packing in the gas phase. As is observed for most classes of molecules, we observe a general increase in DTCCSN2 with m/z. The subclass (n > 2) that has the smallest range in collision cross section is the glycine conjugated bile acids (n = 4, m/z 432.31–464.30 Da) with a range of 2.7 Å2, while the subclasses (n > 2) with the largest collision cross section ranges are the oxidized bile acids and unconjugated sulfated bile acids with ranges of 15.2 Å2 (n = 7, m/z 373.27–405.26 Da) and 15.3 Å2 (n = 7, m/z 455.25–487.24 Da), respectively. This is similar to results reported by Zheng et al. in that smaller unsaturated bile acids separate more readily than saturated bile acids in DTCCSN2 space.8 Zheng et al. reported glycine and taurine conjugated bile acid isomers (m/z 448.31 and 514.28, respectively) were the most difficult to separate.8 This can be associated to the narrow DTCCSN2 range of the bile acids after glycine or taurine conjugation. It was reported that glycine conjugated bile acids had a smaller DTCCSN2 range than oxidized bile acids (2.7 Å2 for glycine conjugated and 7.0 Å2 for oxidized).8
Table 1.
Negative Ionization Mode DTCCSN2 Measurements for [M − H]− Ion Forms of Unsulfated Bile Acids Reported in This Studya
| Sub-class | Name | Molecular Formula | R1 | R2 | R3 | R4 | m/z | DTCCSN2 (Å2) [M−H]− | % RSD |
|---|---|---|---|---|---|---|---|---|---|
| dehydrolithocholic acid | C24H38O3 | =O | −H | −H | −H | 373.27 | 205.5 | 0.121 | |
| 3,6-diketocholic acid | C24H36O4 | =O | =O | −H | −H | 387.25 | 200.9 | 0.223 | |
| dehydrodeoxycholic acid | C24H36O4 | =O | −H | −H | =O | 387.25 | 190.7 | 0.818 | |
| 3-oxo-12α-cholic acid | C24H38O4 | =O | −H | −H | α−OH | 389.27 | 200.8 | 0.027 | |
| 3,7,12-tri-betacholanic acid | C24H34O5 | =O | −H | =O | =O | 401.23 | 192.4 | 0.049 | |
| 7,12-dioxolithocholic acid | C24H36O5 | −OH | −H | =O | =O | 403.25 | 190.3 | 0.188 | |
| 7-ketodeoxvcholic acid | C24H38O5 | α−OH | −H | =O | α−OH | 405.26 | 204.2 | 0.044 | |
| aoocholic acid | C24H38O4 | α−OH | −H | −H | α−OH | 389.27 | 189.1 | 0.246 | |
| 7α, 12α, dihydroxy-5β-cholanic acid | C24H40O4 | −H | −H | α−OH | α−OH | 391.28 | 200.6 | 0.079 | |
| 3β, 7α, dihydroxy-5β-cholanic acid | C24H39DO4 | β−OH, α−D | −H | α−OH | −H | 392.29 | 202.7 | 0.043 | |
| lithocholic acid | C24H40O3 | α−OH | −H | −H | −H | 375.29 | 198.9 | 0.307 | |
| chenodeoxycholic acid | C24H40O4 | α−OH | −H | α−OH | −H | 391.28 | 202.3 | 0.079 | |
| hyodeoxycholic acid | C24H40O4 | α−OH | α−OH | −H | −H | 391.28 | 199.2 | 0.241 | |
| murideoxycholic acid | C24H40O4 | α−OH | β−OH | −H | −H | 391.28 | 200.3 | 0.241 | |
| ursodeoxycholic acid | C24H40O4 | α−OH | −H | β−OH | −H | 391.28 | 198.3 | 0.198 | |
| cholic acid | C24H40O5 | α−OH | −H | α−OH | α−OH | 407.28 | 202.9 | 0.146 | |
| hyocholic acid | C24H40O5 | α−OH | α−OH | α−OH | −H | 407.28 | 190.1 | 0.166 | |
| α-muricholic acid | C24H40O5 | α−OH | β−OH | α−OH | −H | 407.28 | 192.4 | 0.120 | |
| β-muricholic acid | C24H40O5 | α−OH | β−OH | β−OH | −H | 407.28 | 190.8 | 0.075 | |
| glycolithocholic acid | C26H43NO4 | α−OH | −H | −H | −H | 432.31 | 199.5 | 0.097 | |
| glycodeoxycholic acid | C26H43NO5 | α−OH | −H | −H | α−OH | 448.31 | 199.9 | 0.079 | |
| glycoursodeoxycholic acid | C26H43NO5 | α−OH | −H | β−OH | −H | 448.31 | 201.1 | 0.062 | |
| glycocholic acid | C26H43NO6 | α−OH | −H | α−OH | α−OH | 464.30 | 202.2 | 0.041 | |
| taurolithocholic acid | C26H45NO5S | α−OH | −H | −H | −H | 482.29 | 206.4 | 0.062 | |
| taurochenodeoxycholic acid | C26H45NO6S | α−OH | −H | α−OH | −H | 498.29 | 207.2 | 0.080 | |
| taurohyodeoxycholic acid | C26H45NO6S | α−OH | α−OH | −H | −H | 498.29 | 206.3 | 0.087 | |
| tauroursodeoxycholic acid | C26H45NO6S | α−OH | −H | β−OH | −H | 498.29 | 207.6 | 0.061 | |
| taurocholic acid | C26H45NO7S | α−OH | −H | α−OH | α−OH | 514.28 | 207.6 | 0.079 | |
| taurohyocholic acid | C26H45NO7S | α−OH | α−OH | α−OH | −H | 514.28 | 208.4 | 0.083 | |
| tauro-α-muricholic acid | C26H45NO7S | α−OH | β−OH | α−OH | −H | 514.28 | 209.4 | 0.067 | |
| tauro-β-muricholic acid | C26H45NO7S | α−OH | β−OH | β−OH | −H | 514.28 | 209.5 | 0.115 | |
| tauro-ω-muricholic acid | C26H45NO7S | α−OH | α−OH | β−OH | −H | 514.28 | 209.3 | 0.297 |
Bile acids are grouped by subclass, and entries within each subclass are sorted by increasing m/z ratio. Structural nomenclature and composition of the R groups are displayed in the table along with chemical formula and m/z. Numeration of the R groups refers to positions shown in Figure 1. At each R position, the substituent was either hydrogen (−H), alpha or beta hydroxyl (α- or β-OH), or doubly bonded oxygen (=O). Precision is reported as relative standard deviation (%RSD) for n = 3 measurements made on three separate days. The subclasses are color coded in the leftmost column, with grey representing oxidized bile acids, yellow representing unsaturated bile acids, purple representing atypical bile acids, blue representing unconjugated bile acids, orange representing glycine conjugated bile acids, and green representing taurine conjugated bile acids. Values for ion forms observed in positive ionization mode are reported in the accompanying Supplemental Information (Table S1). Additional measurements taken in negative ionization mode are reported in Tables S2 and S3.
Figure 3.
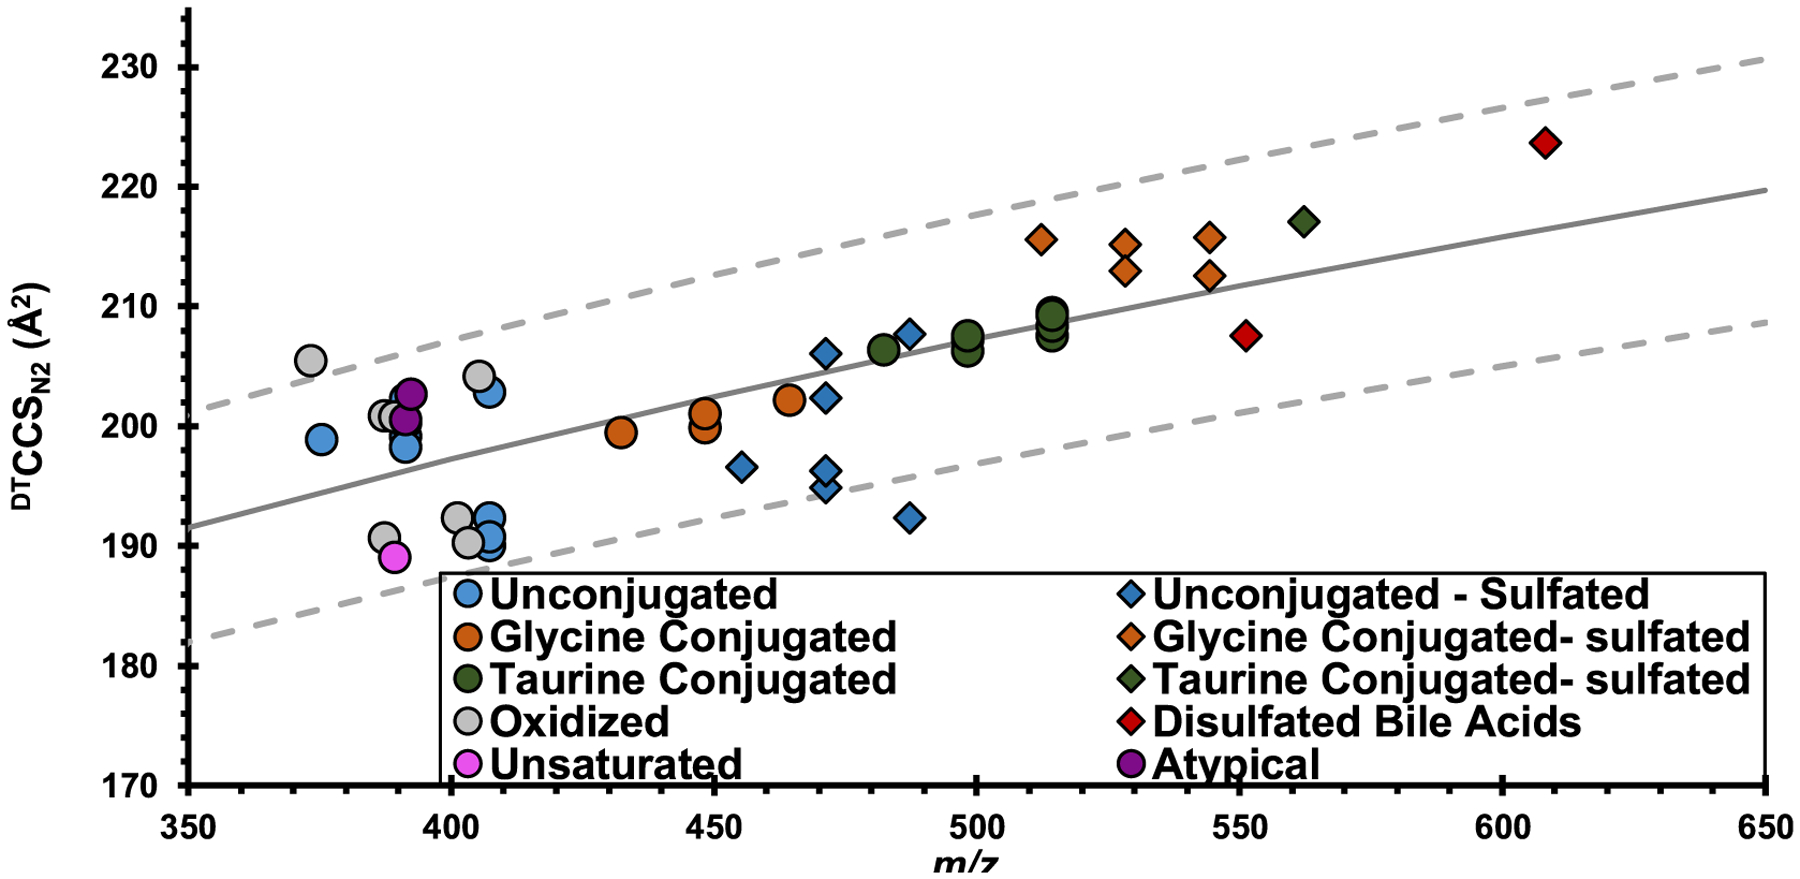
Conformational space DTCCSN2 vs m/z plot of the [M − H]− ion of 47 bile acid standards in negative ionization mode. Marker color indicates the bile acid subclass. Unsulfonated bile acids are represented by circles, while sulfonated bile acids are denoted by diamonds. The solid gray line represents the bile acid trendline for all species, and the dotted lines depict the bounds of the 95% confidence interval. All but two bile acids values fell within this correlation, regardless of conjugation and sulfonation.
Using the DTCCSN2 values reported here, we can create correlations similar to those used by Picache et al. in the Unified CCS Compendium by mapping expected mobility–mass space for bile acids.11 Using these data, a correlation is plotted using a power fit. This correlation is representative of bile acids and bile acid conjugates. By reporting a bile acid correlation (Figure 3) and utilizing it to compare predicted and experimental CCS values in future studies, we can increase the confidence in bile acid annotations. Nearly all values fall within 5% of the calculated correlation, with the only exceptions being dehydrolithocholic acid and cholic acid 3-sulfate. Additionally, fits can be applied to individual bile acid subclasses, as shown in Figure S3, although the sample numbers may not currently be sufficient to accurately represent individual subclass trends.
Bile acids conjugated with glycine, in comparison to unconjugated molecules, did not exhibit the same increase in DTCCSN2 with m/z as the overall bile acid trend. While glycine conjugated values still fell within the confidence interval, the DTCCSN2 values were similar to those of unconjugated bile acids (average increase of 0.60%, or ca. 1 Å2), despite the 57 Da mass increase, indicating an interaction of glycine with the oxygen bound to carbon 3. Figure 4 shows molecular models of cholic acid and glycocholic acid. The fused ring sterol core common to these bile acids has no rotational freedom; therefore, it is the tail group that introduces variability in CCS. With glycocholic acid, the glycine tail is locked in a hydrogen bond with the oxygen on carbon 3 (Figure 4B), similar to that seen in cholic acid (Figure 4A). This interaction prevents the tail from freely rotating and results in a more compact structure than that observed for bile acids with unconstrained tails.
Figure 4.
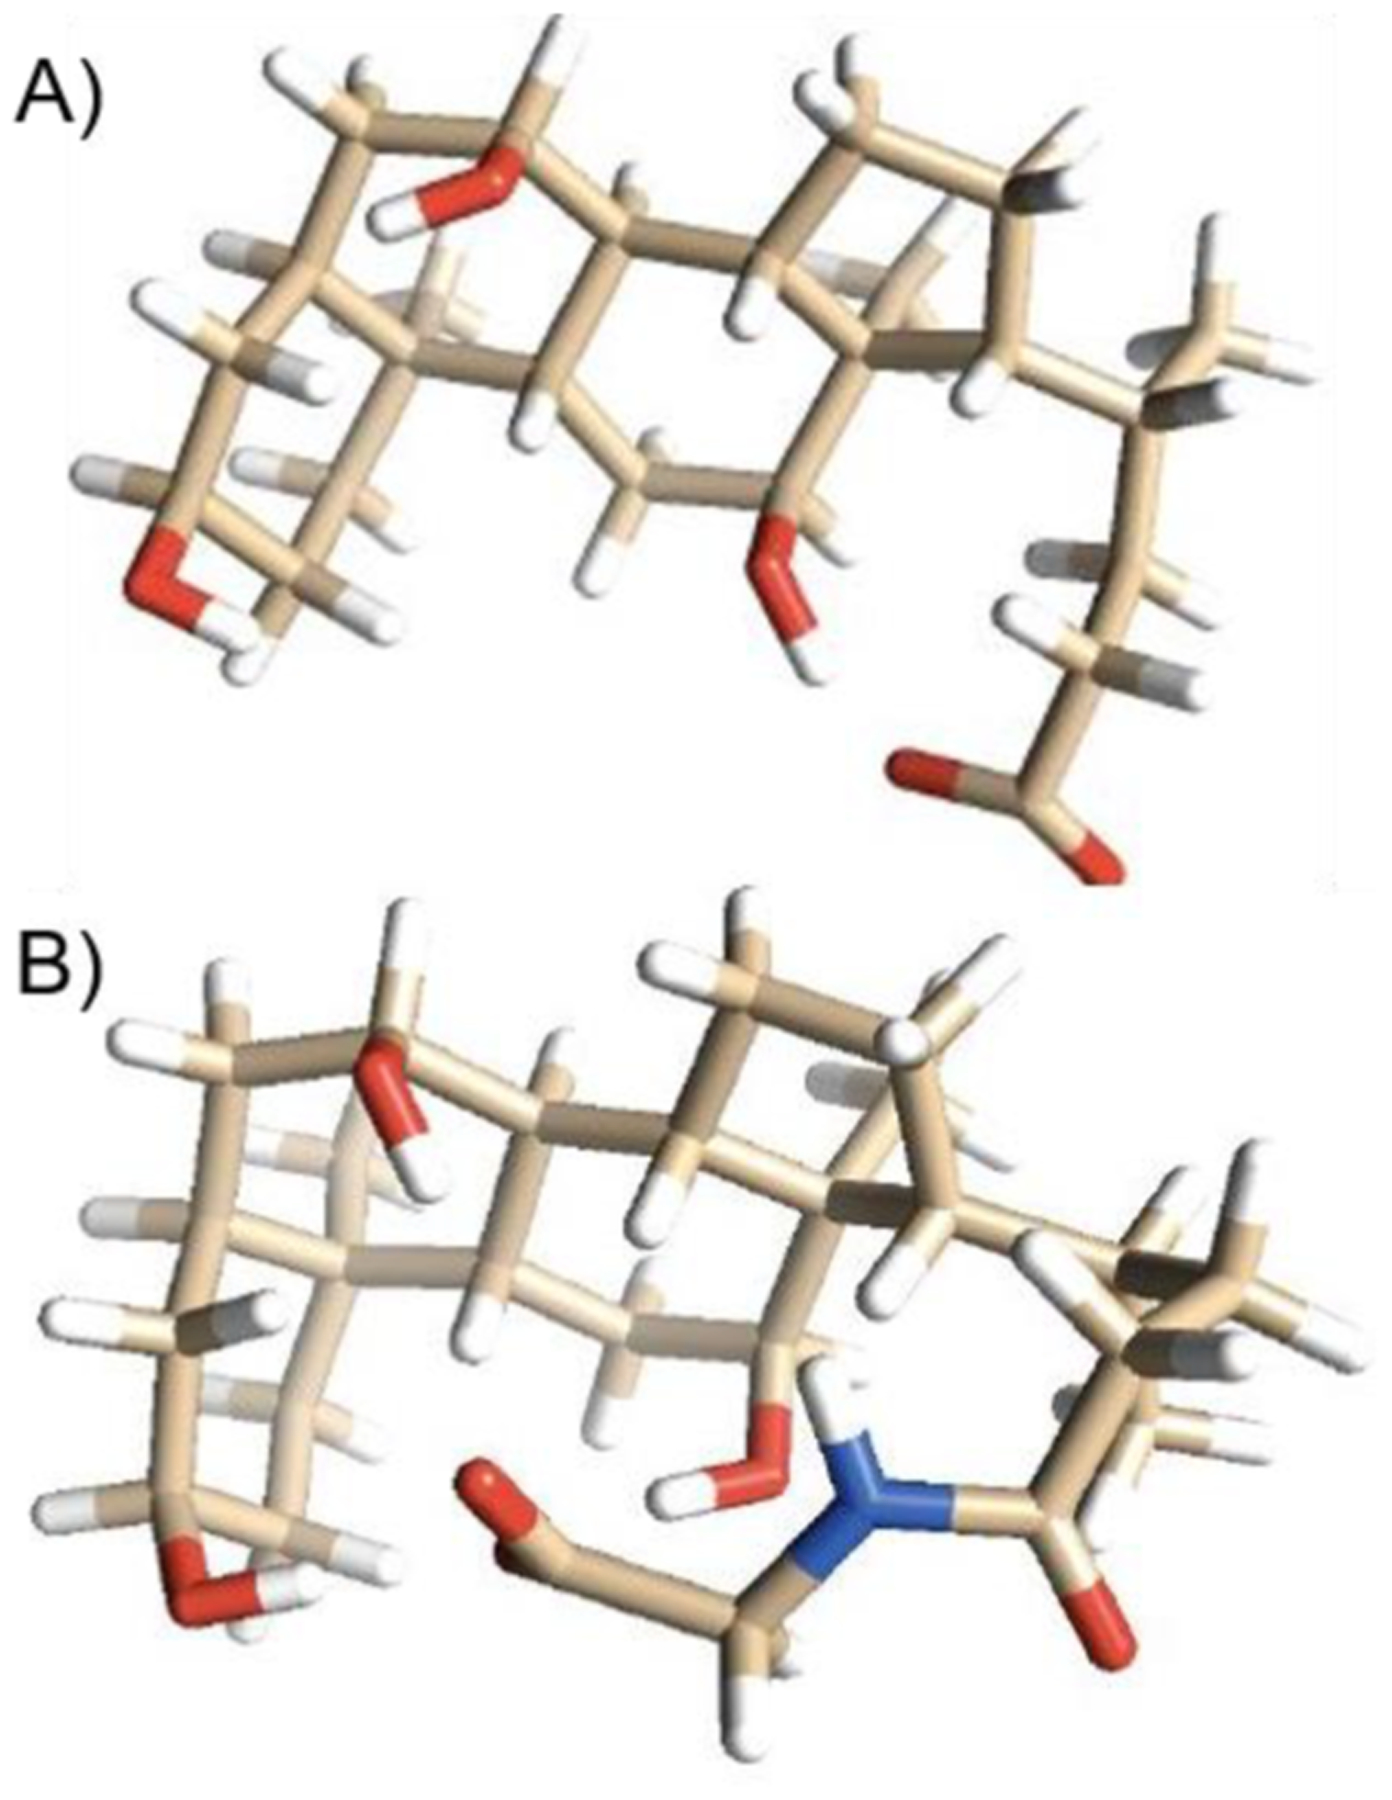
Stick models of (A) cholic acid and (B) glycocholic acid. The sterol ring structure is the same in both cholic acid and glycocholic acid. The tail structure and its interactions with the core affect the cross section. (A) With cholic acid, the tail forms a hydrogen bond with the oxygen on carbon 3. This is similar in (B) glycocholic acid, where the tail structure folds over to form a hydrogen bond with the same oxygen on carbon 3, stabilizing the tail and limiting its motion. Even though glycocholic acid is 57 Da greater in mass, it has a similar collision cross section because it forms a hydrogen bond on the same carbon (carbon 3), collapsing the tail. Colors represent atoms, with beige representing carbon, red representing oxygen, blue representing nitrogen, and white representing hydrogen.
This tail-oxygen–hydrogen bond is likely also the cause of the increase in collision cross section observed with the oxidation. As double bonds are introduced, the m/z decreases by 2, 4, and 6 nominal mass units (corresponding to 1, 2, and 3 double bonds, respectively). Even though m/z decreases with increased unsaturation, the DTCCSN2 value was observed to increase. This may be due to the tail being unable to form a hydrogen bond with the oxygen on carbon 3. Figure 5 highlights two pairs of molecules that differ only in the presence of a double bond: (1) lithocholic acid and dehydrolithocholic acid and (2) cholic acid and 7-ketodeoxycholic acid. This increase in DTCCSN2 may be the result of the change in a ring carbon’s hybridization. The hydrogen bond that exists between the hydroxyl group on carbon 3 and the tail can be disrupted by rehybridization of that particular carbon. It changes the position of the attached oxygen, preventing it from being able to form a hydrogen bond with the carboxyl tail.
Figure 5.
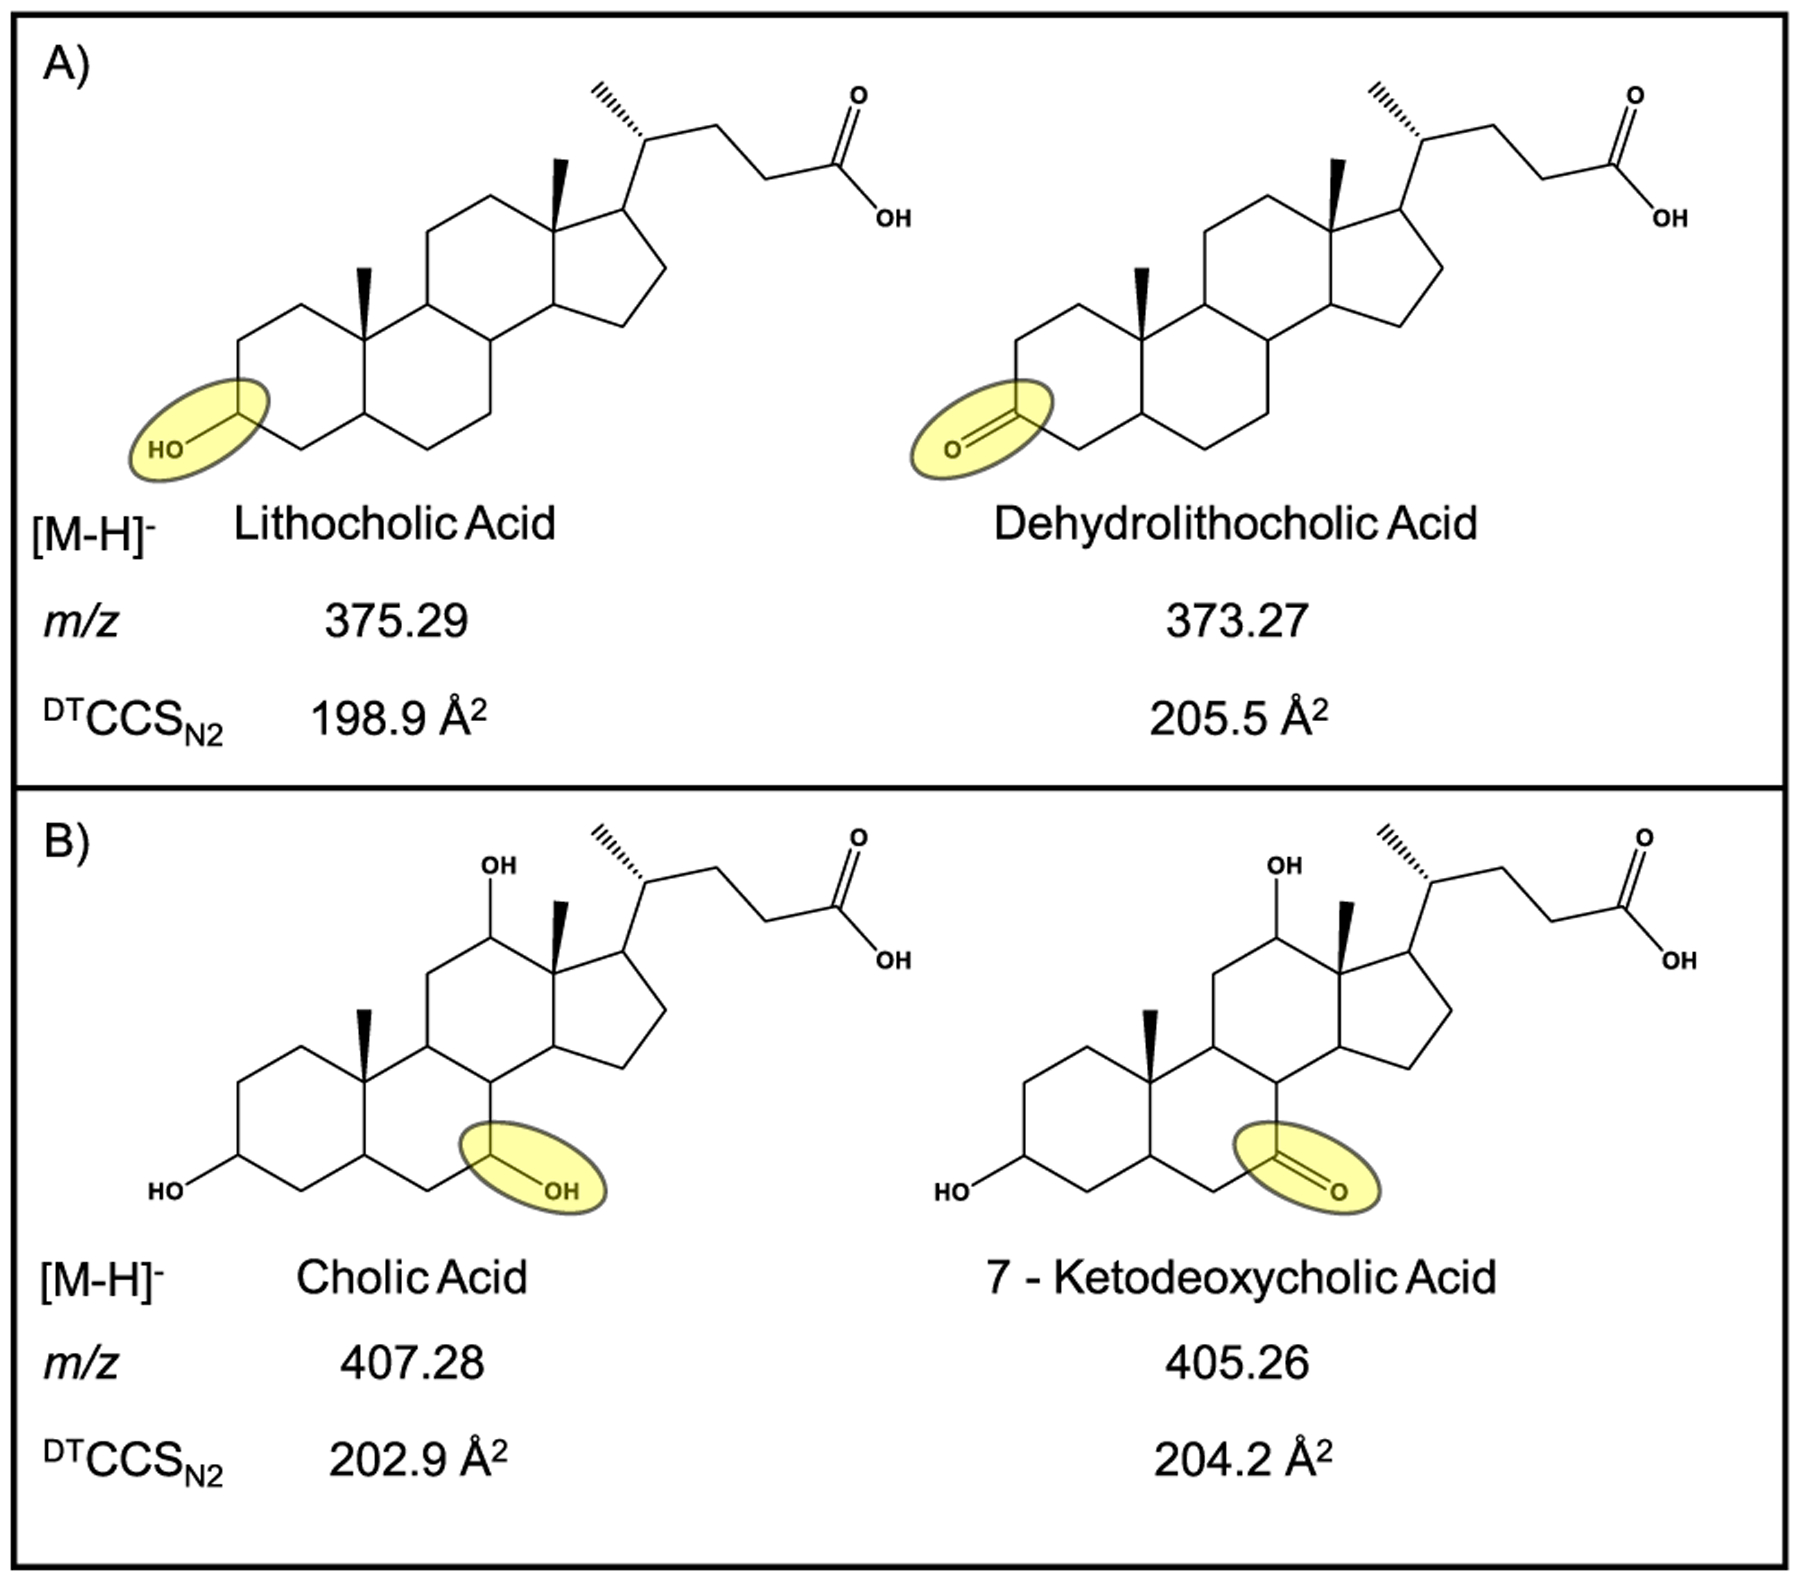
Comparison of (A) lithocholic acid with dehydrolithocholic acid and (B) cholic acid with 7-ketodeoxycholic acid. The difference between each pair is highlighted in yellow. The addition of the double bond removes two hydrogens, reducing the m/z ratio; however, the experimental DTCCSN2 was observed to increase with this change.
The reported DTCCSN2 vs m/z [M − H]− bile acid trendline was used to evaluate previously published untargeted metabolomic data from stool samples of mice that had biliary diversion surgery.21 Among many other biological classes, bile acids were of particular interest in the previous study. In addition to the 10 bile acids previously reported,21 here we were able to select 20 additional potential bile acids based on the described trendline (Figure S4). Those 20 molecules were not previously included as molecules with bile acid motifs and remained unidentified molecules. These data demonstrate the utility of the reported DTCCSN2 values for the annotation and identification of metabolites in global, untargeted data sets.
CONCLUSION
Bile acids provide a crucial role in digestion and metabolism. To improve the accurate annotation of these molecules, we report DTCCSN2 values of the various observed ion forms of a large set of bile acids. In-depth analysis of DTCCSN2 subclass correlations affords a glimpse into the structural changes that allow separation via ion mobility. The subset of bile acids analyzed here provides a step forward for discrimination of these molecules in untargeted metabolomic studies.
Supplementary Material
ACKNOWLEDGMENTS
J.C.P. would like to thank the Fisk-Vanderbilt Master’s to PhD Bridge program for financial support and Dr. Dina Stroud for her support. The authors would like to thank Rachel A. Harris, Emanuel Zlibut, and Seth K. Gregory for their support and contributions. This work was supported in part using the resources of the Center for Innovative Technology at Vanderbilt University.
Funding
Financial support for aspects of this research was provided by the National Institutes of Health (Grants R01DK105847 and R03CA222452).
Footnotes
Supporting Information
The Supporting Information is available free of charge at https://pubs.acs.org/doi/10.1021/jasms.0c00015.
Arrival time distributions of four β-muricholic acid ion forms (Figure S1a) and comparative arrival times of distributions for chenodeoxycholic acid and ursodeoxycholic acid (Figure S1b). Figure S2 shows three examples of ion mobility–mass spectrometry spectra with potential metastable adduct behavior. Figure S3 shows the trendlines for three bile acid subclasses. Figure S4 shows how previously unidentified features from a metabolomics sample fall on the bile acid trendline. In addition, we include tables of all measured bile acids and their drift tube collision cross section values measured in nitrogen (DTCCSN2) in both positive and negative ionization mode (Tables S1–S3) (PDF).
Complete contact information is available at: https://pubs.acs.org/10.1021/jasms.0c00015
The authors declare no competing financial interest.
Contributor Information
James C. Poland, Center for Innovative Technology, Department of Chemistry, Institute of Chemical Biology, Institute for Integrative Biosystems Research and Education, Vanderbilt-Ingram Cancer Center, Vanderbilt University, Nashville, Tennessee 37235, United States;.
Katrina L. Leaptrot, Center for Innovative Technology, Department of Chemistry, Institute of Chemical Biology, Institute for Integrative Biosystems Research and Education, Vanderbilt-Ingram Cancer Center, Vanderbilt University, Nashville, Tennessee 37235, United States;.
Stacy D. Sherrod, Center for Innovative Technology, Department of Chemistry, Institute of Chemical Biology, Institute for Integrative Biosystems Research and Education, Vanderbilt-Ingram Cancer Center, Vanderbilt University, Nashville, Tennessee 37235, United States;.
Charles Robb Flynn, Department of Surgery, Vanderbilt University Medical Center, Nashville, Tennessee 37235, United States.
John A. McLean, Center for Innovative Technology, Department of Chemistry, Institute of Chemical Biology, Institute for Integrative Biosystems Research and Education, Vanderbilt-Ingram Cancer Center, Vanderbilt University, Nashville, Tennessee 37235, United States;.
REFERENCES
- (1).Li T; Chiang JYL Bile acids as metabolic regulators. Curr. Opin. Gastroenterol 2015, 31 (2), 159–165. [DOI] [PMC free article] [PubMed] [Google Scholar]
- (2).Hylemon PB; Zhou H; Pandak WM; Ren S; Gil G; Dent P Bile acid as regulatory molecules. J. Lipid Res 2009, 50, 1509–1520. [DOI] [PMC free article] [PubMed] [Google Scholar]
- (3).Hofmann AF; Sjövall J; Kurz G; Radominska A; Schteingart CD; Tint GS; Vlahcevic R; Setchell KDR A proposed nomenclature for bile acids. J. Lipid Res 1992, 33, 599–604. [PubMed] [Google Scholar]
- (4).Ajouz H; Mukherji D; Shamseddine A Secondary bile acids: an underrecognized cause of colon cancer. World Journal of Surgical Oncology 2014, 12, 164. [DOI] [PMC free article] [PubMed] [Google Scholar]
- (5).Jovanovich A; Isakova T; Block G; Stubbs J; Smits G; Chonchol M; Miyazaki M Deoxycholic acid, a metabolite of circulating bile acids, and coronary artery vascular calcification in CKD. Am. J. Kidney Dis 2018, 71 (1), 27–34. [DOI] [PMC free article] [PubMed] [Google Scholar]
- (6).Griffiths WJ; Sjövall J Bile acids: analysis in biological fluids and tissues. J. Lipid Res 2010, 51, 23–41. [DOI] [PMC free article] [PubMed] [Google Scholar]
- (7).Zheng X; Aly NA; Zhou Y; Dupuis KT; Bilbao A; Paurus VL; Orton DJ; Wilson R; Payne SH; Smith RD; Baker ES A structural examination and collision cross section database for over 500 metabolites and xenobiotics using drift tube ion mobility spectrometry. Chem. Sci 2017, 8, 7724–7736. [DOI] [PMC free article] [PubMed] [Google Scholar]
- (8).Zheng X; Smith FB; Aly NA; Cai J; Smith RD; Patterson AD; Baker ES Evaluating the structural complexity of isomeric bile acids with ion mobility spectrometry. Anal. Bioanal. Chem 2019, 411, 4673–4682. [DOI] [PMC free article] [PubMed] [Google Scholar]
- (9).Ridlon JM; Kang DJ; Hylemon PB; Bajaj JS Bile acids and the gut microbiome. Curr. Opin. Gastroenterol 2014, 30 (3), 332–338. [DOI] [PMC free article] [PubMed] [Google Scholar]
- (10).Quinn RA; Melnik AV; Vrbanac A; et al. Global chemical effects of the microbiome include new bile-acid conjugations. Nature 2020, 579, 123–129. [DOI] [PMC free article] [PubMed] [Google Scholar]
- (11).Picache JA; Rose BS; Balinski A; Leaptrot KL; Sherrod SD; May JC; McLean JA Collision cross section compendium to annotate and predict multi-omic compound identities. Chem. Sci 2019, 10, 983–993. [DOI] [PMC free article] [PubMed] [Google Scholar]
- (12).Fenn LS; McLean JA Biomolecular structural separations by ion mobility–mass spectrometry. Anal. Bioanal. Chem 2008, 391, 905–909. [DOI] [PubMed] [Google Scholar]
- (13).McLean JA The mass-mobility correlation redux: the conformational landscape of anhydrous biomolecules. J. Am. Soc. Mass Spectrom 2009, 20, 1775–1781. [DOI] [PubMed] [Google Scholar]
- (14).Fenn LS; Kliman M; Mahsut A; Zhao SR; McLean JA Characterizing ion mobility-mass spectrometry conformation space for the analysis of complex biological samples. Anal. Bioanal. Chem 2009, 394, 235–244. [DOI] [PMC free article] [PubMed] [Google Scholar]
- (15).Paglia G; Angel P; Williams JP; Richardson K; Olivos HJ; Thompson JW; Menikarachchi L; Lai S; Walsh C; Moseley A; Plumb RS; Grant DF; Palsson BO; Langridge J; Geromanos S; Astarita G Ion Mobility-Derived Collision Cross Section As an Additional Measure for Lipid Fingerprinting and Identification. Anal. Chem 2015, 87 (2), 1137–1144. [DOI] [PMC free article] [PubMed] [Google Scholar]
- (16).May JC; Goodwin CR; McLean JA Ion mobility-mass spectrometry strategies for untargeted systems, synthetic, and chemical biology. Curr. Opin. Biotechnol 2015, 31, 117–121. [DOI] [PMC free article] [PubMed] [Google Scholar]
- (17).Schrimpe-Rutledge AC; Codreanu SG; Sherrod SD; McLean JA Untargeted metabolomics strategies: challenges and emerging directions. J. Am. Soc. Mass Spectrom 2016, 27, 1897–1905. [DOI] [PMC free article] [PubMed] [Google Scholar]
- (18).May JC; Gant-Branum RL; McLean JA Targeting the untargeted in molecular phenomics with structural mass spectrometry. Curr. Opin. Biotechnol 2016, 39, 192–197. [DOI] [PMC free article] [PubMed] [Google Scholar]
- (19).Sherrod SD; McLean JA Systems-wide high-dimensional data acquisition and informatics using structural mass spectrometry strategies. Clin. Chem 2016, 62, 77–83. [DOI] [PMC free article] [PubMed] [Google Scholar]
- (20).Nichols CM; Dodds JN; Rose BS; Picache JA; Morris CB; Codreanu SG; May JC; Sherrod SD; Mclean JA Untargeted discovery in primary metabolism: collision cross section as a molecular descriptor in ion mobility-mass spectrometry. Anal. Chem 2018, 90 (24), 14484–14492. [DOI] [PMC free article] [PubMed] [Google Scholar]
- (21).Poland JC; Schrimpe-Rutledge AC; Sherrod SD; Flynn CR; McLean JA Utilizing untargeted ion mobility-mass spectrometry to profile changes in the gut metabolome following biliary diversion surgery. Anal. Chem 2019, 91, 14417–14423. [DOI] [PMC free article] [PubMed] [Google Scholar]
- (22).Stow SM; Causon TJ; Zheng X; Kurulugama RT; Mairinger T; May JC; Rennie EE; Baker ES; Smith RD; McLean JA; Hann S; Fjeldsted JC An Interlaboratory Evaluation of Drift Tube Ion Mobility-Mass Spectrometry Collision Cross Section Measurements. Anal. Chem 2017, 89, 9048–9055. [DOI] [PMC free article] [PubMed] [Google Scholar]
- (23).Nichols CM; May JC; Sherrod SD; McLean JA Automated flow injection method for the high precision determination of drift tube ion mobility collision cross sections. Analyst 2018, 143, 1556–1559. [DOI] [PMC free article] [PubMed] [Google Scholar]
Associated Data
This section collects any data citations, data availability statements, or supplementary materials included in this article.


