Abstract
We have systematically characterized the degradation of imaging quality with depth in deep brain multi-photon microscopy, utilizing our recently developed numerical model that computes wave propagation in scattering media. The signal-to-background ratio (SBR) and the resolution determined by the width of the point spread function are obtained as functions of depth. We compare the imaging quality of two-photon (2PM), three-photon (3PM), and non-degenerate two-photon microscopy (ND-2PM) for mouse brain imaging. We show that the imaging depth of 2PM and ND-2PM are fundamentally limited by the SBR, while the SBR remains approximately invariant with imaging depth for 3PM. Instead, the imaging depth of 3PM is limited by the degradation of the resolution, if there is sufficient laser power to maintain the signal level at large depth. The roles of the concentration of dye molecules, the numerical aperture of the input light, the anisotropy factor g, noise level, input laser power, and the effect of temporal broadening are also discussed.
Multi-photon microscopy (MPM) has become an indispensable tool for deep brain imaging with cellular or sub-cellular resolution [1–4]. The imaging depth of two-photon (2PM) and three-photon microscopy (3PM) for in vivo mouse brain imaging can commonly reach ~500 μm and ~1300 μm, respectively. Recently, a new type of MPM, non-degenerate 2PM (ND-2PM), has been developed, which excites fluorophores with two spatially displaced laser beams of different wavelengths [5–7]. ND-2PM has been demonstrated to potentially provide an improved signal-to-background ratio (SBR) compared to 2PM, while still maintaining a high excitation efficiency compared to 3PM. Ultimately, the imaging quality of all of these methods is subject to light scattering from the biological tissue being studied. Quantitative evaluation of the performance of these techniques for brain imaging will provide useful guidance for future experimental designs, and may inspire the development of refined methods that can further increase the imaging depth limit of MPM.
The imaging quality of MPM can be well described by the SBR and the resolution. Here we assume the effect of noise is lower than that from the SBR. A seminal work that analytically estimates the imaging depth limit for 2PM concluded that the imaging depth is ultimately limited by the near-surface background fluorescence [8]. However, although it is the SBR that sets the 2PM imaging depth limit, the loss of ballistic signal with depth due to light scattering is much faster than the potential increase of background fluorescence due to excitation. This suggests the utility of methods for reducing the effect of scattering, such as using longer excitation wavelengths [9], and wavefront engineering techniques to compensate for the scattering effect [10]. There are pioneering studies that compare the two-photon and three-photon image quality [11,12]. But the fundamental imaging depth limit has not been systematically quantified and compared for the three types of systems.
We use our recently developed numerical model based on the beam propagation method (BPM) [13,14] to compute the point spread function (PSF) and SBR for 2PM, 3PM, and ND-2PM as would be applicable for mouse brain imaging. BPM is a wave-picture method that captures speckle features arising from wave interference, which are not included in the particle-picture-based methods such as Monte–Carlo simulations, and the above-mentioned analytical analysis [8]. We find that the degradation of the SBR fundamentally limits the imaging depth for 2PM and ND-2PM, while for 3PM, the SBR remains invariant with depth. If the laser power is sufficient, the degradation of the resolution is the primary factor that limits the imaging depth in 3PM. Other factors such as the numerical aperture (NA), anisotropy factor g, noise level, and temporal spreading due to scattering are also discussed. The illustration of the three types of MPM techniques and the numerical model is shown in Fig. 1. The MATLAB code of the model is publicly available at [15].
Fig. 1.
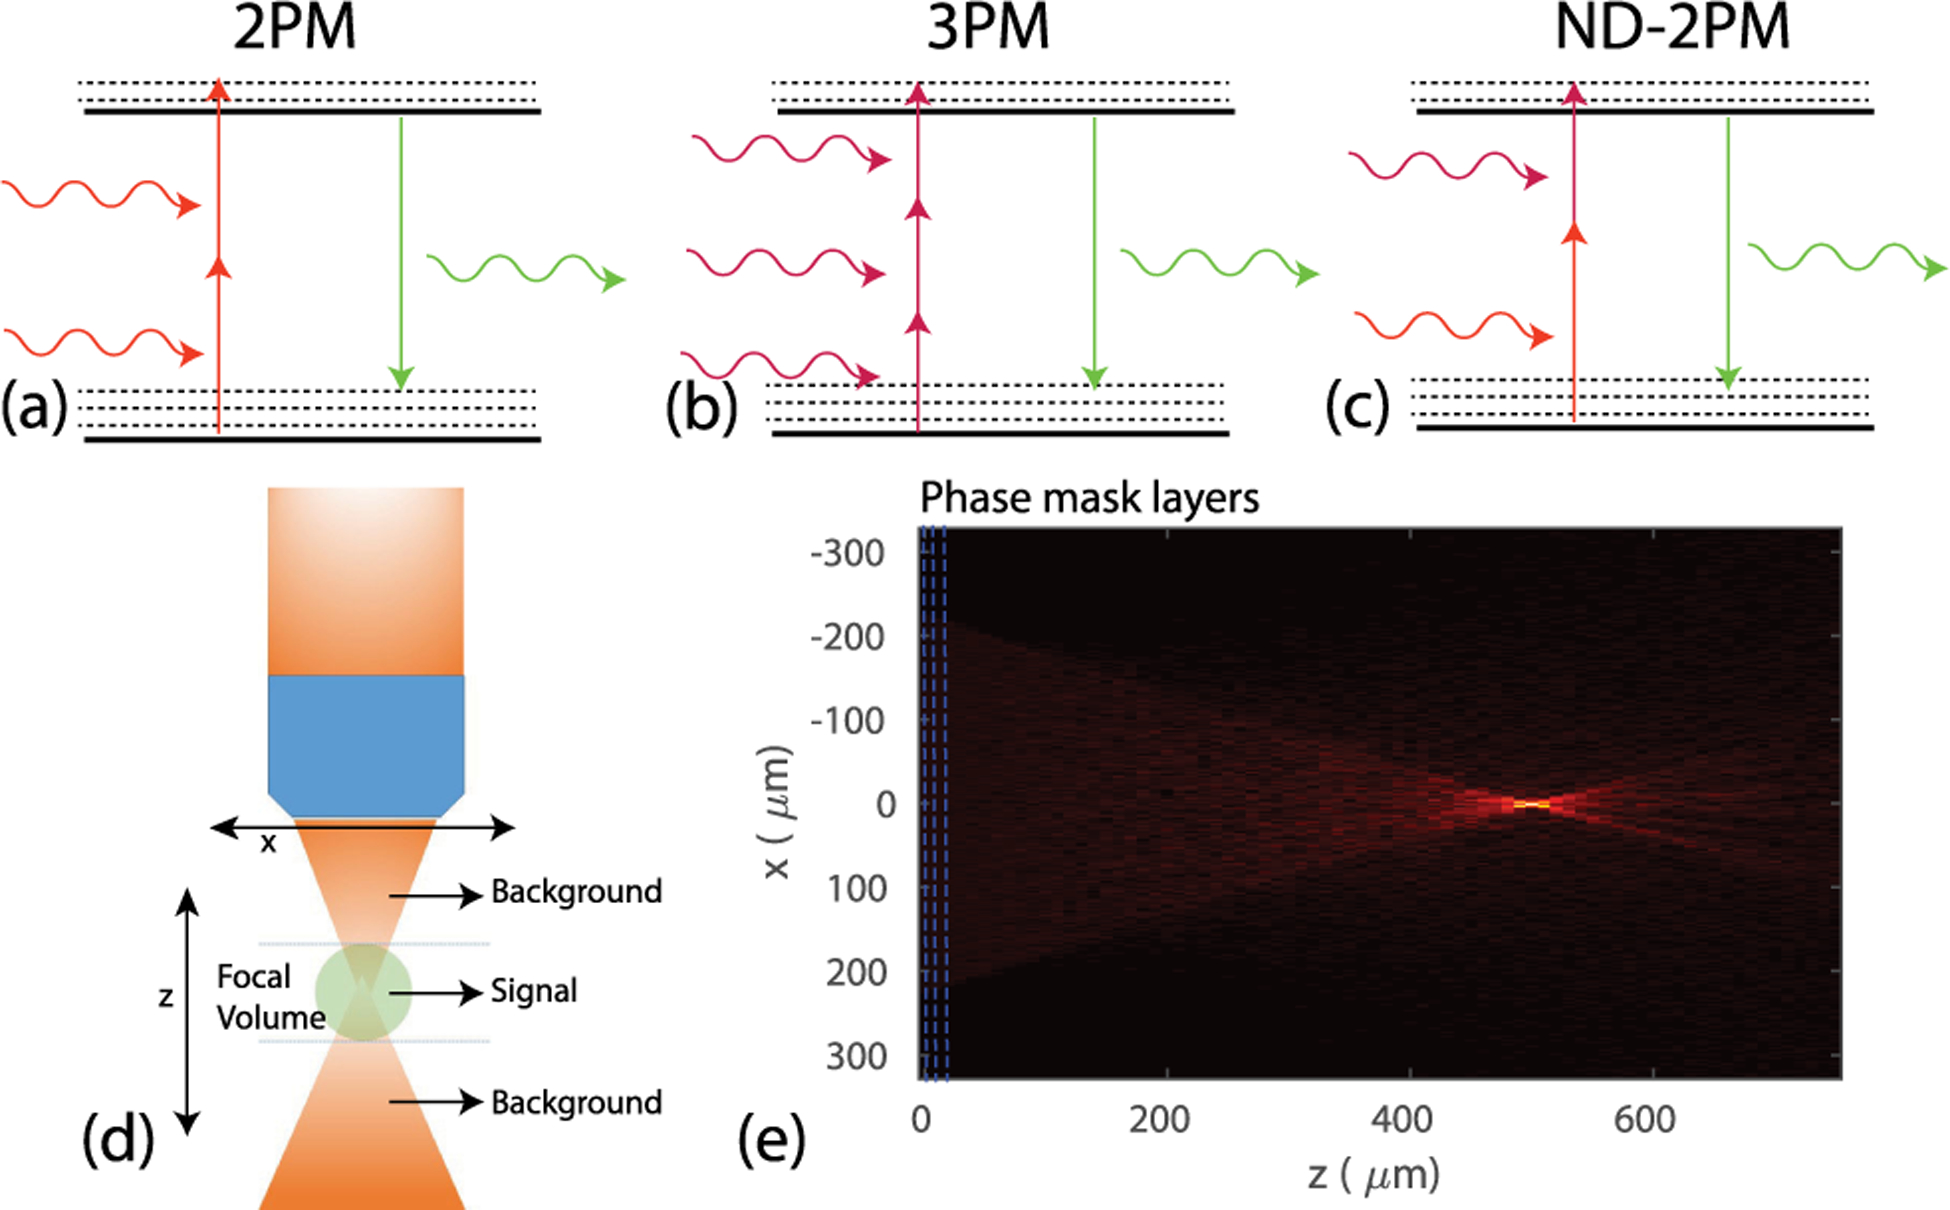
Illustration of photon absorption and emission for (a) two-photon microscopy (2PM), (b) three-photon microscopy (3PM), and (c) non-degenerate two-photon microscopy (ND-2PM). (d) Illustration of the calculation of the signal and background fluorescence. The signal is the integrated fluorescence intensity within the depth range containing the focal volume, as defined by the axial width of the PSF. The background fluorescence is the integration within the depths outside of the focal volume. (e) Example of the amplitude distribution of the excitation wave in the xz cross section obtained using our BPM model. Here NA = 0.6, n = 1.33, zf = 500 μm, wavelength λ = 1200 nm, ℓs = 264 μm, and g = 0.9.
To quantify the imaging quality in MPM, both the resolution and the SBR need to be considered. The lateral and axial resolutions are defined as the lateral and axial full width half maximum (FWHM) of the PSF, respectively. The conventional way to calculate the SBR is to obtain the signal as the integration of the fluorescence intensity within the focal volume, and the background as the integration over the out-of-focus volume [8,16]. One way to define the focal volume is to consider the space from zf − zr to zf + zr, where zf is the focal depth, and zr is the Rayleigh range defined in the free space. However, in practice, the focal volume changes with the illumination geometry, imaging depth, and tissue scattering properties, and can be different for the three types of MPM systems. This definition thus would present problems for the quantitative analysis. To overcome this issue, we define the focal volume as spanning over the depth range defined by the axial FWHM of the calculated PSF under scattering, i.e., zf − FWHMaxial/2 to zf + FWHMaxial/2. The PSF width is obtained from the simulated light distribution under specific imaging conditions. Thus, the SBR is defined for the resolution that varies with imaging conditions, as desired.
When no scattering is present, an input Gaussian beam propagating along z maintains its analytical form , where w0 = λ/(πNA) is the beam waist at zf, , C is a constant, and is the Rayleigh range. When scattering is present and only ballistic light is assumed to contribute, the excitation light profile can be calculated analytically with the Gaussian profile weighted by an exponential decay factor , where ℓs is the scattering mean free path. Here we neglect the effect of absorption. The fluorescence intensity as a function of depth for 2PM and 3PM can be obtained by I2p(z) = C1 ∬ dxdy I2(x, y, z) and I3p(z) = C2 ∬ dxdy I3(x, y, z), respectively. The constants are set to be C1 = C2 = 1 without loss of generality. The total input power is set to be unity. We also assume that all the fluorescence can be collected. The fluorescence intensity profile I(z) for 2PM and 3PM using the no-scattering and ballistic-only models are compared in Fig. 2. The intensity level I(z) at the focus versus that in the superficial layers determines whether the background fluorescence overwhelms the signal. In 2PM, when no scattering is present, I(z) increases monotonically as z approaches zf [Fig. 2(a)]. Under this condition, the background fluorescence comes mainly from the regions close to the focal volume. When scattering is present and only ballistic light is considered, the fluorescence background from the superficial layers starts to dominate with increasing focal depth [Fig. 2(b)]. In 3PM, the fluorescence at zf is several orders of magnitude higher than that in the superficial layers [Fig. 2(c) and 2(d)]. As a result, the background fluorescence in both cases comes mainly from the regions close to the focal volume. Here I(z) for ND-2PM is not discussed since when multiple scattering is ignored and the two excitation beams are spatially separated, there is no fluorescence from the depths outside of the focal volume [7].
Fig. 2.
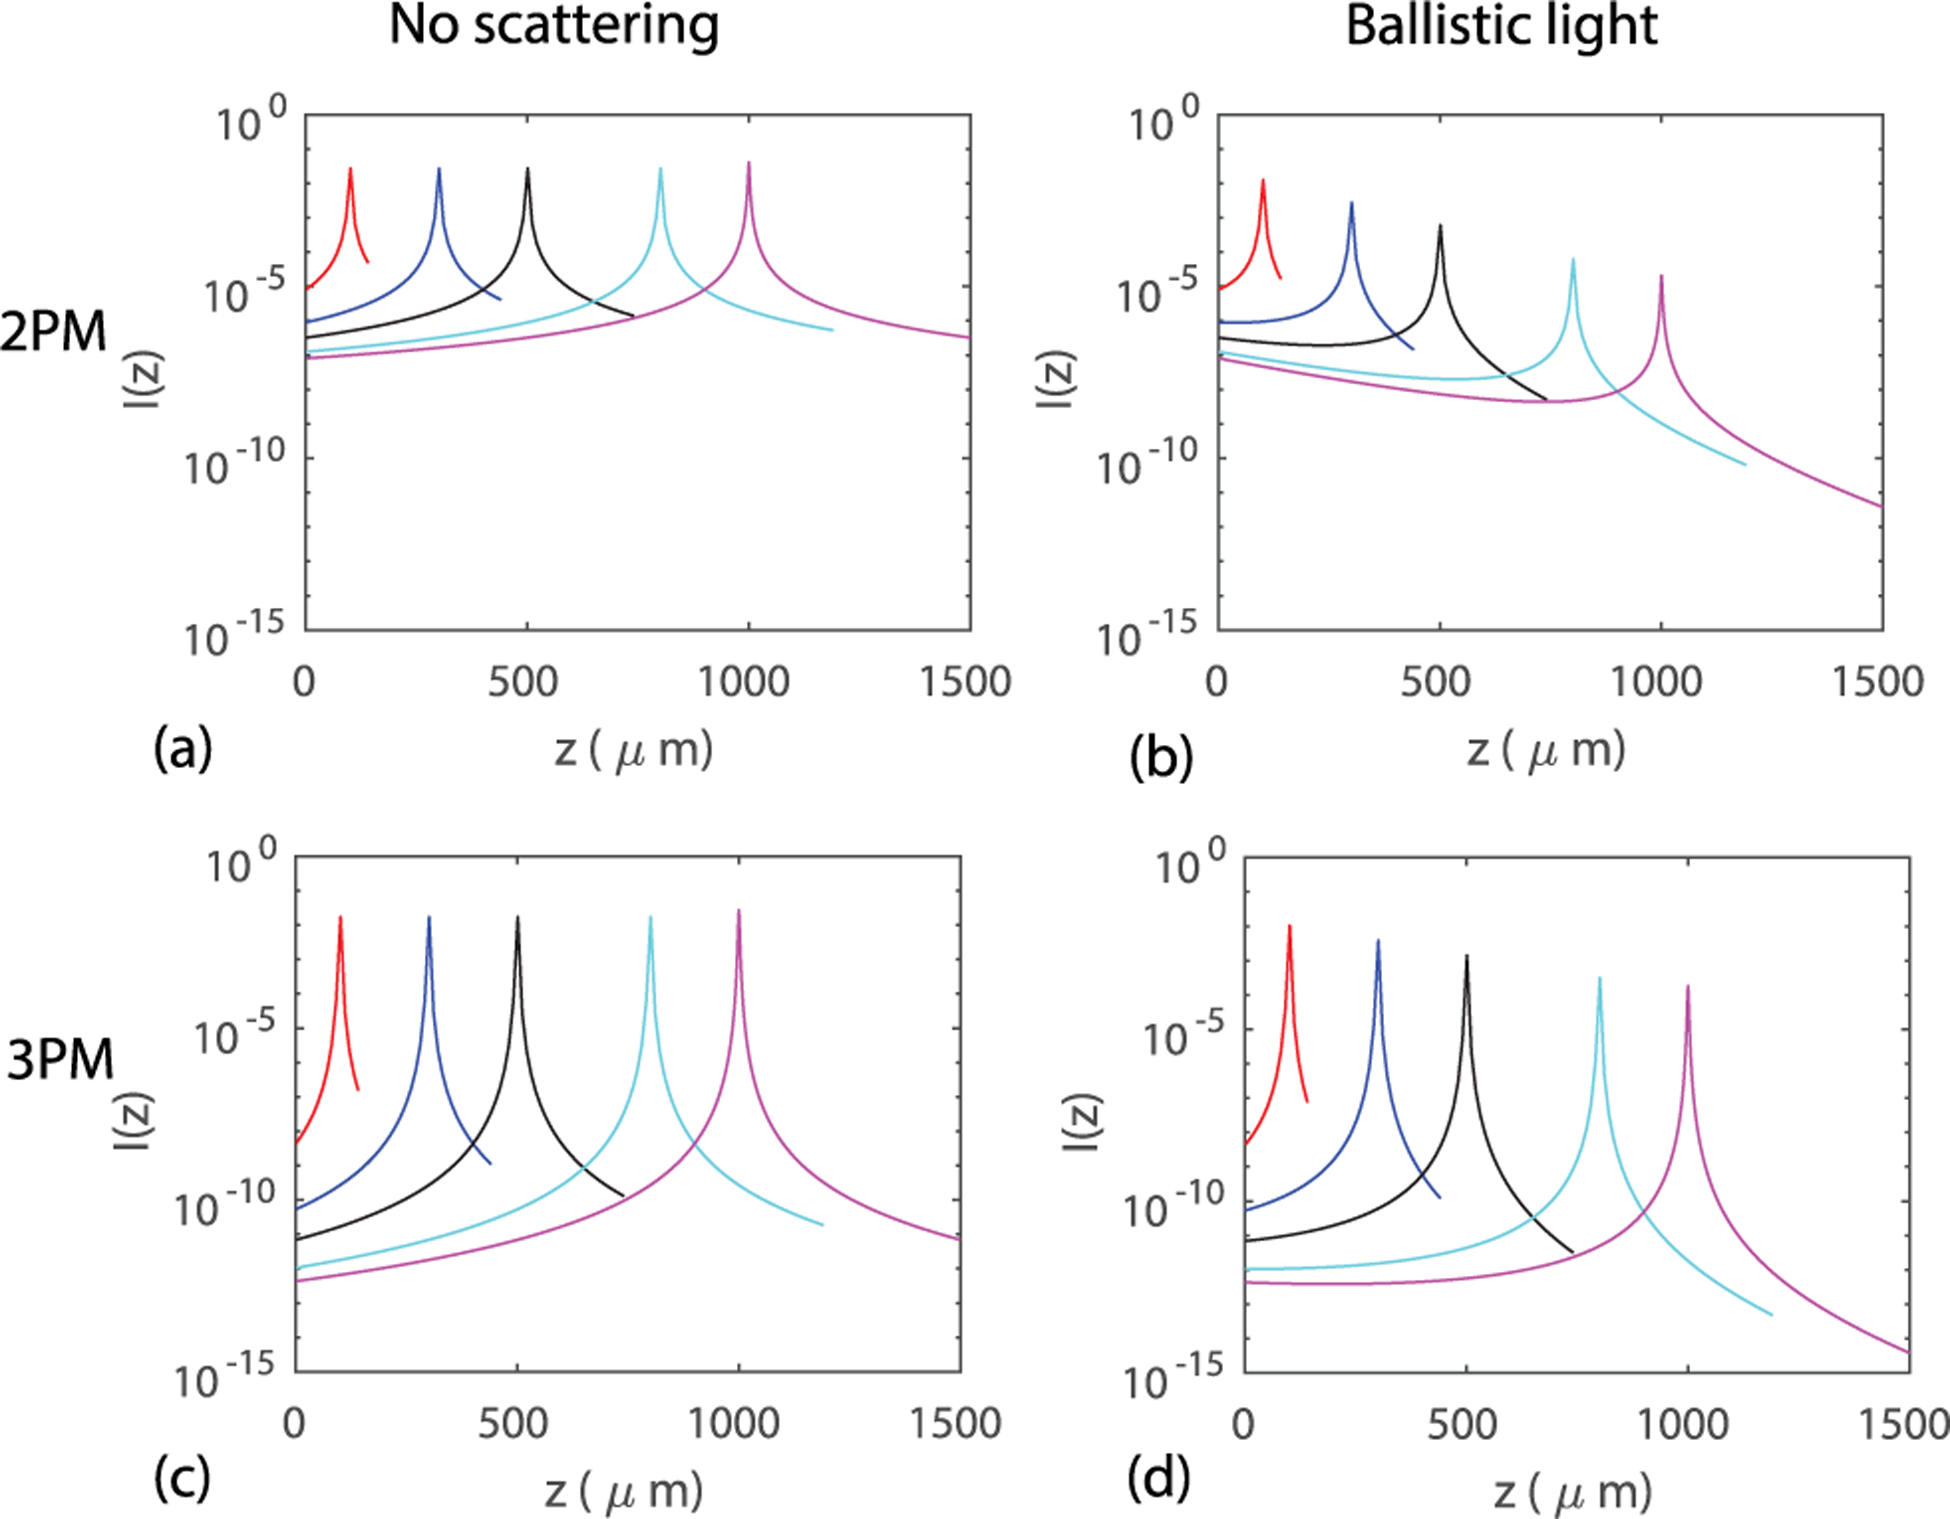
(a)–(b) Examples of the analytical predictions of I(z) for 2PM when (a) no scattering is present, and when (b) only ballistic light is considered. (c)–(d) Examples of I(z) for 3PM when (c) no scattering is considered, and when (d) only ballistic light is considered. Here NA = 0.6, ℓs = 264 μm, 400 μm for 2PM and 3PM, respectively. The focal depths are zf = 100, 300, 500, 800, 1000 μm.
To include the effect of multiply scattered light, we use our recently developed BPM model to calculate the amplitude and phase distribution of light in scattering media [14]. In this model, the scattering medium is modeled as a series of planar layers of random phase masks. At each phase mask plane, the local wavefront E(x, y, z) is multiplied by the spatially varying random phase term eiϕ(x,y). The seed phase at position (x, y) is drawn from a Gaussian distribution of zero mean and standard deviation σp. The seed phase profile is then convolved with a Gaussian profile with a width σx. The scattering mean free path is related to σp and the layer distance d by ; the scattering anisotropy factor g is determined by σx as described in [14]. The medium is assumed to be uniform between neighboring layers, and the evolution of the wavefront is calculated from the angular spectrum method [17]. Compared to other BPM-based models, the scattering mean free path ℓs, anisotropy factor g, layer distance of phase masks d, and pixel size can be freely adjusted, which is crucial for an accurate calculation of the PSF width and SBR. For 2PM and 3PM, the fluorescence light profiles are obtained as |E(x, y, z)|4 and |E(x, y, z)|6, respectively. For ND-2PM, the two beam profiles E1(x, y, z) and E2(x, y, z) are computed separately, and the fluorescence light profile is obtained as I(x, y, z) = |E1(x, y, z)|2 ·|E2(x, y, z)|2.
To compare the performance of different MPM techniques for mouse brain imaging, we use the same objective lens with NA = 0.6. The wavelengths used are 1200 nm for 2PM, 1700 nm for 3PM, and 1040 nm and 1300 nm for the two beams in ND-2PM. The values of the scattering mean free path for the mouse brain tissue at different wavelengths are estimated from [18], which are ℓs = 264, 400, 198, 310 μm for wavelengths λ = 1200, 1700, 1040, 1300 nm, respectively. For BPM calculation, the averaged refractive index of the medium is n = 1.33; the pixel size in the xy planes is λ/4. We used a layer distance of d = 1 μm for layers within 30 μm of the focal plane and d = 10 μm for other layers away from the focal plane. For ND-2PM, we placed the two input Gaussian beams side by side, each with NAbeam = 0.3. The two beams are tilted such that they focus at the same point in the focal plane.
The imaging system configurations are illustrated in Figs. 3(a)–3(c). Examples of I(z) calculated from our BPM model considering the effects of multiple scattering for each MPM technique are shown in Figs. 3(d)–3(f). At shallow depths, the fluorescence near the focus dominates, which resembles the no-scattering case [Figs. 2(a) and 2(c)]. At larger depths, a bump at depths between the focus and tissue surface starts to build up. For 3PM, the fluorescence near the focal plane is at least four orders of magnitude higher than that in the superficial layers, even for zf = 2000 μm. Thus, the background fluorescence comes mainly from the region close to the focal volume, even in the presence of scattering. With the fluorescence intensity profiles obtained, we calculate the widths of the PSF, and the signal and the background fluorescence. For the imaging depths we have explored, all the lateral and axial PSF widths stay roughly invariant, as shown in Figs. 3(g)–3(i). The signal and background fluorescence as functions of depth is shown in Figs. 3(j)–3(l). The ballistic backgrounds calculated from the analytical solutions [in Fig. 2(b) and 2(d)] are also shown for 2PM and 3PM for the ease of comparison. Note that the background also decays with zf due to scattering, even though the total volume of excitation increases with zf. For both 2PM and ND-2PM, the decay of the background is slower compared to the signal or the ballistic background due to multiple scattering. The depth at which the signal equals the background marks the theoretical limit of the imaging depth, which is ~500 μm for 2PM and ~600 μm for ND-2PM under our conditions. The smaller NA of the beams in ND-2PM is the main reason that its imaging depth improvement is not more substantial compared to 2PM. For 3PM, we see that the signal and background both decay exponentially with roughly the same rate as shown in Fig. 3(k), which indicates that the SBR does not change with depth. Thus, unlike 2PM and ND-2PM, SBR is not the primary factor that limits the imaging depth for 3PM.
Fig. 3.
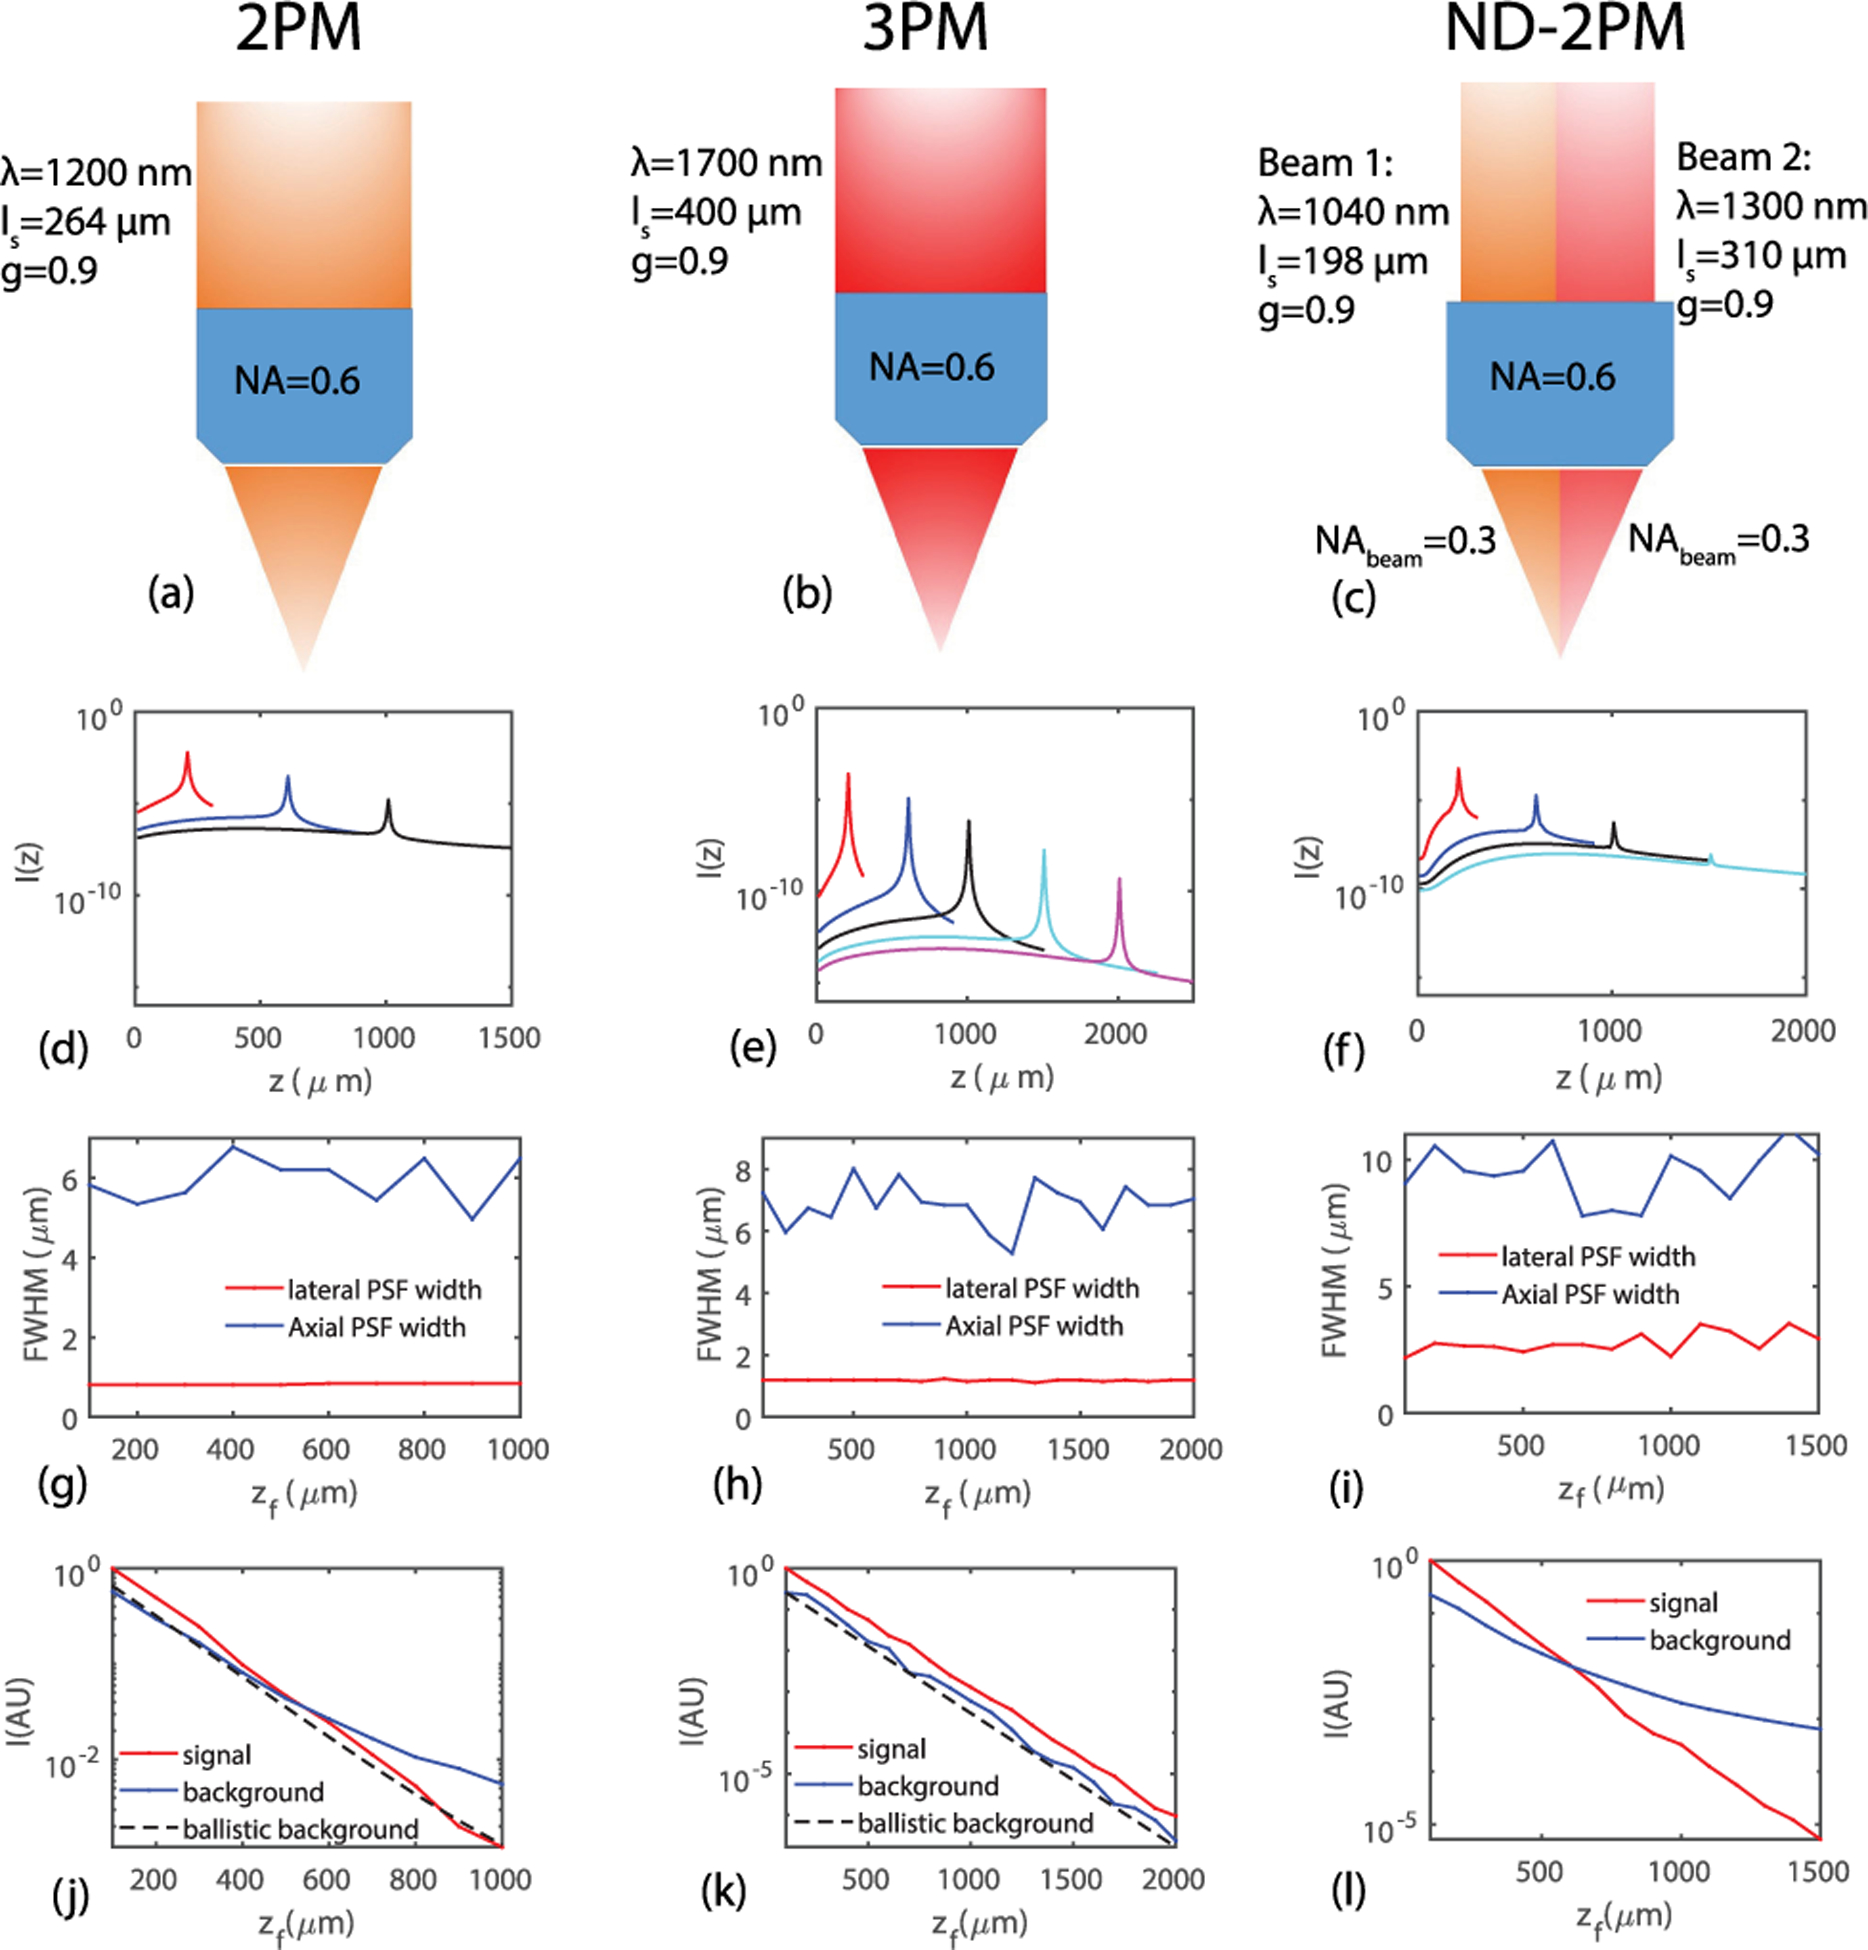
(a)–(c) Illustration of the imaging configurations for 2PM, 3PM, and ND-2PM, respectively. (d)–(f) Fluorescence intensity profile I(z) for the three types of MPM systems. (g)–(i) Lateral and axial PSF widths as functions of focal depth zf for the three types of MPM systems. (j)–(l) Signal, background, and background that comes only from the ballistic light as functions of zf for the three types of MPM systems. The maximum imaging depths we have simulated are 1000, 2000, and 1500 μm for 2PM, 3PM and ND-2PM, respectively, which covers the maximal imaging depth demonstrated or expected for these types of systems.
An additional factor that can impact the SBR is the density of the fluorophores in the scattering medium, which can be affected by the labeling strategy [19]. We define the sparsity factor s as the ratio of fluorophore fraction in the overall volume fglobal relative to that inside the focal volume flocal. flocal is normally higher than fglobal, resulting in s ≤ 1. The sparsity factor is assumed to be one in Figs. 3(j)–3(l). For different sparsity factors, the SBR scales as SBR(s = 1)/s. The imaging depth limits zl obtained when SBR = 1 as functions of sparsity factor are shown in Fig. 4 for 2PM and ND-2PM. When s decreases, the imaging depth limit increases as expected. We obtained the results for different g values, as shown in Fig. 4(a). For both 2PM and ND-2PM, we found that zl is smaller at larger g values. The imaging quality also depends on NA. As shown in Fig. 4(b), the imaging depth limit decreases with a smaller NA = 0.3 compared to the larger NA = 0.6. As compared to the case of 2PM with NA = 0.3, the imaging depth limit of ND-2PM is significantly larger, particularly for high fluorophore density. Thus the depth limit of ND-2PM may be improved by exploring strategies to arrange the two beams without reducing the effective NA available for each beam.
Fig. 4.
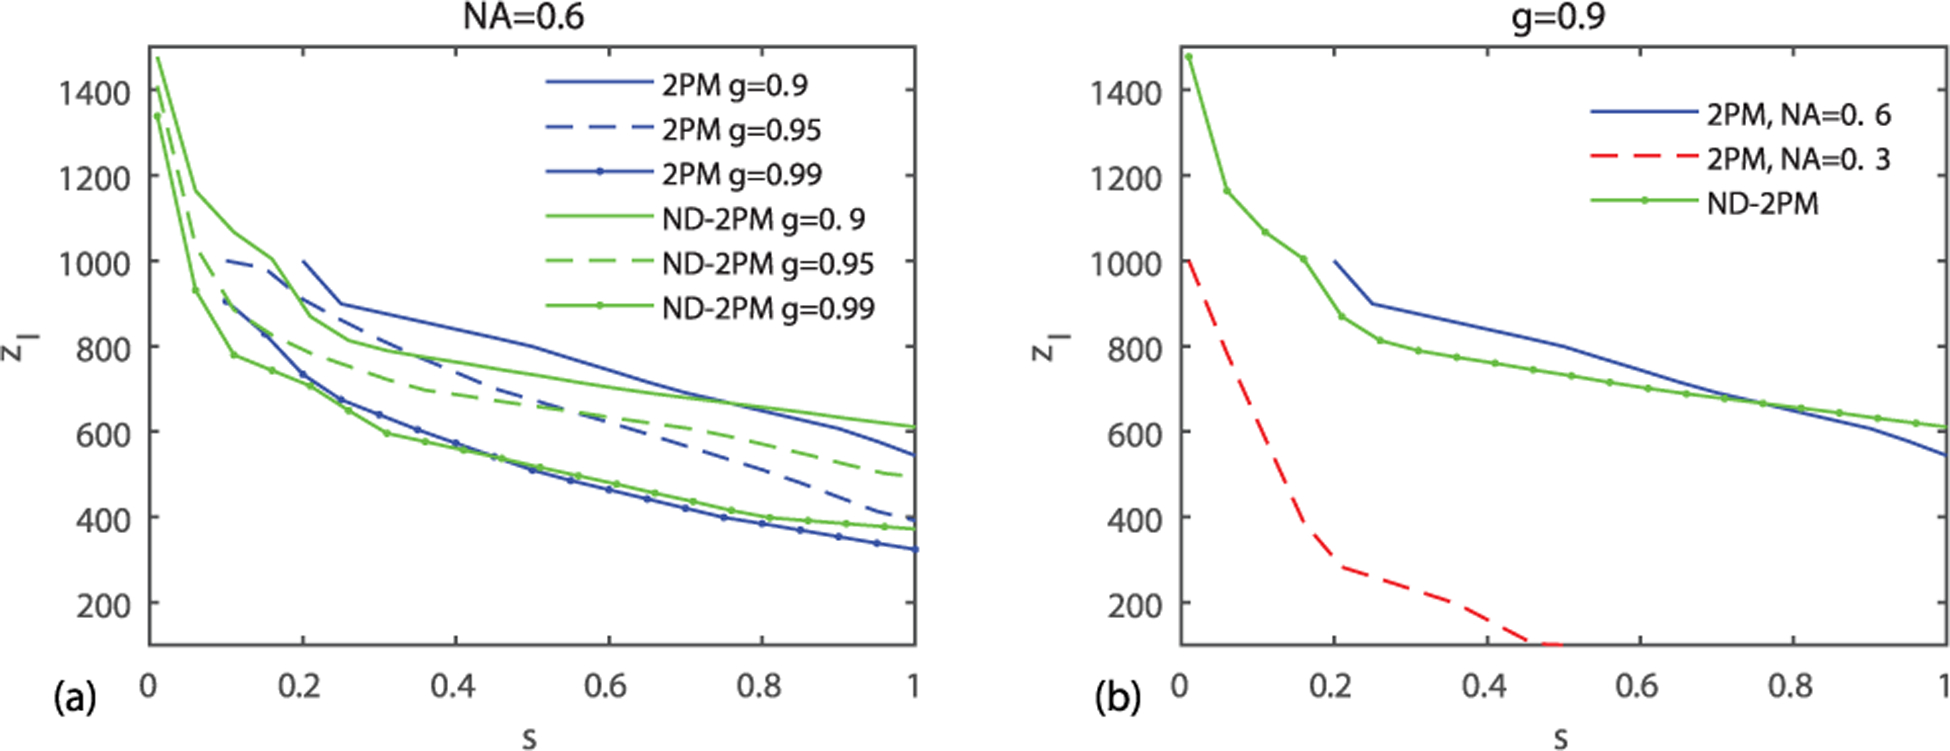
Imaging depth limit zl (SBR = 1) as a function of the sparsity factor s. (a) zl versus s in 2PM and ND-2PM for g = 0.9, 0.95, 0.99. (b) zl versus s in 2PM, NA = 0.6; 2PM, objective underfilled, NA = 0.3; ND-2PM with objective NA = 0.6, NAbeam = 0.3. Other parameters are the same as in Fig. 3.
For 3PM, the imaging quality is determined primarily by the resolution. We obtained the lateral and axial PSF widths with zf/ℓs for 3PM, as shown in Fig. 5. Unlike SBR, which depends on both zf and ℓs, the PSF is a function of only the relative value zf/ℓs. To be computationally efficient, we fixed the imaging depth at 400 μm and varied ℓs to obtain the PSF widths as functions of zf/ℓs. The PSF starts to degrade dramatically after ~5−6ℓs. Thus, the fundamental depth limit for 3PM imaging in tissue with assumed optical parameters is about 2–2.4 mm, and is primarily limited by the loss of resolution due to light scattering instead of the SBR.
Fig. 5.
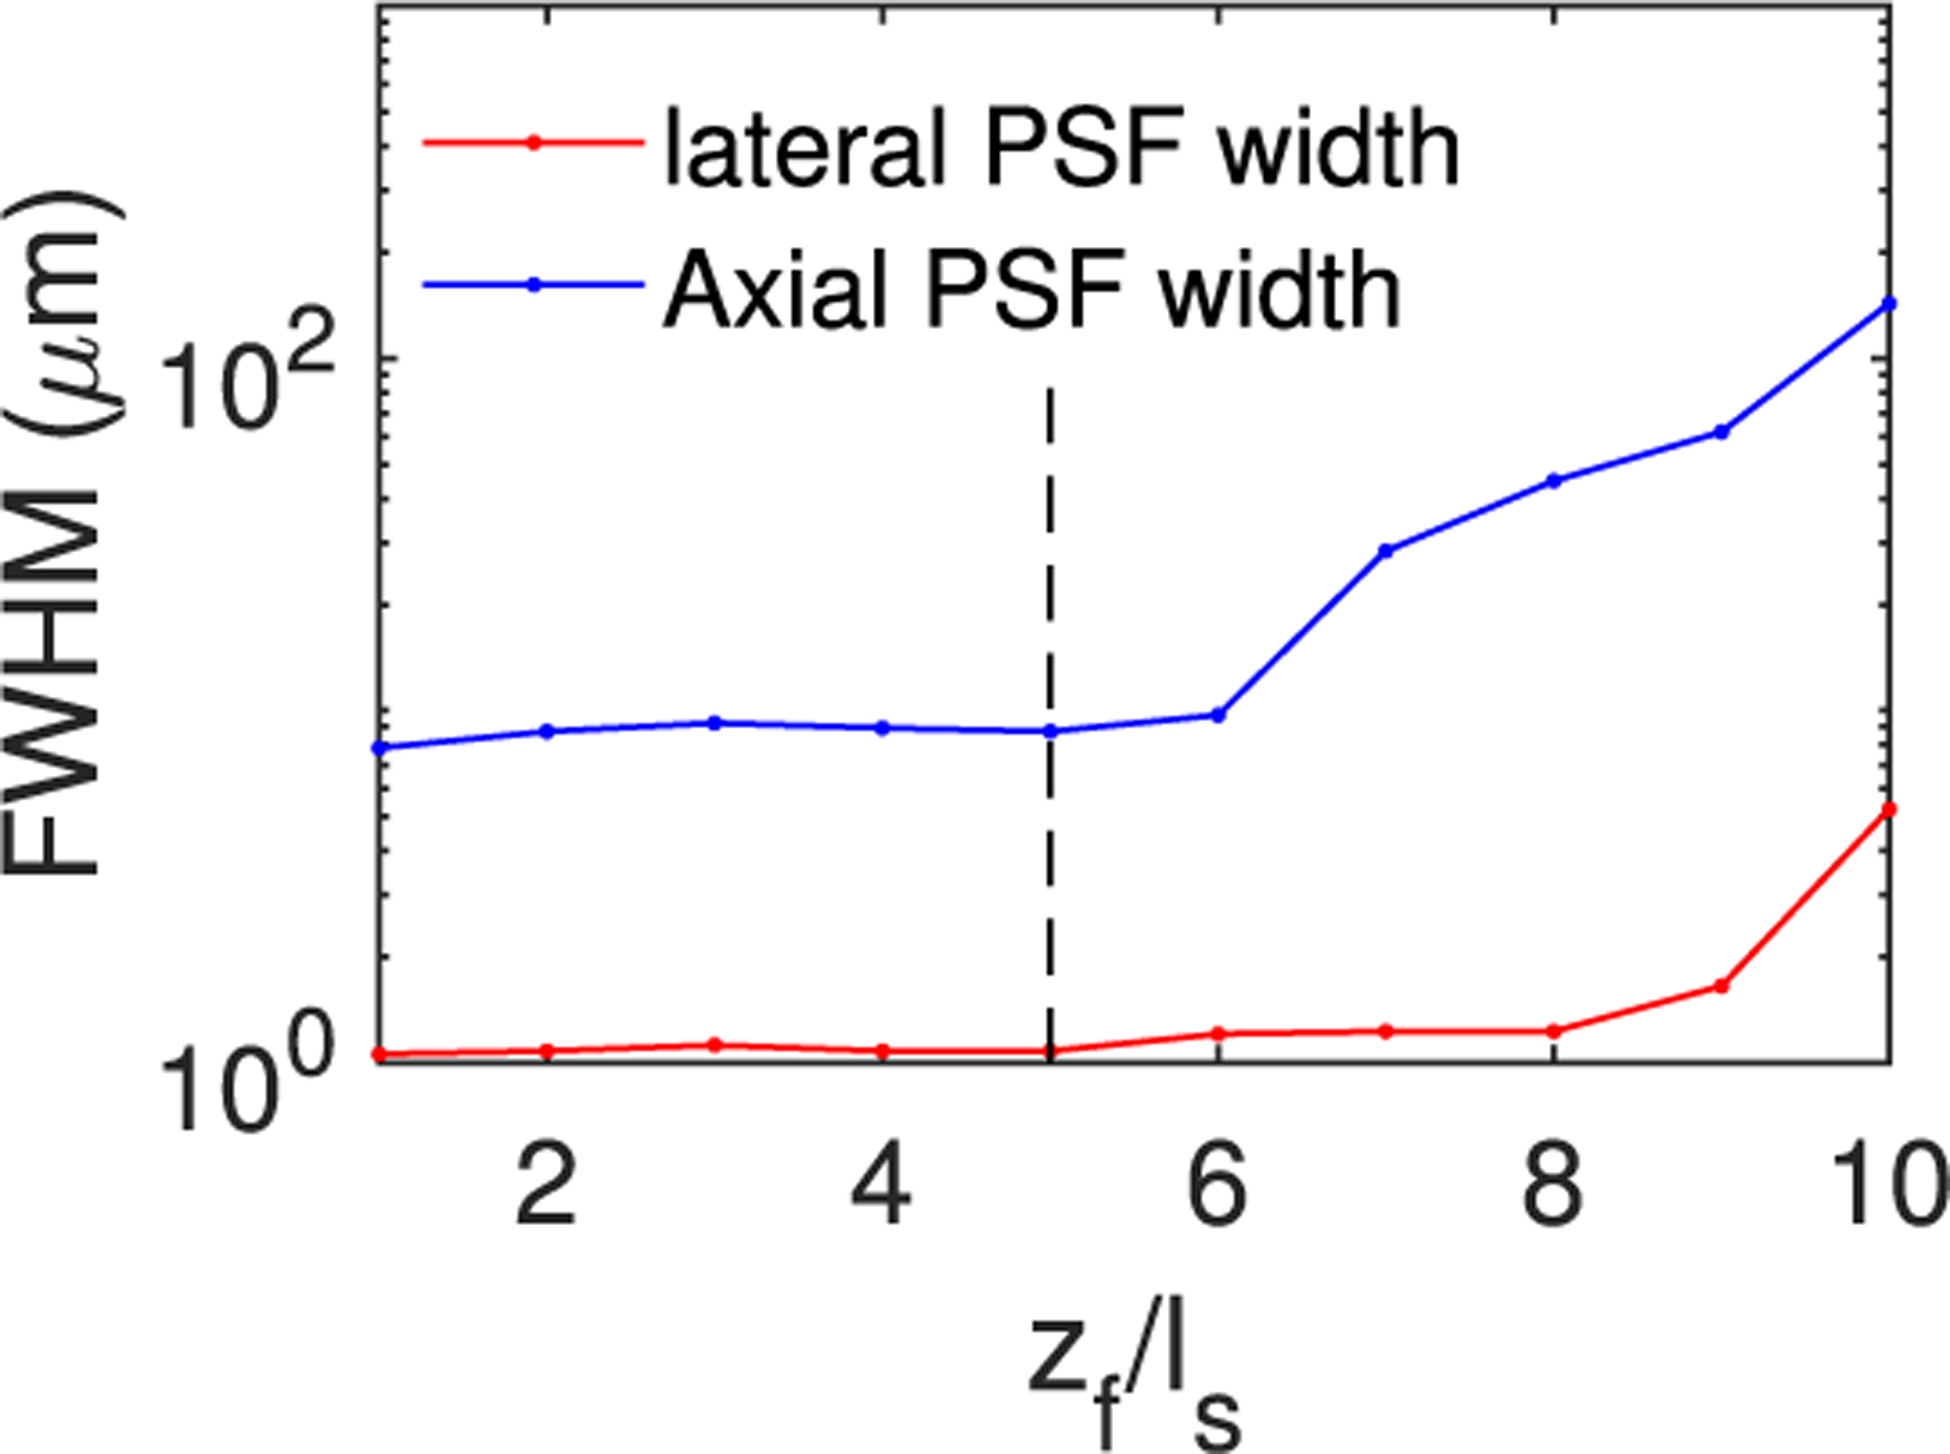
Lateral and axial PSF widths for 3PM with zf = 400 μm fixed and ℓs varied. Other details of the imaging system are the same as in Fig. 3. Here g = 0.9.
For the above calculations, we have assumed a sufficient laser power such that the noise level is much lower than the signal and background levels. We note that depending on the quantum efficiency and local concentration of the fluorophores, collection efficiency of the microscope, and tissue heating limit for the laser power, the signal-to-noise (SNR) ratio may be the limiting factor. We do not explore this SNR limit because of its detailed dependence on the specific experimental implementation. The imaging quality can also be affected by the broadening of the laser pulse width due to scattering. The effect of laser pulse width can be characterized by the temporal enhancement factor , where Ii is the time-varying pulse train, and m = 2, 3 for 2PM and 3PM, respectively [20]. If the pulse is approximated as square functions with width τp at intervals of period τl, . In general, the broadening of τp does not play a significant role in 2PM [8,20]. For 3PM, the impact is larger due to a narrower pulse that is generally used and a larger m. Nowadays, femtosecond laser sources are used with pulse widths of 20–360 fs. We have estimated the pulse broadening using our BPM model with spectral domain simulations as well as Monte–Carlo simulations. The broadening of τp for 3PM with input pulse widths 20–360 fs are all within 5% at depths of 5ℓs, which results in a loss of signal of <10%. This is much smaller than the loss arising from the exponential decay of the signal shown in Fig. 3(k). Since the background fluorescence arises mainly from regions close to the focal volume, the effect of broadening on loss of the background fluorescence will be comparable to the loss of signal fluorescence. Hence, we do not expect the SBR to be affected by pulse broadening.
In summary, we have systematically analyzed the imaging depth limit for 2PM, 3PM, and ND-2PM. When the laser power is sufficient, the imaging depths for 2PM and ND-2PM are fundamentally determined by the SBR. For ND-2PM, arranging the beams side by side reduces the effective NA for each beam, degrading PSF and limiting its performance. In addition, the scattered light also results in some excitation outside of the focal volume. Collectively, these factors indicate the need to explore other ways to arrange the beams to realize the potential of ND-2PM to achieve deep penetration. Ignoring potential SNR limitations, 3PM is not limited by SBR but instead by its PSF resolution, which degrades rapidly after about 5−6ℓs. Generally, the SBR improves with increased sparsity of the fluorophores, allowing greater depth penetration of 2PM and ND-2PM. A larger scattering anisotropy (i.e., g value) will decrease the SBR and PSF resolution [14], and thus the imaging depth limit. The temporal spreading of the pulse due to scattering can reduce the signal, but the effect is not significant for the imaging depths considered here. These results demonstrate the utility of our BPM for exploring novel strategies to improve the depth limits of MPM.
Acknowledgment.
We thank Chris Xu, Jerome Mertz, Yeshaiahu Fainman, Muhan Yang, and Sava Sakadžić for useful discussions.
Funding.
National Institutes of Health (R01-EB021018, R01-MH111359, R01-NS108472).
Footnotes
Disclosures. The authors declare no conflicts of interest.
REFERENCES
- 1.Denk W, Strickler JH, and Webb WW, Science 248, 73 (1990). [DOI] [PubMed] [Google Scholar]
- 2.Svoboda K and Yasuda R, Neuron 50, 823 (2006). [DOI] [PubMed] [Google Scholar]
- 3.Horton NG, Wang K, Kobat D, Clark CG, Wise FW, Schaffer CB, and Xu C, Nat. Photonics 7, 205 (2013). [DOI] [PMC free article] [PubMed] [Google Scholar]
- 4.Ouzounov DG, Wang T, Wang M, Feng DD, Horton NG, Cruz-Hernández JC, Cheng Y-T, Reimer J, Tolias AS, Nishimura N, and Xu C, Nat. Methods 14, 388 (2017). [DOI] [PMC free article] [PubMed] [Google Scholar]
- 5.Yang M-H, Abashin M, Saisan PA, Tian P, Ferri CG, Devor A, and Fainman Y, Opt. Express 24, 30173 (2016). [DOI] [PMC free article] [PubMed] [Google Scholar]
- 6.Sadegh S, Yang M-H, Ferri CG, Thunemann M, Saisan PA, Devor A, and Fainman Y, Opt. Express 27, 8335 (2019). [DOI] [PMC free article] [PubMed] [Google Scholar]
- 7.Sadegh S, Yang M-H, Ferri CG, Thunemann M, Saisan PA, Wei Z, Rodriguez EA, Adams SR, Kiliç K, Boas DA, and Sakadžić S, Opt. Express 27, 28022 (2019). [DOI] [PMC free article] [PubMed] [Google Scholar]
- 8.Theer P and Denk W, J. Opt. Soc. Am. A 23, 3139 (2006). [DOI] [PubMed] [Google Scholar]
- 9.Kobat D, Horton NG, and Xu C, J. Biomed. Opt 16, 106014 (2011). [DOI] [PubMed] [Google Scholar]
- 10.Papadopoulos IN, Jouhanneau J-S, Poulet JF, and Judkewitz B, Nat. Photonics 11, 116 (2017). [Google Scholar]
- 11.Ouzounov DG, Wang T, Wu C, and Xu C, Biomed. Opt. Express 10, 3343 (2019). [DOI] [PMC free article] [PubMed] [Google Scholar]
- 12.Takasaki K, Abbasi-Asl R, and Waters J, Eneuro 7, 1 (2020). [DOI] [PMC free article] [PubMed] [Google Scholar]
- 13.Van Roey J, Van der Donk J, and Lagasse P, J. Opt. Soc. Am 71, 803 (1981). [Google Scholar]
- 14.Cheng X, Li Y, Mertz J, Sakadžić S, Devor A, Boas DA, and Tian L, Opt. Lett 44, 4989 (2019). [DOI] [PMC free article] [PubMed] [Google Scholar]
- 15. https://github.com/BUNPC/Beam-Propagation-Method.
- 16.Si K, Gong W, Chen N, and Sheppard CJ, Appl. Phys. Lett 99, 233702 (2011). [Google Scholar]
- 17.Goodman JW, Introduction to Fourier Optics (Roberts and Company Publishers, 2005). [Google Scholar]
- 18.Wang M, Wu C, Sinefeld D, Li B, Xia F, and Xu C, Biomed. Opt. Express 9, 3534 (2018). [DOI] [PMC free article] [PubMed] [Google Scholar]
- 19.Tian P, Devor A, Sakadzic S, Dale AM, and Boas DA, J. Biomed. Opt 16, 016006 (2011). [DOI] [PMC free article] [PubMed] [Google Scholar]
- 20.Mertz J, Introduction to Optical Microscopy (Cambridge University, 2019). [Google Scholar]


