

Abstract
Toll-like receptor (TLR) signaling represents a key innate immune response to pathogen products. Recruitment of signaling adapters such as MAL/TIRAP and MyD88 to the receptors requires TIR-domain interactions, which remain structurally elusive. Here we show that MAL TIR domain spontaneously and reversibly forms filaments in vitro, forms a co-filament with TLR4 TIR domain, and induces formation of a MyD88 assembly. A 7 Å resolution cryo-electron microscopy structure reveals a stable MAL proto-filament consisting of two parallel strands of TIR-domain subunits in a BB loop-mediated head-to-tail arrangement. Residues at the interfaces important for the interaction are conserved among different TIR domains. Although large filaments of TLR4, MAL or MyD88 are unlikely to form during signaling in the cell, structure-guided mutagenesis, combined with in vivo interaction assays, demonstrate that the MAL interactions defined within the filament represent a template for a conserved mode of TIR domain interaction involved in both TLR and IL-1R signaling.
Introduction
Toll-like receptors (TLRs) are a family of pattern-recognition receptors (PRRs) that defend against microbial infection and endogenous danger by interacting with conserved pathogen- and danger-associated molecular patterns (PAMPs/DAMPs) 1. TLRs contain a cytosolic Toll/interleukin-1 receptor (TIR) domain, and signal transduction is initiated by self-association of the TIR domains upon binding of PAMPs. This leads to the recruitment of intracellular TIR domain-containing adaptor proteins such as MyD88, MAL (TIRAP), TRIF (TICAM-1) and TRAM (TICAM-2) via TIR:TIR domain interactions 2, which triggers downstream activation of transcription factors NF-кB, AP-1 and IRFs to induce anti-pathogen responses and inflammation 3. Dysregulation of TLR signaling is associated with a number of disorders including cancer, allergy, autoimmunity, inflammatory bowel disease, and atherosclerosis 2,4.
MyD88 is required for signaling by all TLRs except for TLR3, which uses TRIF alone. TLR4 can signal through both the MyD88- and TRIF-mediated pathways, involving the membrane-associated bridging adaptor proteins MAL and TRAM, respectively. MyD88 also contains a death domain (DD) that interacts with IRAKs (IL-1R-associated kinases) through DD:DD interactions to form the helical myddosome assembly 5. This brings the kinase domains of IRAKs into proximity for phosphorylation and activation 6. The adaptor MAL has been shown to be required for TLR4-induced myddosome assembly and present within it 7.
TIR domains have a flavodoxin-like fold and the loops are usually named based on the elements of secondary structure they connect 8,9. The highly conserved BB-loop, which links the βB-strand to the αB-helix, is a key interaction motif 2. For TLR4, a P712H mutation in the BB loop is responsible for the unresponsiveness of C3H/HeJ mice to LPS 10 and the equivalent mutations in TLR2 and the adaptors MAL (P125H), TRAM (P116H/C117H) and TRIF (P434H) generate dominant-negative inhibitors of TLR-mediated signaling 11–13. Although structures are available for monomeric receptor and adaptor TIR domains 9, the mechanisms by which TIR domains mediate intracellular TLR signaling are poorly understood.
MAL can self-assemble into filaments
We observed that solutions (60 µM) of purified full-length MAL (residues 1–221; MALFL) and its TIR domain (residues 79–221; MALTIR) became turbid when incubated at 25–30°C, suggesting self-aggregation. Negative-stain electron microscopy (EM) revealed the presence of filaments with a diameter of 25–30 nm in both samples (Fig. 1a, Supplementary Fig. 1a). The filaments disassembled if stored at 4°C, showing that MAL polymerization in vitro is temperature-dependent and reversible (Supplementary Fig. 1b). Analysis of turbidity profiles at different protein concentrations (Supplementary Fig. 1c-d) shows that MALFL clusters more readily than MALTIR. Increased clustering was observed at high ionic strength or low pH (Supplementary Fig. 1e-f). In an in vitro cell-free expression system, MALFL formed large aggregates above 200 nM, while MALTIR formed smaller oligomers (Supplementary Fig. 2a-b). The polymerization of MALFL is self-replicating in vitro, as addition of filament “seeds” triggers aggregation of monomeric MALFL (Supplementary Fig. 2e,h-i).
Figure 1: MAL forms large assemblies in vitro and in vivo, TLR4TIR and MALTIR form co-assemblies, and MALTIR induces MyD88TIR assembly formation.

a, Negative-stain EM images of MALTIR and MALFL incubated at 30°C for 1 h. b, Negative-stain EM images of TLR4TIR and TLR4TIR +MALTIR incubated at equimolar concentrations, at 30°C for 1 h. c-d, SDS-PAGE analyses of the insoluble fraction after incubation of MALTIR, TLR4TIR, and MALTIR + TLR4TIR at 30°C for 1 h with each protein at 60 µM (c) or 30 µM (d). The results are typical of three experiments. e, Negative-stain EM images of MyD88TIR (60 µM), and MALTIR (6 µM) + MyD88TIR (60 µM) incubated at 30°C for 1 h. f, SDS-PAGE analyses of the soluble (SF) and insoluble (IF) fractions after incubation of MyD88TIR (60 µM), and MALTIR (6 µM) + MyD88TIR (60 µM) at 30°C for 1 h. The results are typical of three experiments. g-h, Turbidity assays of MyD88TIR (60 µM) assembly formation in the presence of sub-stoichiometric amounts of MALTIR (g), TRAMTIR and TLR4TIR (h). Similar trends were observed in three experiments. The magenta (MyD88-TRAM 20:1) and orange (MyD88-TLR4 10:1) lines are mostly hidden under the light blue line (MyD88-TLR4 20:1). i, Clustering of MyD88FL in HEK293 cells induced by MAL. Cells were transfected with plasmids expressing V5-tagged MyD88FL or MyD88TIR alone or in the presence of Myc-tagged MALFL or MALTIR. Cells were immuno-stained with anti-V5 and anti-Myc antibodies and analyzed by flow cytometry. Cells with low MyD88-V5 expression were selected (Supplementary Fig. 4) for analysis of fluorescent pulse-height vs. area for MyD88-V5. Cells with clustered MyD88 have an elevated height-to-area ratio (boxed). The results are typical of three experiments. The original images of gels in (c), (d) and (f) can be found in Supplementary Data Set 1.
We next examined whether MAL’s TIR domain-containing signaling partners could form large assemblies. Filamentous structures were not observed for TLR4TIR under conditions similar to those that promoted MAL polymerization (Fig. 1b). However, when we incubated equal amounts of TLR4TIR and MALTIR together (25–30°C for 1 h) at concentrations above (60 µM of each) and below (30 µM of each) the critical concentration for MALTIR-filament formation, both samples became turbid. Negative-stain EM analysis revealed filaments morphologically distinct from the MALTIR filaments, with a uniform diameter of approximately 20 nm (Fig. 1b). The thicker MALTIR homopolymers were not observed in either of the samples, and SDS-PAGE analysis of the insoluble fractions indicated that the filaments contain both MALTIR and TLR4TIR at an approximately 1:1 ratio (Fig. 1c-d), suggesting that MALTIR and TLR4TIR form a mixed oligomeric assembly more readily than MAL alone. TLR3TIR, which has only been shown to engage the TRIF-dependent signaling pathway, did not form an oligomeric co-assembly with MAL under any of the conditions tested (Supplementary Fig. 3a-c).
MAL promotes assembly of MyD88 oligomers
We also could not observe filamentous structures with MyD88TIR alone (Fig. 1e), but in the presence of MALTIR (60 µM each, 25–30°C), the solution became turbid due to assemblies containing both MALTIR and MyD88TIR (Supplementary Fig. 3d). Negative-stain EM revealed shorter and more heterogeneous structures compared to MAL alone (Supplementary Fig. 3e). MyD88TIR was also incubated with sub-stoichiometric amounts of MALTIR, and the rate of turbidity increase was enhanced in the presence of increasing amounts of MALTIR (1/80 – 1/20 molar ratios) (Fig. 1f-g, Supplementary Fig. 3f). Incubation of MyD88TIR with TLR4TIR, or TRAM (involved in TRIF-dependent TLR4 signaling), did not lead to an increase in turbidity, suggesting that the effect is specific to MALTIR (Fig. 1h). Negative-stain EM images of MyD88TIR assemblies induced by sub-stoichiometric amounts of MALTIR revealed rod-shaped particles with significant variation in size (1–10 × 0.15–0.5 × 0.01 µm) (Fig. 1e). Fast-Fourier transform analyses of these particles revealed Bragg spots, suggesting that the observed structures are ordered arrays of MyD88TIR (Supplementary Fig. 3g-h).
Using in vitro cell-free expression, MyD88TIR formed small soluble oligomers, but MyD88FL spontaneously self-assembled into large structures (Supplementary Fig. 2c-d). Addition of oligomers of MyD88FL could trigger aggregation of monomeric MyD88FL, suggesting self-templated growth (Supplementary Fig. 2e,f-g).
MyD88FL formed a single cluster when overexpressed in HEK293 cells (Supplementary Fig. 4a), consistent with previous reports 14–16. To assess if MAL could induce self-association of MyD88FL in HEK293 cells, we established a flow cytometry time-of-flight assay 17 to quantify MyD88 clustering (Supplementary Fig. 4b-c). Although MyD88FL clusters spontaneously at high expression levels (Supplementary Fig. 4a,c), clustering at low expression levels is increased when co-expressed with either MALFL or MALTIR (Fig. 1i, Supplementary Fig. 4c-d), consistent with our in vitro data.
Cryo-EM structure of the MALTIR filament
Cryo-EM images of MALTIR filaments (Fig. 2a) were collected using automated data acquisition and a direct electron detector. Image analysis (Supplementary Fig. 5a) revealed a helical symmetry with a 15.5 Å axial rise, 26.8° left-handed rotation, and a C6 rotational symmetry about the helical axis. Iterative helical real space refinement (IHRSR) was used to produce an electron density map with an estimated resolution of 7 Å (Fig. 2b-c, Supplementary Fig. 5b). The final map displayed clear secondary structure elements and allowed a model of MALTIR to be unambiguously fitted and refined (Fig. 2b-c, Supplementary Fig. 5c).
Figure 2: Cryo-EM structure of the MALTIR filament at 7 Å resolution.
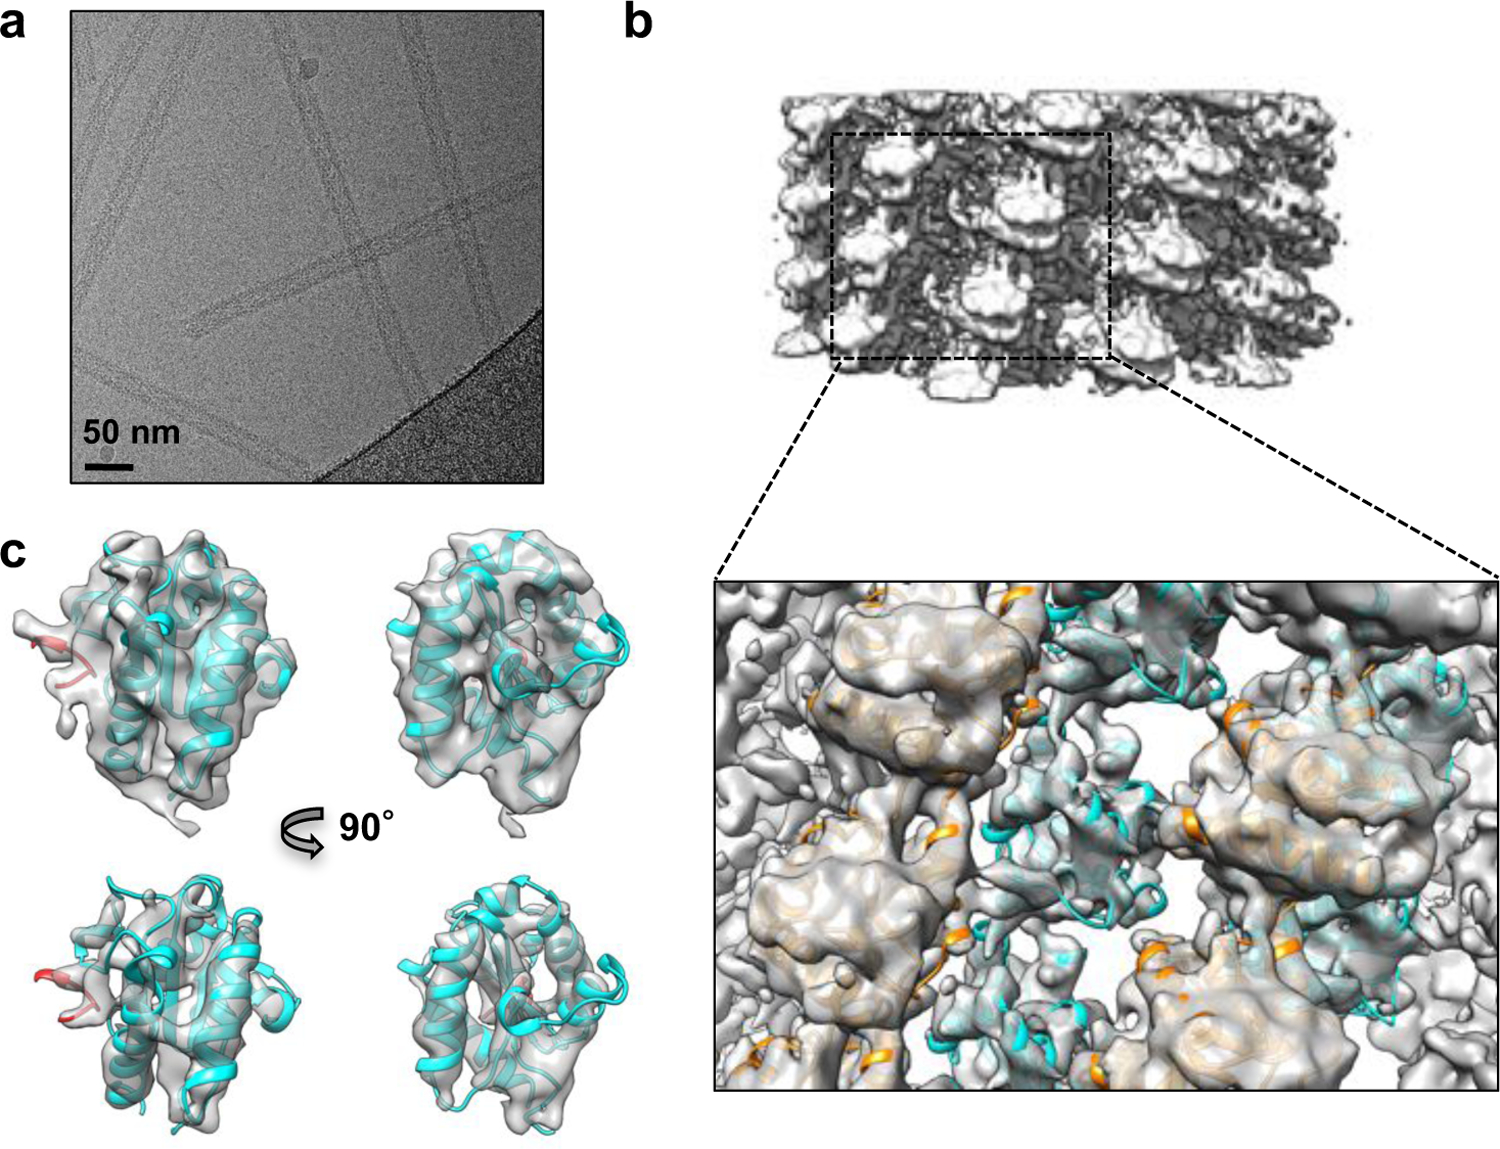
a, Cryo-EM image of the MALTIR filaments. b, Cryo-EM reconstruction of the MALTIR filament, superimposed with the final atomic model (strands in cyan and orange). c, The zoomed-in view of an inner-strand MALTIR subunit (ribbon representation) and the EM map. Two different map threshold levels are displayed. The red-colored ribbon corresponds to the BB loop of the preceding subunit.
The MALTIR filament is composed of 12 proto-filaments that associate laterally, forming a hollow tube with an inner and outer diameter of 130 and 250 Å, respectively (Fig. 3a). Each proto-filament is composed of two parallel strands of MAL subunits (inner and outer strand) (Fig. 3b-c). The structures of the inner and outer-strand MAL subunits are similar, with a root-mean-square deviation (rmsd) of 1.9 Å for 135 Cα atoms, but conformational differences can be observed in loop regions (Fig. 3d). The structure of MALTIR in the filament exhibits significant conformational differences to both the NMR (PDB 2NDH; rmsd of 3.5 Å for 135 Cα atoms) and crystal (PDB 2Y92, rmsd of 2.3 Å for 118 Cα atoms) structures of MALTIR, likely due to the participation of multiple flexible regions of MALTIR in filament interactions (Fig. 3e-f). The region encompassing the AB loop, βB strand, BB loop and αB helix has a similar configuration in the NMR and MALTIR filament structures. This region is significantly different in the crystal structure (Fig. 3f) due to the presence of the C89-C134 disulfide bond 18. Among the known TIR-domain structures, the receptor TIR domains of TLR1, 2, 6, and 10, and IL-RACP possess a BB loop and αB helix conformation similar to the conformation observed in the MALTIR filament (Fig. 3g, Table S1).
Figure 3: Structural analysis of the MALTIR filament.
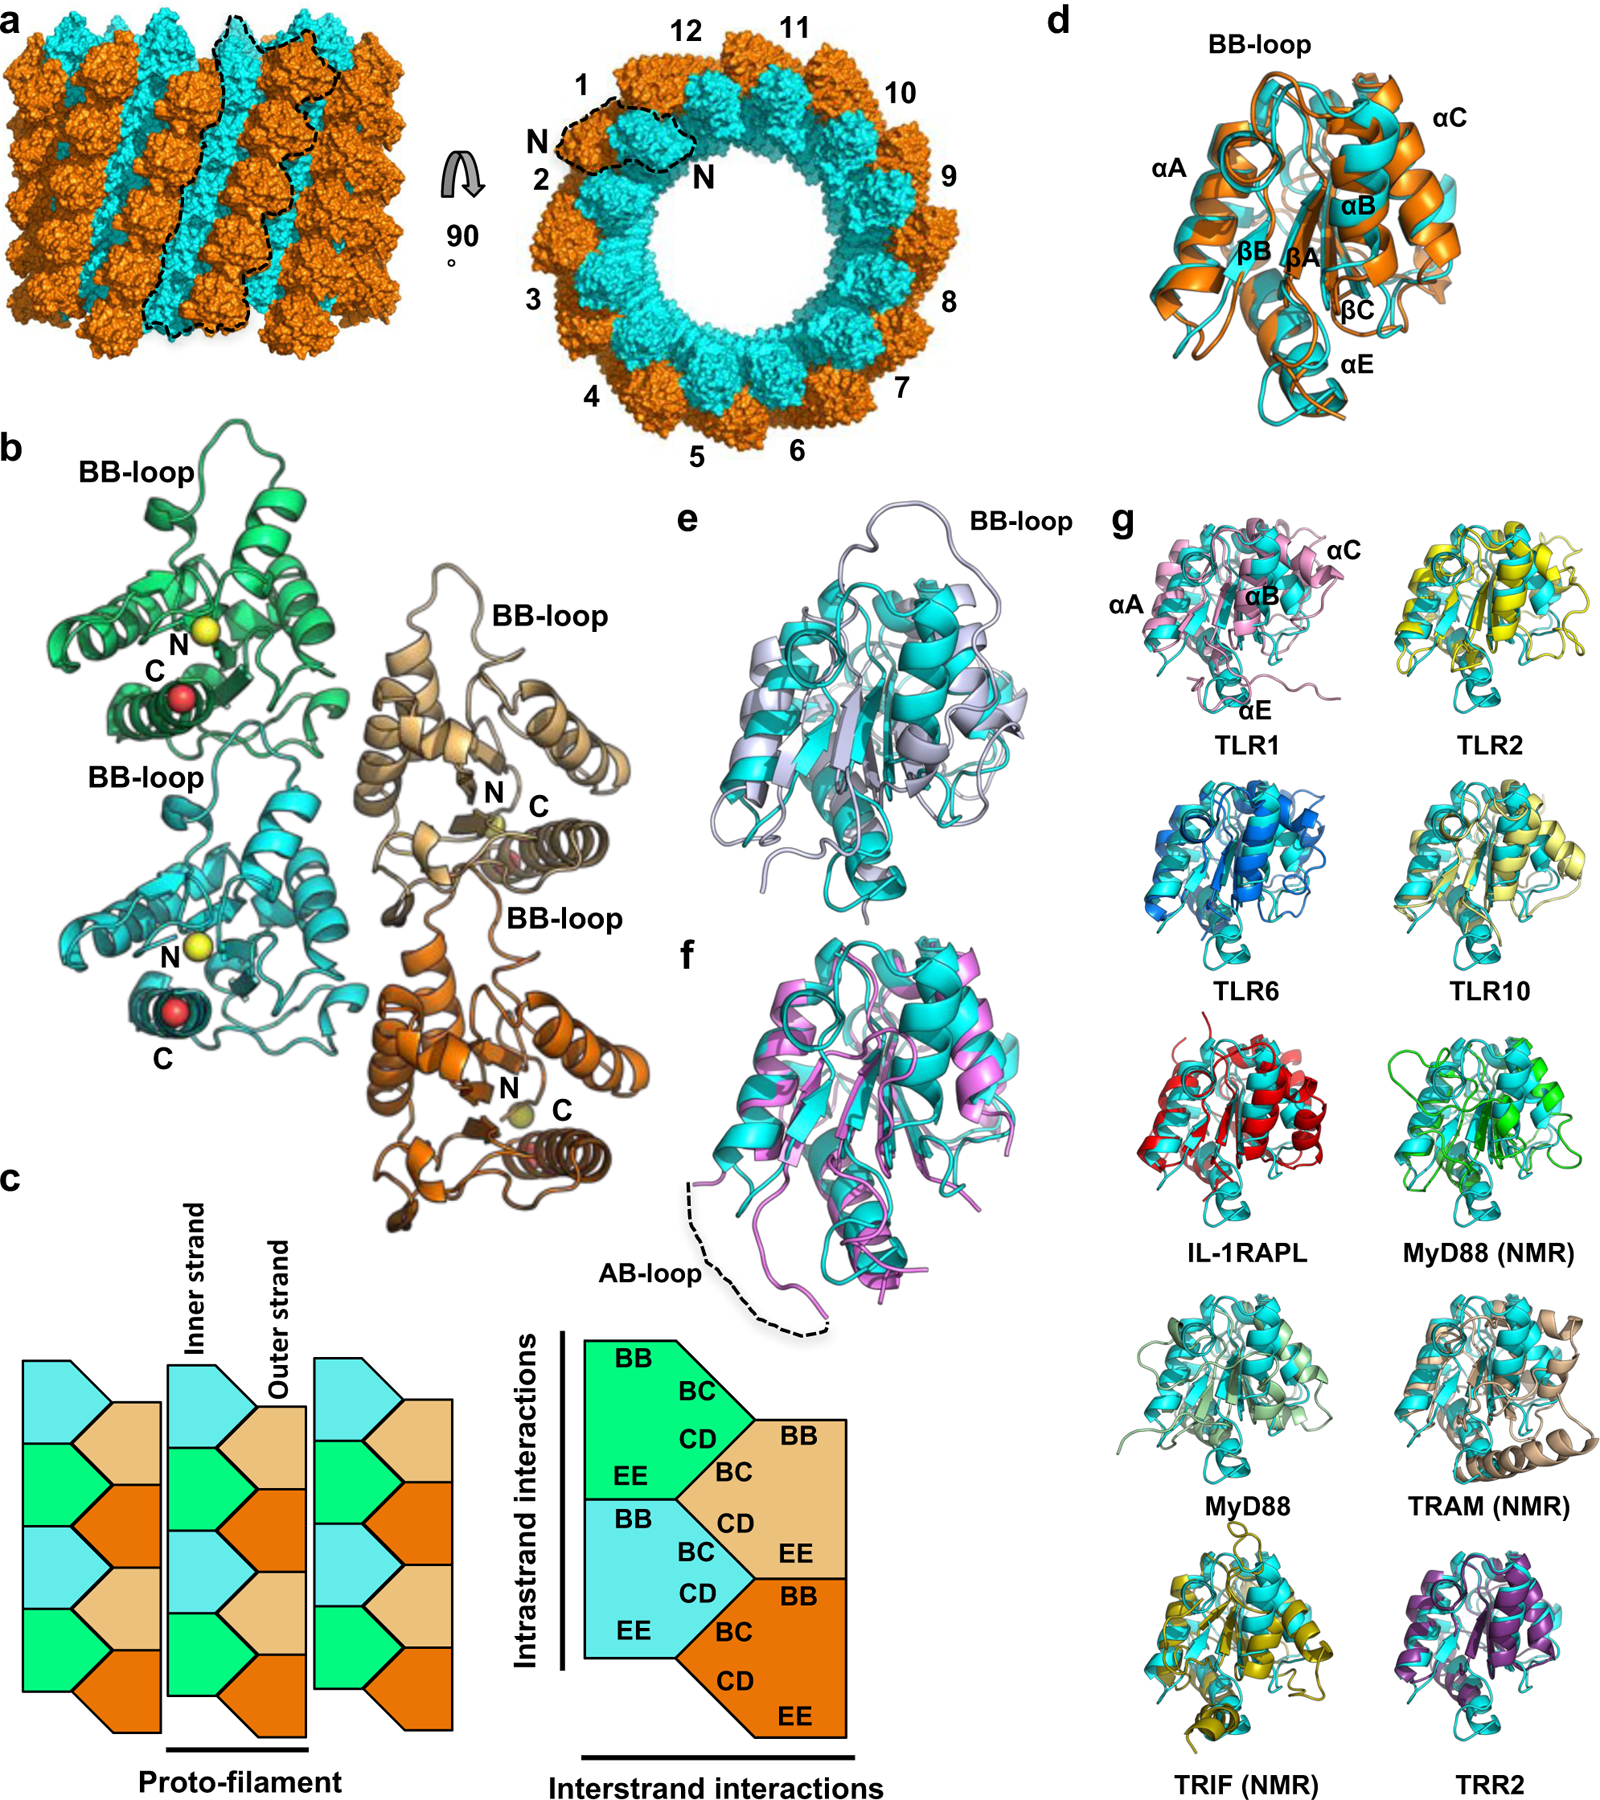
a, Surface representation of the MALTIR filament - a hollow tube with C6 symmetry consisting of 12 two-stranded proto-filaments (black dotted lines). Cyan/orange, the inner/outer helical strands. “N” indicates the position of the N-terminus of the inner and outer strand subunits. b, Cartoon representation of the MALTIR proto-filament. The N terminus of each TIR monomer is marked by a yellow sphere, and the C terminus of each SAM monomer is marked by a red sphere. c, Schematic diagram of the MALTIR filament and the two types of asymmetric interactions within the proto-filament. d-f, Comparison of inner-strand subunit (cyan) and (d) the outer-strand subunit (orange); (e) MALTIR NMR structure (light-blue; PDB 2NDH); and (f) the MALTIR crystal structure (pink; PDB 2Y92). g, Superposition of the inner MALTIR subunit (cyan) and the TIR domain of TLR1 (PDB ID 1FYV), TLR2 (PDB ID 1FYW), TLR6 (PDB ID 4OM7), TLR10 (PDB ID 2J67), IL-1RAPL (PDB ID 1T3G), MyD88 (PDB ID 2Z5V), MyD88 (PDB ID 4EO7), TRAM (PDB ID 2M1W), TRIF (PDB ID 2M1X) and TRR2 (PDB ID 4W8G).
Detailed interactions in the MALTIR filament
There are two major types of asymmetric interactions between subunits in the MALTIR filament, one within each of the two strands of the proto-filaments (intrastrand), and one between the two strands of the proto-filaments (interstrand), The intrastrand and interstrand interactions (Fig. 3b-c, Fig. 4) bury 23–25% (1730–1890 Å2) of the total surface area of each subunit. The intrastrand interaction involves opposite sides of MALTIR in an open-ended, “head-to-tail” fashion (residues in the BB loop (“BB surface”) of one MALTIR subunit interact with residues on the “EE surface” (the βD and βE strands and the αE helix on the next subunit; the former could be considered “head” and the latter “tail”) (Fig. 3b-c, Fig. 4). At the core of this interface, the conserved β-turn residues P125 and G126 of the BB loop are buried in a pocket at the center of the βE strand. P125 forms contacts with I176 in the βD strand, Y195 and V197 in the βE strand, and A212 in the αE helix (Fig. 4a). The interface is also stabilized by three main-chain hydrogen bonds (G126-Y195, G127-Y195, I129-F193). In the inner strand of the proto-filaments, the intrastrand interface also involves hydrogen bonds between the R215 side-chain and the side-chain of T124 and the main-chain carbonyls of R121 and A123. These latter residues are part of a short α-helix that is stabilized by a salt bridge between the side-chains of E108 and R121. Each subunit in the proto-filament interacts with two subunits in the second strand through interstrand interactions (Fig. 3b-c, Fig. 4b). These interactions involve residues in the αB and αC helices of one MALTIR (“BC surface”), and residues in the αD helix and the CD loop of another MALTIR (“CD surface”).
Figure 4: Detailed interactions in the MALTIR proto-filament.
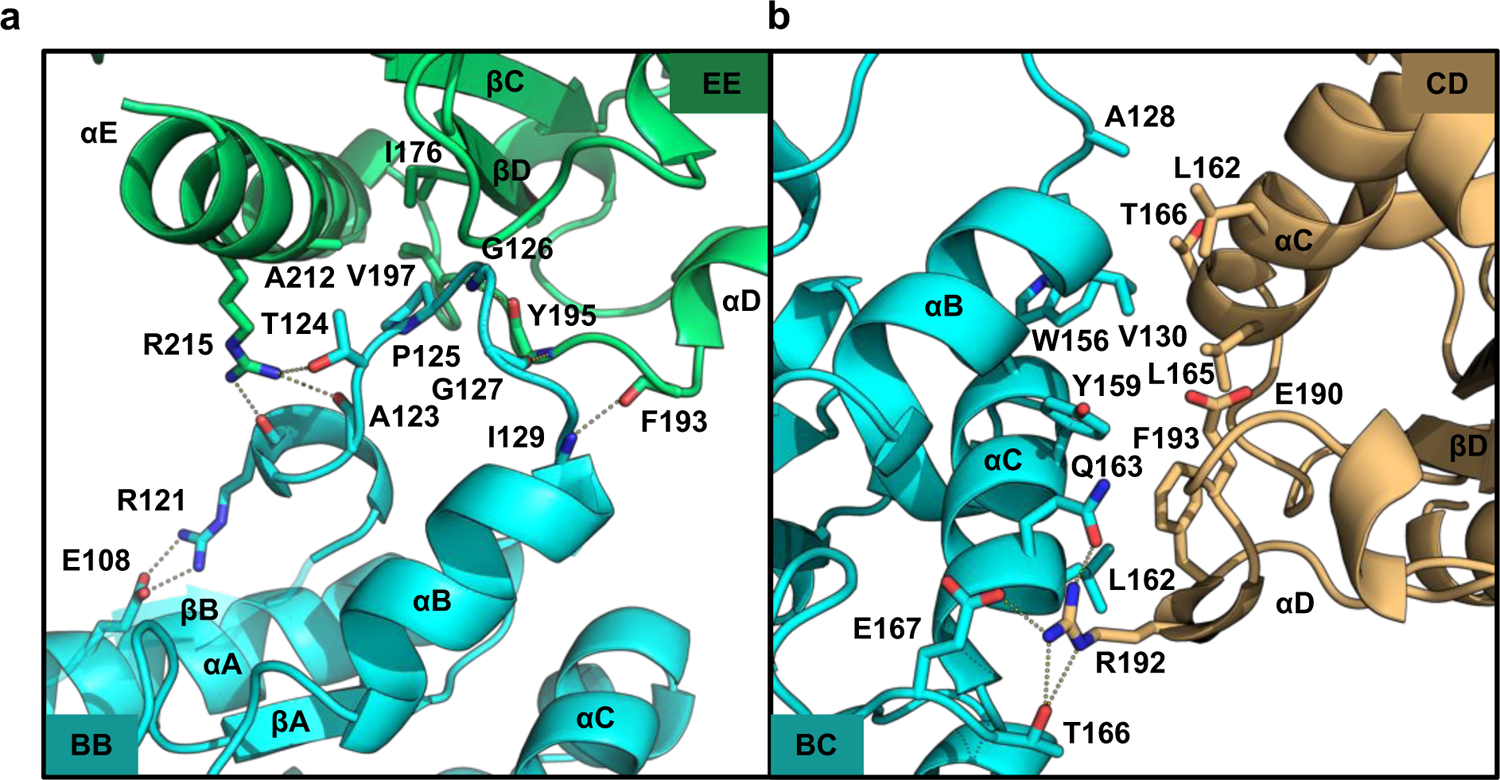
a, The intrastrand interface-inner subunits. b, The interstrand interface.
Multiple-sequence and structure-based alignments of human TIR domains highlight the conservation of the residues equivalent to P125, G126, I176 and V197 (Supplementary Fig. 5d-e), suggesting that the intrastrand interface observed in both strands of the MAL proto-filament may be a conserved mode of interaction among mammalian TIR domains. This is supported by analysis of the crystal structures of the TIR domain of the Toll-related receptor TRR-2 from Hydra magnipapillata (TRR-2TIR; PDB 4W8G, 4W8H; 29% sequence identity with MAL), which reveals an interface almost identical to the intrastrand interface observed in the MALTIR proto-filament in two different crystal forms (Supplementary Fig. 6a-c). The interstrand interface is also observed in one of these crystal forms (PDB 4W8G) (Supplementary Fig. 6a).
During normal TLR4 signaling, MAL is anchored to the plasma membrane via its N-terminal region (residues 15–35, outside the TIR domain) by binding to phosphoinositides 7,19. Because the N-termini of the subunits in the two strands of the proto-filaments are localized on opposite sides of the assembly (Fig. 3a-b), lateral association of 12 proto-filaments into a hollow tube is not possible at the membrane, as the N-terminal region of all the inner-strand subunits would be buried on the inside of the tube. The interactions between proto-filaments in the tube are also significantly less extensive, compared to the intrastrand and interstrand interactions within the proto-filament. The proto-filament interface consists primarily of aspartate/glutamate-arginine salt bridges, and only 3% (200 Å2) of the total surface area per subunit is buried in these interactions (Supplementary Fig. 7a). It is thus likely that the lateral association of the proto-filaments into a hollow tube only occurs in solution (when a high concentration of proto-filaments is available) and only the TIR:TIR interactions within the proto-filaments are of relevance to normal TLR4 signaling in the cell.
Structure-guided mutagenesis disrupts MAL and MyD88 assembly formation
The ability of purified MALTIR mutants (100 µM) to form filaments was first assessed by analysing the insoluble fraction (after incubation at 30°C for 12 h) using SDS-PAGE (Fig. 5a, Supplementary Fig. 7b). Mutants with significantly less protein in the insoluble fraction compared to wild-type protein were also analysed for the presence of filaments by negative-stain EM (Supplementary Fig. 7c). The mutations P125A (intrastrand interface), L162A, L165A, W156Y159AA and F193A (interstrand interface) abolish MAL-filament formation (Fig. 5a, Supplementary Fig. 7b-d). The E108A, F117A, and R121A mutations (predicted to affect the BB-loop conformation), and the K158A mutation (near interstrand interface) also disrupt filament formation. Mutations outside the intrastrand and interstrand interfaces (D87A, E94A, E95A, D96A, L97A, Y106A, R115A, E132A, Q135A, R207A, D203A and K210A) do not disrupt MAL-filament formation, apart from L182A, Y187A, Y196A (partially buried residues likely important for domain stability) and D154A, R200A (interface between proto-filaments). Although overexpression in HEK293 cells may not indicate the normal localisation of the endogenous protein, it was used to analyse protein-protein interactions in a cellular environment. The punctate distribution of MALFL is disrupted by the mutations R121A, P125H, and F193A, confirming that the intrastrand and interstrand interfaces are likely to mediate TIR-domain interactions in vivo (Fig. 5b). The P125A mutant retains the ability to cluster in cells, consistent with previous observations that the P125A mutation only leads to partial reduction in NF-кB activity20. Extensive published MAL mutagenesis data confirm the importance of both the intrastrand and interstrand TIR:TIR interactions that we have defined, for the activation of NF-кB 20,21 (Table S2).
Figure 5: Structure-based mutations disrupt MALTIR-filament formation.
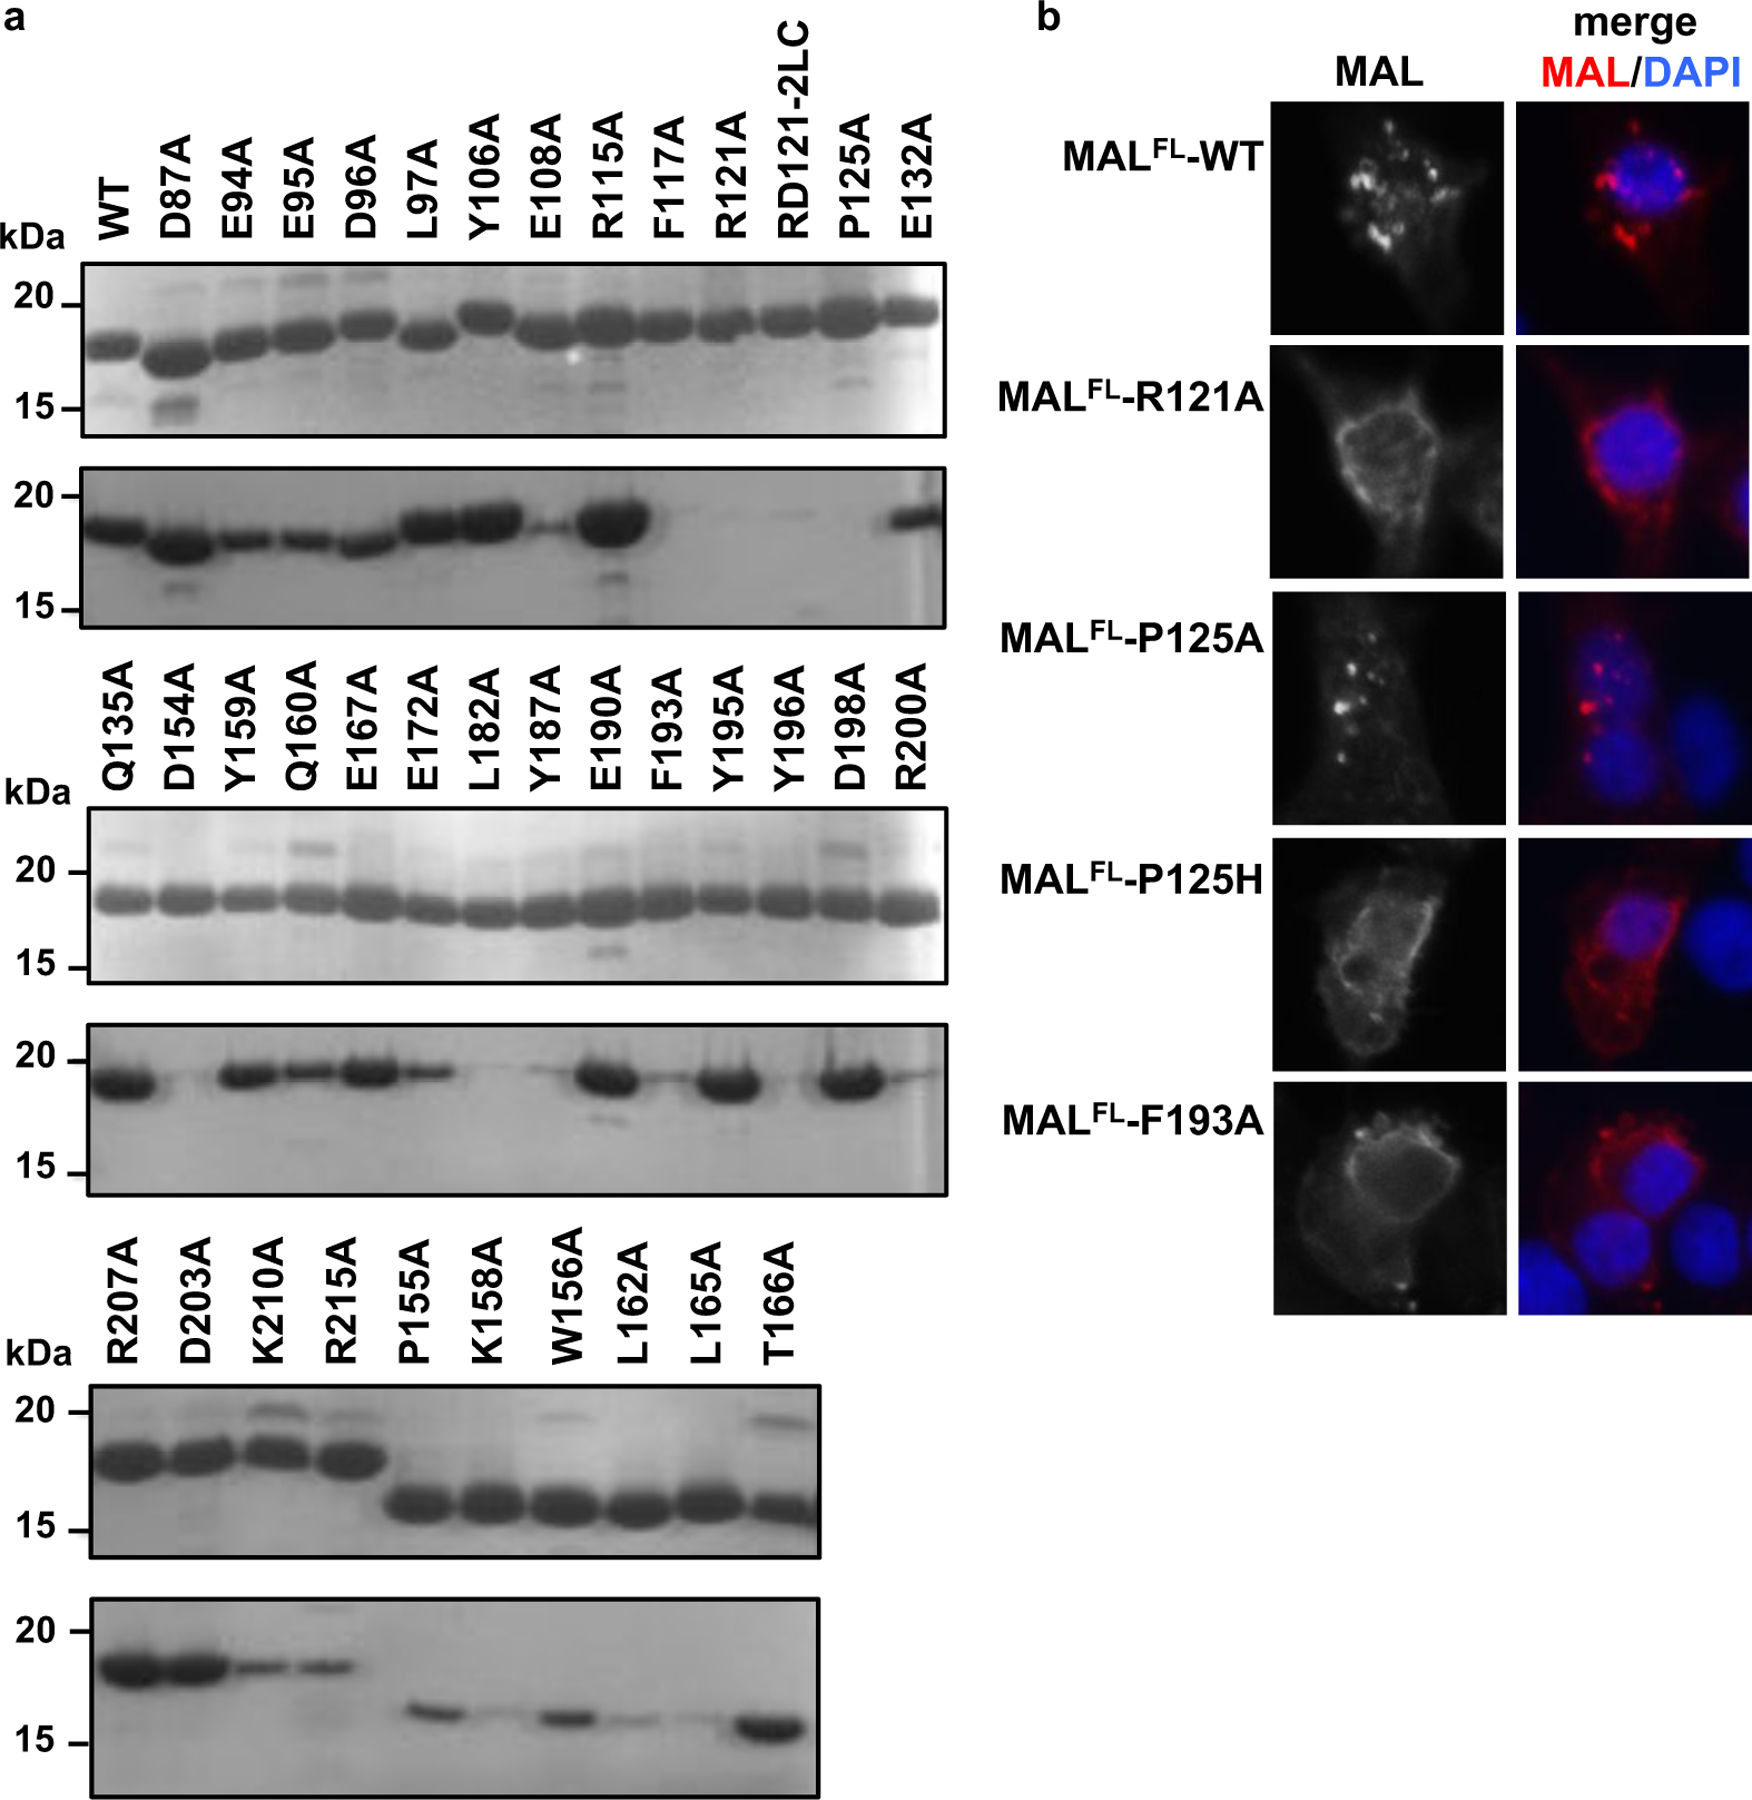
a, SDS-PAGE precipitation analysis of MALTIR mutants. Top gels: purified MALTIR (WT, wild-type; 10 µl of 100 µM protein loaded onto the gel). Bottom gels: insoluble fraction after incubation of MALTIR (100 µM) at 30°C for 12 h. The P155A, K158A, W156A, L162A, L165A and T166A mutant constructs were designed without N-terminal c-Myc tags and migrate faster on the gel. b, Clustering of Myc-tagged MALFL upon overexpression in HEK293 cells and effect of TIR-domain mutations on clustering of overexpressed Myc-tagged MALFL in HEK293 cells. Cells were immuno-stained with anti-Myc antibody (red) and the nuclei counter-stained with DAPI (blue). The original images of gels in (a) can be found in Supplementary Data Set 1.
Superposition of the NMR structure of MyD88 (modeled with the MALTIR BB-loop conformation) onto subunits of the MALTIR proto-filament suggests MyD88TIR can continue the head-to-tail arrangement, and a non-symmetrized projection map prepared from a cryoEM image of MALTIR-induced MyD88TIR assembly confirms that these assemblies are constructed from similar two-stranded head-to-tail arrays (Fig. 6a, Supplementary Fig. 8a-c). We mutated selected residues in the predicted intrastrand and interstrand interfaces of MyD88TIR (Supplementary Fig. 8d) and assayed their ability to form MALTIR-induced assemblies by monitoring the increase in turbidity (incubation at 30°C for 90 min). The P200A, W284A and R288A mutants (intrastrand interface), the K238A, L241A, S266A and R269A (interstrand interface) and the R196A and D197A mutants (BB-loop region) abolished MALTIR-induced assemblies of MyD88TIR (Fig. 6b, Supplementary Fig. 8e-f).
Figure 6. Structure-based mutations disrupt MyD88TIR:MyD88TIR interactions.
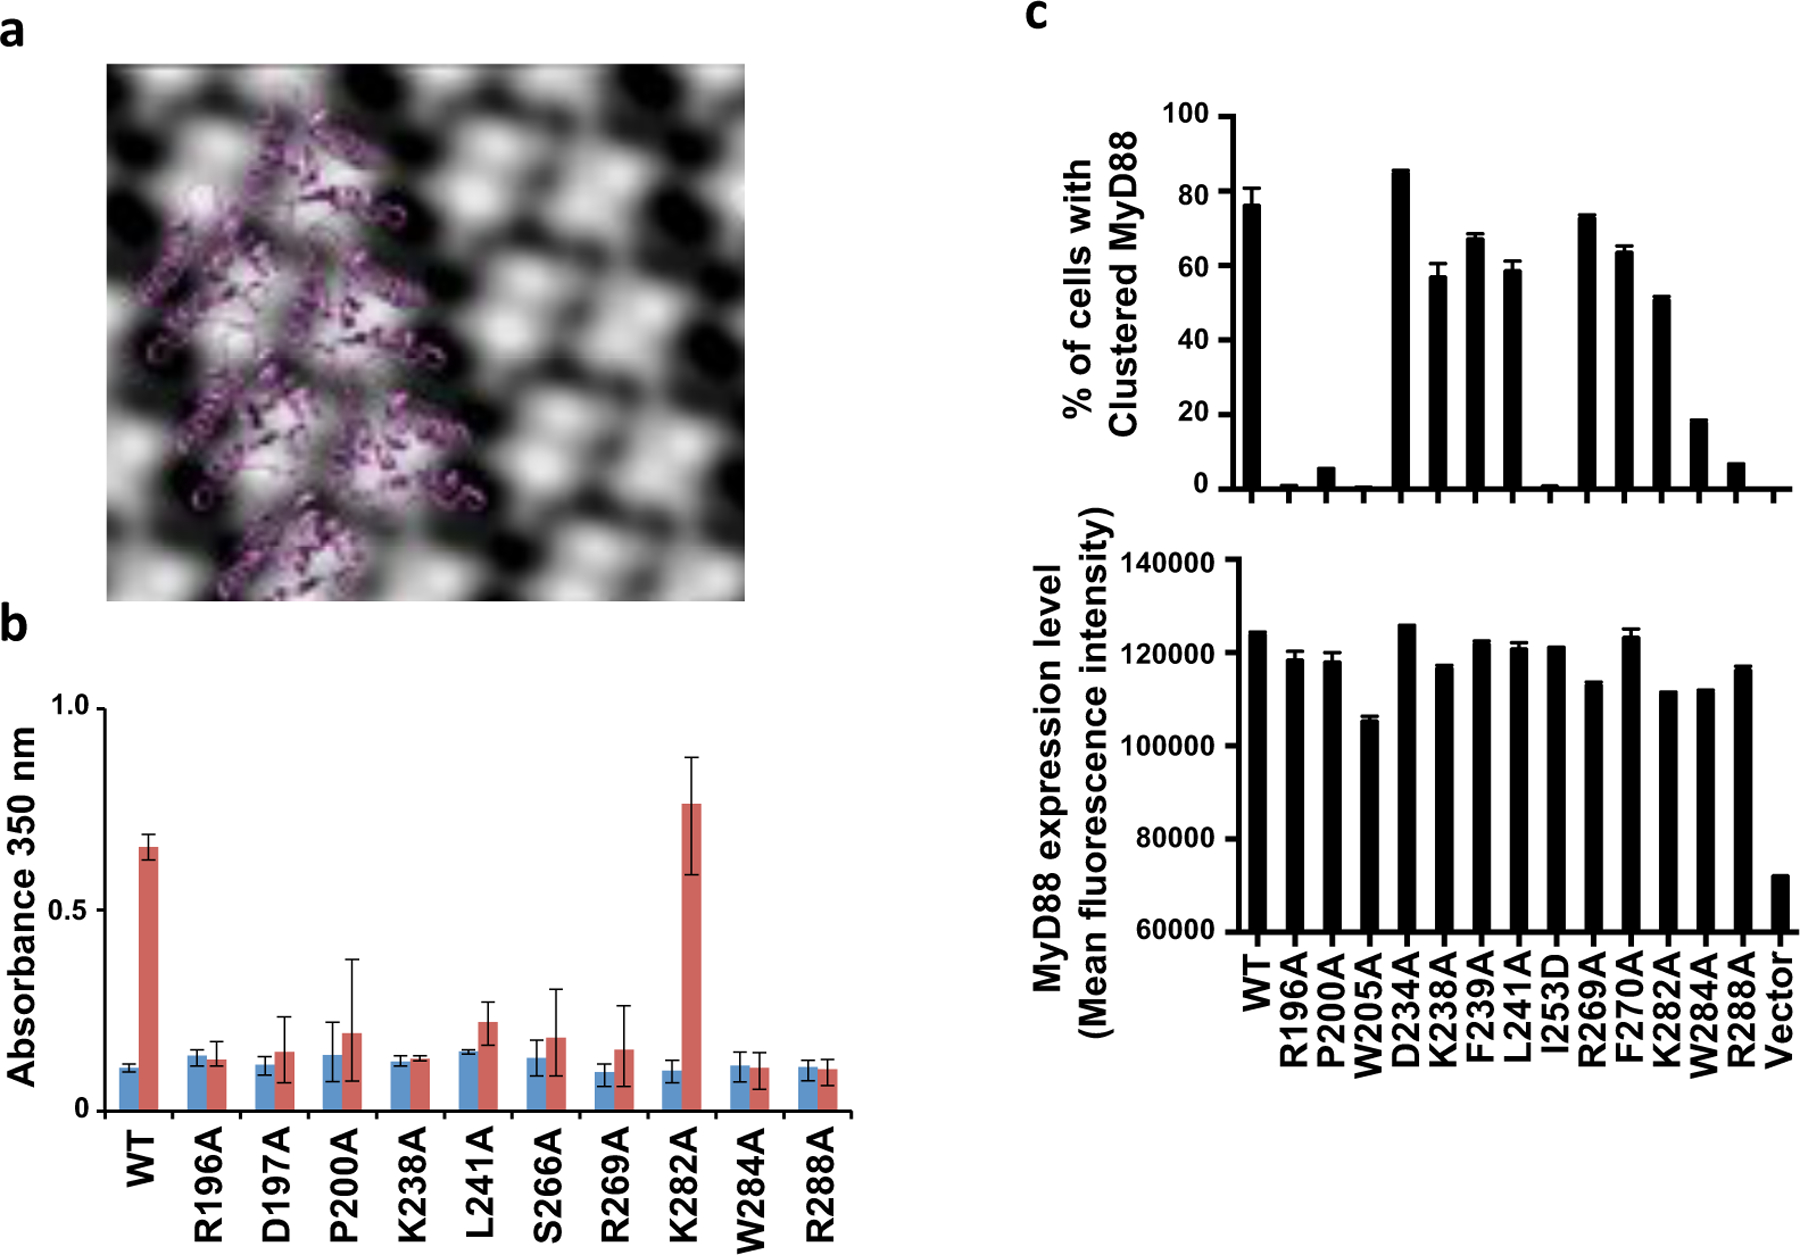
a, Non-symmetrized projection map (from cryo-EM) of the MyD88TIR assembly with a structure model of the MyD88TIR assembly overlayed. b, Effect of MyD88TIR alanine mutations on MAL-induced MyD88TIR assembly. Turbidity was measured during lag phase (blue bars) and after 90 min (red bars) for the MyD88TIR (60 µM) mutants after incubation with MALTIR (3.0 µM) at 30°C. Presented as mean ± range (N = 3). c, Effect of TIR-domain mutations on the ability of MyD88FL to cluster in HEK293 cells. HEK293 cells were transfected with V5-tagged MyD88FL (wild-type [WT] or mutant) and immuno-stained. Cells with a similar range of MyD88 expression levels were selected (lower panel). The percentage of cells with clustered MyD88 was quantified as in Fig. 1i and Supplementary Fig. 4d. The mean and range of duplicate transfections are shown (similar results were obtained in a second experiment).
Mutations in the intrastrand interface (P200A, I253D, W284A and R288A), and the BB loop (R196A) also disrupted the ability of MyD88FL to cluster in HEK293 cells (Fig. 6c). Mutations in the interstrand interface (D234A, K238A, F239A, L241A and F270A) had little effect and it is therefore likely that stabilizing interactions involving the DD of MyD88FL compensate for the effect of single mutations in the interface. However, extensive MyD88 mutagenesis data confirm the importance of both interactions for activation of NF-кB 22,23 (Table S3), suggesting that both interfaces are important for signaling.
Mutations in the BB-loop region that disrupt MAL-filament formation also prevent its induction of MyD88TIR assemblies (F117A, and R121A) and MyD88FL clustering in HEK293 cells (R121A, P125A, P125H) (Fig. 7a-c). However, mutations in the interstrand interface do not prevent MyD88TIR assembly formation (L162A, L165A, F193A, and W156Y159AA) or clustering of MyD88FL (F193A) in HEK293 cells. Overall, this suggests that the MAL BB-loop and intrastrand interface are more important for induction of MyD88 oligomerisation than the interstrand interface. Interestingly, introduction of the P125A mutation into MALFL does not affect MAL-induced clustering of MyD88FL, but it prevents MyD88FL clustering when introduced into MALTIR. This is in agreement with our observation that the P125A mutation does not affect the punctate localization of MALFL, but prevents MALTIR filament formation in vitro (Fig. 5a), and indicates that the effect of the mutation is subtle and can be overcome by the presence of the N-terminal region of MAL.
Figure 7: Structure-based mutagenesis of MALTIR:MyD88TIR interactions, and modeled TLR4TIR:TLR4TIR and MALTIR:TLR4TIR interactions.
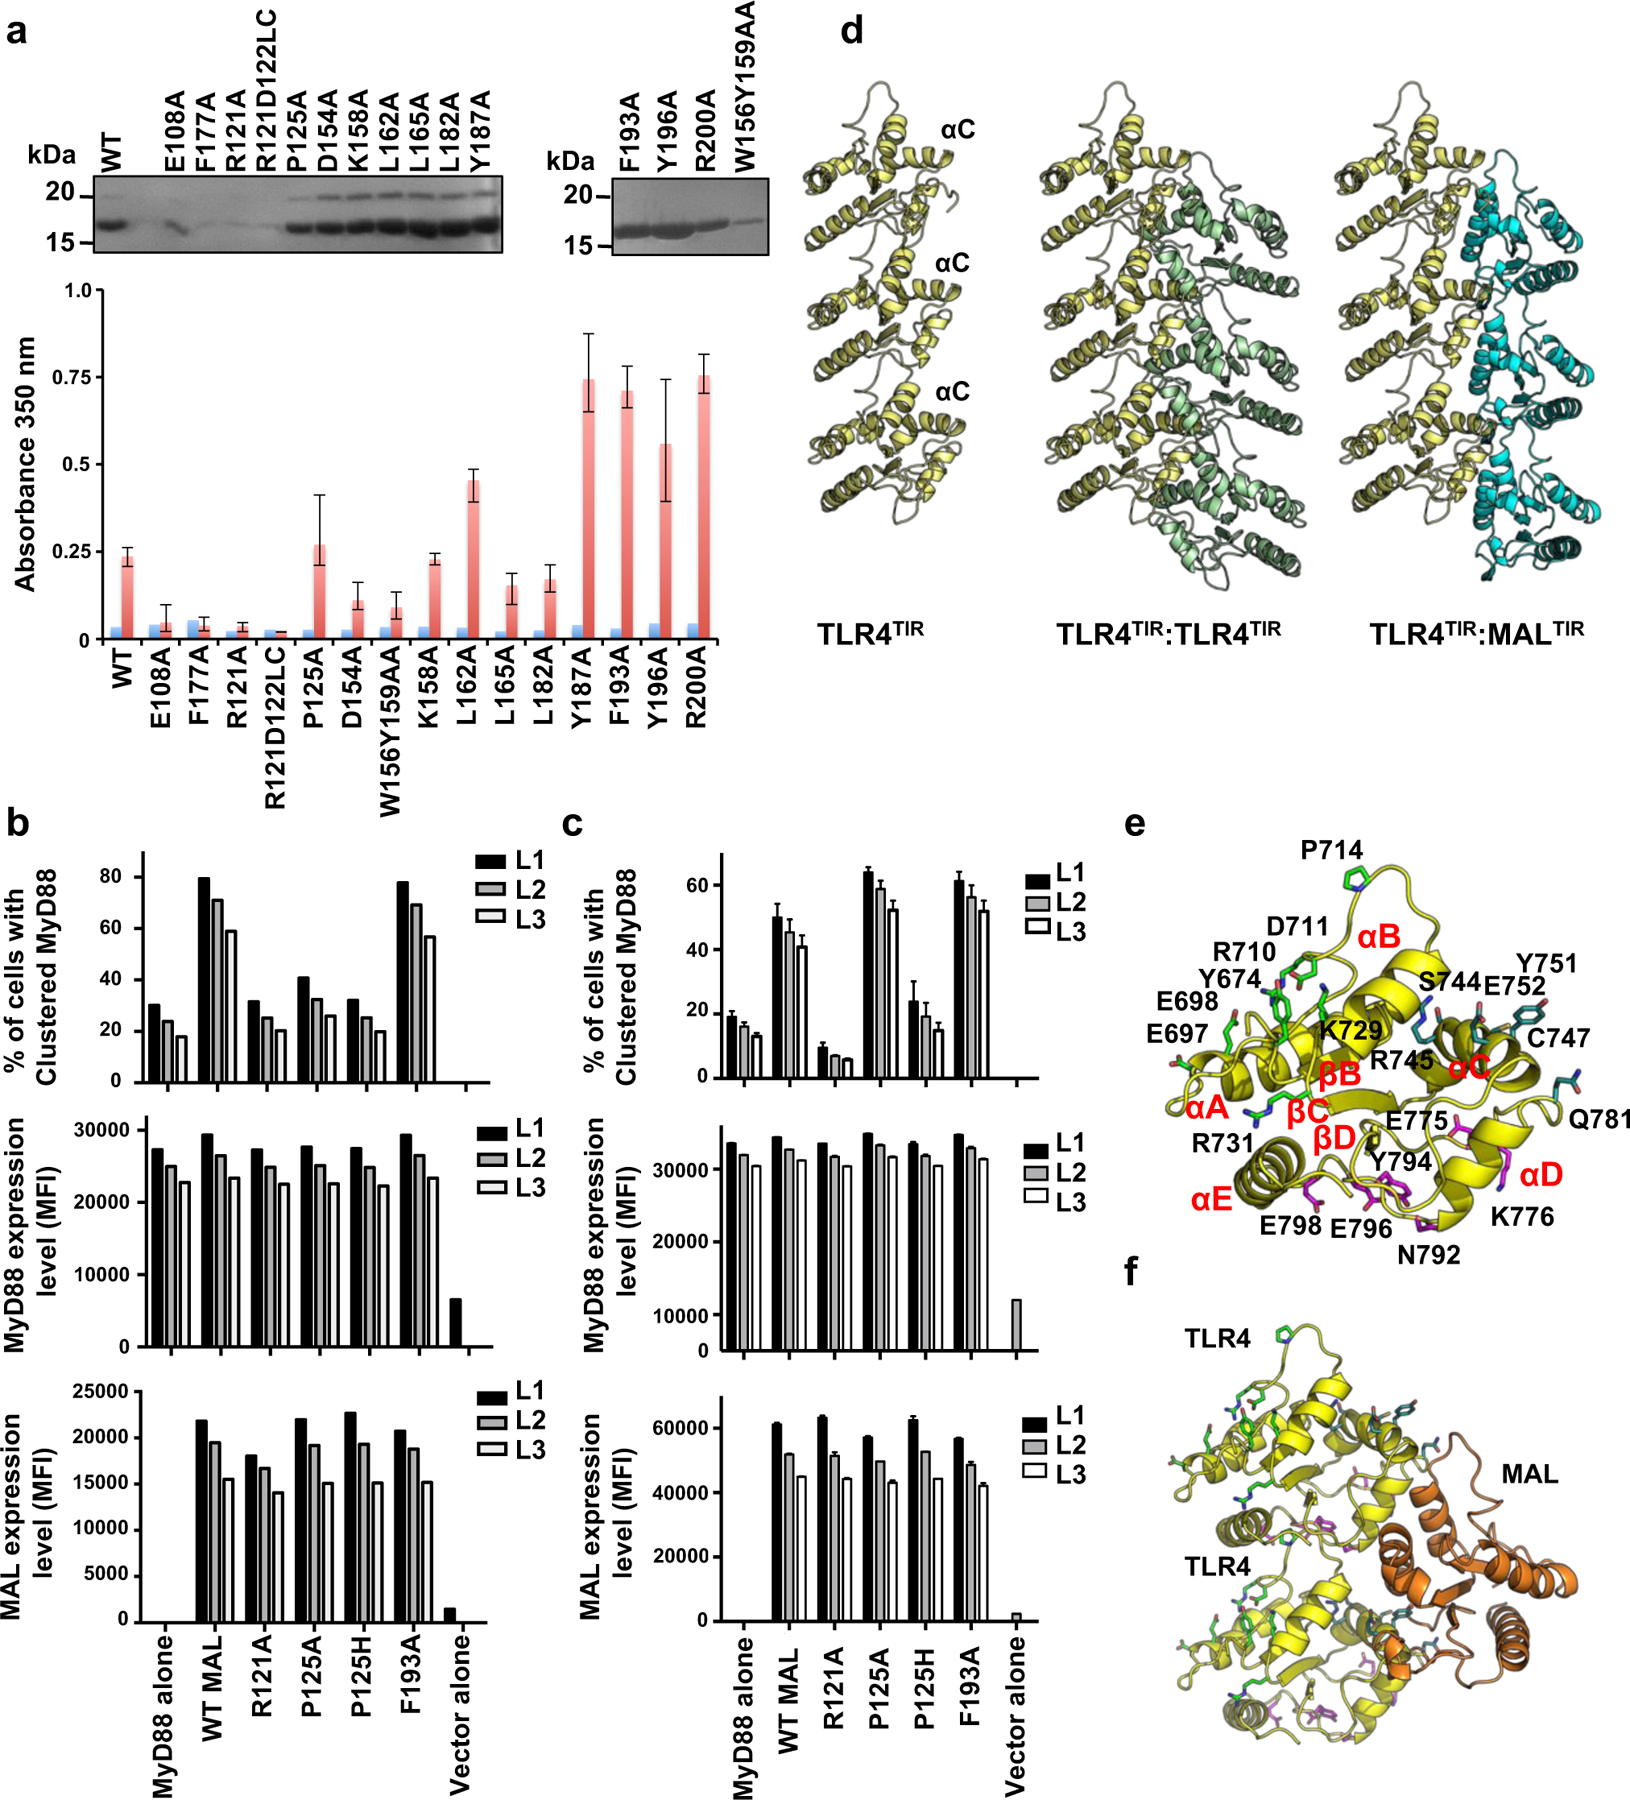
a, Effect of MALTIR alanine mutants on the induction of MyD88TIR assembly. Top panel: precipitation analysis of MyD88TIR (60 µM) incubated with MALTIR alanine mutants (3 µM) at 30°C for 12 h. The insoluble fraction of each mutant was analyzed by 15% SDS-PAGE. The K158A, L162A, L165A and W156Y159AA mutant constructs were designed without a N-terminal c-Myc tag and migrate faster on the gel and cannot be separated from MyD88TIR. Bottom panel: turbidity was measured during lag phase (blue bars) and after 1 h (red bars) for the MyD88TIR (60 µM) after incubation with MALTIR mutants (3 µM) at 30°C. Presented as mean ± range (N = 3). b-c, Effect of MALTIR mutations on the ability of MALTIR (b) and MALFL (c) to induce MyD88 clustering. HEK293 cells were transfected with empty vector or a plasmid expressing V5-tagged MyD88FL either alone or with a plasmid expressing wild-type or mutant Myc-tagged MAL. Cells were immuno-stained with anti-V5 and anti-Myc antibodies and the percentage of cells with clustered MyD88 quantified as in Fig. 1i and Supplementary 4d. Three separate windows of MyD88 expression levels (L1, L2, L3) were selected for analysis. Expression levels of MyD88 and MAL as well as the percentage of cells with MyD88 clusters were determined for each. In (d) the mean and range of duplicate transfections are shown and similar results were obtained in a second experiment. d, Model of TLR4TIR:TLR4TIR intrastrand interactions (left panel), implausible TLR4TIR:TLR4TIR interstrand interactions (middle panel) and TLR4TIR:MALTIR interstrand interactions (right panel) using the MALTIR proto-filament as a template. e-f, Mapping of residues important for TLR4TIR assembly formation 24 onto (e) a homology model of TLR4TIR and (f) a model of the TLR4TIR:MALTIR assembly. Residues in the three predicted binding sites24 are colored green, cyan and pink, respectively. The original images of gels in (a) can be found in Supplementary Data Set 1.
Modeled TLR4TIR:TLR4TIR, MALTIR:TLR4TIR and TRAMTIR:TRAM:TIR interactions
Superposition of the TLR4TIR model onto the MALTIR proto-filament shows that TLR4TIR can form intrastrand, but not interstrand interactions, due to significant clashes introduced by the αC helix, which has a different conformation in receptor TIR domains compared to MALTIR (Fig. 3g, Fig. 7d). A better fit is observed for interstrand TLR4TIR:MALTIR interactions (Fig. 7d), suggesting that TLR4TIR interacts with TLR4TIR and MALTIR through the intrastrand BE and interstrand interfaces, respectively, which is consistent with mutagenesis data 24 (Fig. 7e-f). The involvement of the interface in TLR4:MAL interaction is also supported by studies on the small molecule inhibitor TAK-242 25, which disrupts TLR4:MAL binding, specifically targeting C747 in the TLR4TIR αC helix.
The TIR domain of the adaptor TRAM, which has an analogous role to MAL in TRIF-dependent TLR4 signaling, has been reported to oligomerise and precipitate in aqueous solution at 200 µM 26. Oligomerisation was prevented by introducing a mutation in the BB loop (C117H), which has previously been established to be dominant-negative and prevent signaling 13. TRAM has an additional α-helix (αF) at the C-terminus and the conformation of the αC helical region is significantly different compared to MAL (Supplementary Fig. 8g). However, the conformations of the TRAM and MAL BB loops are similar and superposition of TRAMTIR onto subunits of the MALTIR proto-filament suggests that TRAM can form assemblies using similar intrastrand and interstrand interactions (Supplementary Fig. 8h-i). Comparison of MALTIR and TRAMTIR sequences also shows that the residues involved in the intrastrand interaction in the MALTIR proto-filament are conserved or similar in TRAM (Supplementary Fig. 5d-e). This suggests that TRAM could also form two-stranded head-to-tail assemblies as observed for MAL.
Discussion
TLRs respond to extremely low concentrations of PAMPs, suggesting that a small number of receptors can amplify cytosolic signaling cascades and induce a large transcriptional response 27–29. The molecular mechanisms underpinning this cascade are poorly understood and stoichiometric relationships between interacting TIR domain-containing proteins have been generally assumed. Here we show, for the first time, that the TIR domains of the TLR adaptors MAL and MyD88 can form large open-ended assemblies. Although it is not likely that MAL and MyD88 form assemblies of similar scale during normal signaling in the cell, the MALTIR proto-filament structure reflects the molecular mechanisms of TIR:TIR interactions during this process, as confirmed by extensive mutagenesis and cell assays. Similar to the conserved binding modes of different DDs in innate immunity pathways, the interactions likely represent a common mode of interaction of TIR domains in TLR pathways, enabling us to propose the following model of assembly formation during signaling by TLRs: (1) PAMP (e.g. LPS)-induced interaction of two or more TLR (e.g. TLR4) TIR domains through intrastrand contacts; (2) recruitment of another adaptor (e.g. MAL) TIR domain to the extended surface created by the TLR4TIR dimer through interstrand contacts; and (3) elongation of the trimer by recruiting additional adaptor (e.g. MAL, MyD88) TIR domains into a higher-order complex (Fig. 8). The linker between the DD and TIR domain of MyD88 is ~30 residues long, which is of sufficient length to enable DD clustering and formation of helical ternary complexes with the IRAKs (the myddosome) while tethered to the TIR-domain assembly.
Figure 8: Model for cooperative assembly of the TLR4 signalosome.
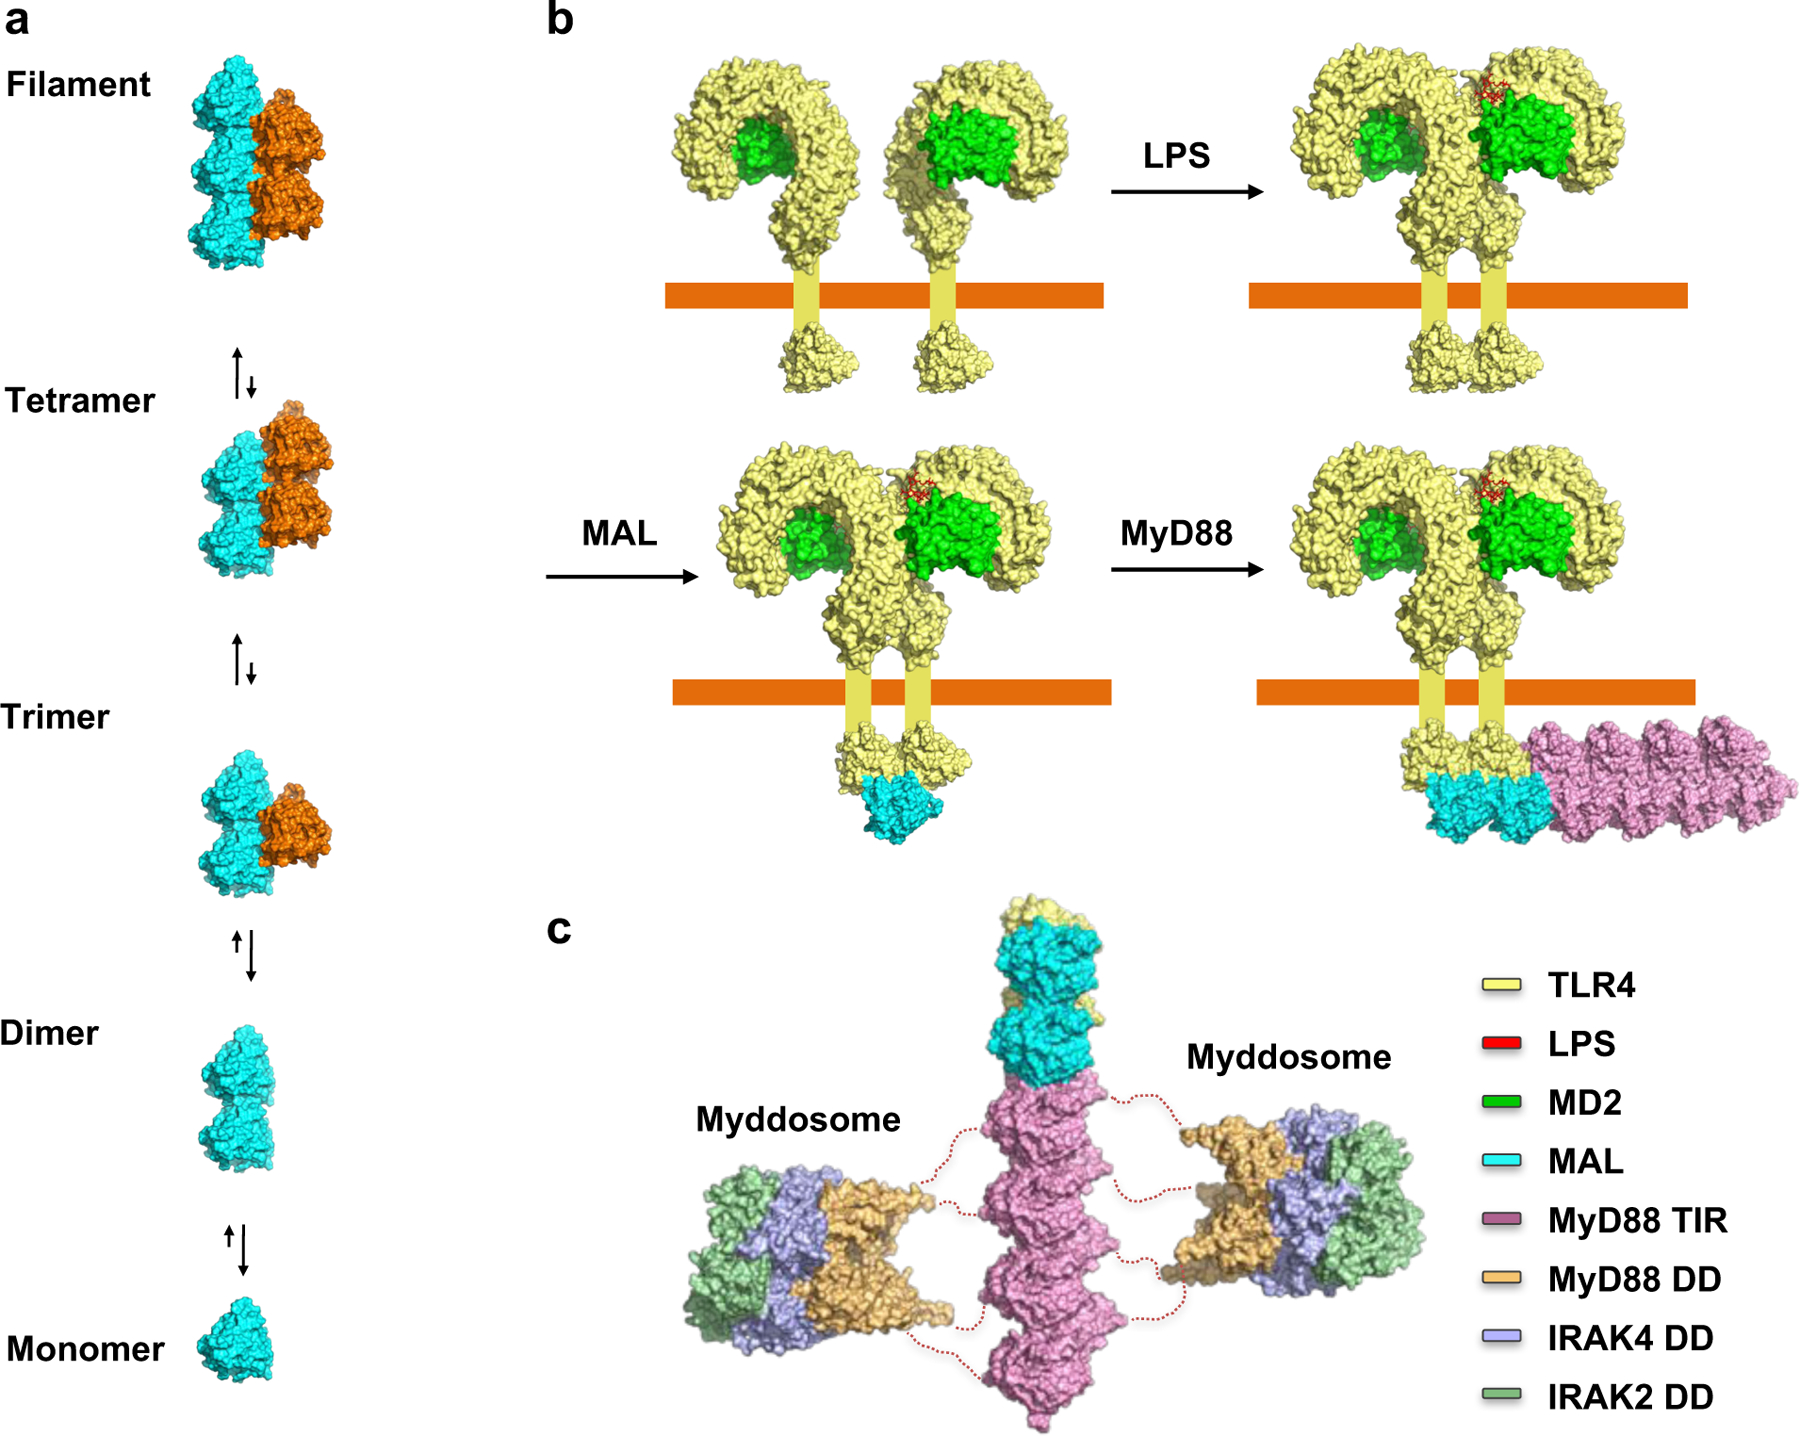
a, Cooperative TIR-domain assembly formation. b, Assembly model for open-ended TLR4:MAL:MyD88 complexes. c, MyD88TIR oligomerization leads to clustering of MyD88 DDs and subsequent recruitment of IRAKs through DD interactions.
This sequential and cooperative mechanism of signaling ensures an ultrasensitive response. Signaling by cooperative assembly formation (SCAF) extends to other innate-immunity pathways 30. The structure and kinetic data for MAL and MAL-induced MyD88 assembly formation suggest that the dimerization and trimerization steps are unfavorable and rate-limiting, whereas subsequent monomer additions are more favorable, rapid and cooperative. The extended binding surfaces and conformational changes of loop regions can contribute to the cooperativity of assembly formation. The conservation of residues in the intrastrand interaction interface in mammalian TIR domains suggests that the proposed assembly mechanism applies to other TLRs and the IL-1R family.
A number of mutations in the TIR domains of MAL, MyD88 and TLRs are associated with disease. In MyD88, the R196C polymorphism, which is associated with susceptibility to pyogenic bacterial infection during childhood 31, maps to the intrastrand interface region. The L252P gain-of-function variant of MyD88, which is found in diffuse large B-cell lymphoma and promotes tumor survival through enhanced NF-кB activation 32, also maps to the intrastrand interface. This mutation has been shown to spontaneously form cytosolic myddosome clusters in lymphoma cell-lines and may be able to form MyD88TIR assemblies in the absence of MAL and activated TLRs 33. The R753Q polymorphism in TLR2, which has been linked to increased incidence of tuberculosis and other infectious diseases 34, maps to the interstrand interface. Our work should provide new avenues for developing therapeutics for a range of disorders from inflammatory diseases to pathologies associated with infectious disease.
Although no common TIR-domain interaction interfaces have been observed in crystal structures of mammalian TIR domains, crystal-contact analysis, mutagenesis and molecular docking have been used in a number of studies to propose interaction interfaces and oligomerization models 21,23,24,26,35–40. While in detail these are all different from the interaction modes observed in the MALTIR proto-filament, reflecting the difficulty of structural modeling with sparse experimental data 41, the TIR:TIR interaction interfaces identified for TLR4 24 (Fig. 7e-f) and MyD88 23 are consistent with our model. As discussed earlier, the analogous interactions are also captured in the crystals of TRR-2TIR. The assemblies we report are energetically labile, and their symmetry may not be favorable for crystal formation. Structures of plant and bacterial TIR domains involved in effector-triggered immunity and subversion of TLR signaling, respectively, have revealed functionally relevant TIR:TIR interactions that involve highly conserved residues 9,41–46. These dimeric interfaces are symmetric and different to the asymmetric interactions observed in the MALTIR proto-filament, suggesting that the TIR-domain fold may have evolved to mediate different types of homotypic interactions.
Given that only four MyD88 molecules are the minimal requirement to form one layer of the myddosome for recruitment of IRAKs 5, it is likely that the TLR4:MAL:MyD88 TIR-domain assemblies in the cell are smaller than those reconstituted in vitro. In contrast to the DD signalosomes 30, the MAL filaments have a lower valency, are less stable and disassemble at low temperatures in solution. To avoid detrimental and inappropriate inflammatory responses, TLR signaling must be tightly regulated. It is thus likely that the reversibility of TIR-domain assembly formation may be a regulatory mechanism that contributes to the control of intensity and duration of TLR signaling.
Methods
Protein production and purification
The cDNAs of MALFL (residues 1–221, N-terminal c-Myc-tag), MALTIR (residues 79–221, N-terminal c-Myc-tag), TLR3TIR (residues 750–904), and TRAMTIR (residues 70–235) were amplified by PCR and cloned into the pMCSG7 expression vector 47 by ligation-independent cloning. The resulting constructs encode an N-terminal His6-tag and were verified by sequencing. MALFL, MALTIR, TLR3TIR, TRAMTIR, MyD88TIR (residues 155–296 in pET28b, C-terminal His6-tag 48), and TLR4TIR (residues 671–820, pET28b, N-terminal His6-tag) were produced in Escherichia coli BL21 (DE3) cells using auto-induction media. Cells were grown at 303–310 K until the mid-exponential phase (OD600nm of 0.6–0.8) was reached. The temperature was then reduced to 288–293 K and the cultures were grown for approximately 16 h before harvesting. The cells were lysed in 50 mM HEPES (pH 7–8), 500 mM NaCl and 1 mM DTT using sonication and the resulting supernatant was applied onto a 5 ml HisTrap FF column (GE Healthcare). Bound protein was eluted using a linear gradient of imidazole from 30 to 250 mM and the fractions containing the protein of interest were pooled, concentrated and applied onto a Superdex 75 HiLoad 26/60 gel-filtration column (GE Healthcare) pre-equilibrated with 10 mM HEPES pH 7.5 and 150 mM NaCl. The peak fractions were pooled, concentrated to a final concentration of 1–10 mg/ml and stored in aliquots at 193 K.
Alanine mutations in MALTIR were generated using PCR-based gene-synthesis 49,50, followed by cloning into the pMCSG7 vector. Similar to wild-type MALTIR, the alanine mutants were produced in E. coli BL21 (DE3) cells using auto-induction media, but they were purified in batch mode using Ni-NTA resin and an elution buffer containing 50 mM HEPES pH 7.5, 150 mM NaCl and 250 mM imidazole.
Alanine mutations of MyD88TIR were generated using traditional PCR and produced in E. coli BL21 (DE3) cells using auto-induction media. They were purified using the same method as described for wild-type MyD88TIR 48.
Assays for monitoring TIR-domain assembly formation in solution
Assembly formation was analyzed at 25–30°C in 10 mM HEPES pH 7.4, 150 mM NaCl by either monitoring the change in turbidity (absorbance at 350 nm) in a SpectraMax 250 96-well spectrophotometer (Molecular Devices), or by analyzing the soluble and insoluble fractions of the samples by SDS-PAGE.
Negative-stain EM
Four µl of sample from the turbidity or precipitation assays was applied to glow-discharged carbon-coated Formvar grids, adsorbed onto the grid surface for 2 min, followed by negative staining with 1% w/v uranyl acetate for 2 min, and then blotted and air-dried for 10–15 min. The samples were imaged on a JEOL JSM-1011 transmission electron microscope (TEM) operating at an accelerating voltage of 80 kV, or a FEI Tecnai 12 TEM operating at an accelerating voltage of 120 kV.
Cryo-EM of the MALTIR filament
Grids containing vitrified MALTIR filaments were imaged using an FEI Titan Krios TEM operating at 300 kV equipped with a 4k × 4k Falcon II direct detection device with a backthinned CMOS chip. Images were collected using a sampling of 1.05 Å/pixel. A total of 816 images were acquired on a Titan Krios operating at 300 kV, and the contrast transfer function (CTF) was estimated using CTFFIND3 51. Images with a poor CTF were rejected, and 446 images were used for further processing. The defocus values ranged from 0.5 to 3.0 µm. The phases in the micrographs were corrected by multiplying the images by the theoretical CTF (a Wiener filter in the limit of a very poor signal-to-noise ratio). Long filaments were cut from the images using e2helixboxer within the EMAN2 suite of programs 52. Overlapping boxes 384 pixels long, each shifted by 22 px (~ 1.5 times the axial rise), were cut from the long filaments, yielding 54,169 segments. The SPIDER software package 53 was used for most subsequent operations, including the IHRSR 54 implementation. The final volume, which had been multiplied by the CTF twice (once by the microscope, and once computationally when the phases were corrected), was modified in amplitudes by multiplying by the sum of the squared CTFs (a Wiener filter in the limit of a high signal-to-noise ratio). The volume was sharpened by applying a negative B-factor of 250 Å2.
Model building and refinement
The MAL NMR ensemble (PDB ID 2NDH), and the MAL crystal structures (PDB ID 2Y92 and 3UB2) modeled with either an AB loop 18 or BB loop (based on the TRAM NMR structure, PDB ID 2M1W) were initially docked into the density map using Chimera’s fit into density tool 55. The central parallel β-sheet of the crystal structure and NMR ensemble showed good agreement with the experimental data, but the conformations of some of the surrounding helices and loop regions were visibly different. While no density could be observed for the AB-loop region, continuous density was clearly visible in the region of the BB loop. However, the fit of the BB loop to the density was poor in both the NMR ensemble and the crystal structure modeled with a BB loop, suggesting that this region adopts a different conformation in the filament structure. To obtain a model of the MALTIR that fits better with the density map, two approaches were used in parallel: direct interactive modeling using interactive molecular dynamics flexible fitting (iMDFF) in VMD 56,57, and Rosetta density-guided rebuilding 58 as described below. The top models from both approaches were then combined and refined using RosettaCM 59, and the top RosettaCM model was subjected to a final refinement with iMDFF in VMD.
iMDFF/VMD:
The MAL crystal structure (PDB ID 2Y92) modeled with a BB loop (based on the TRAM NMR structure, PDB ID 2M1W) was initially docked into the density map using Chimera’s fit into density tool. iMDFF was carried out on an octameric fragment containing four chains from each of two adjacent proto-filaments – the minimal fragment that captures all protein-protein interfaces. Short contiguous segments of 10–20 residues were mobilized one at a time at 100 K under implicit solvent conditions, together with surrounding contacting residues. These were remodeled by interacting with the running simulation using a haptic interface, guided by fit to the density, favorability of side-chain interactions, and appearance of the Ramachandran plot. At regular intervals, symmetry was regularly re-imposed by first propagating modifications made to one dimer throughout the octamer, followed by ~50 ps equilibration and minimization to convergence with strong symmetry restraints on all heavy atoms.
Model building in Rosetta.
A crystal structure template of the TIR domain of MAL (PDB ID 3UB2) was initially docked into the density map using Chimera’s fit into density tool. Comparative modelling was carried out in RosettaCM using a sequence alignment generated with hhsearch. Comparative modelling was carried out in the full symmetric complex (a symmetry definition file was generated using make_symmdef_file.pl) and the experimental density was used in model building and refinement. From this starting point, 1000 independent rebuilding trajectories were run; the best was selected from the top 100 models by Rosetta energy, followed by the top 5 models by fit to data (using the integrated Fourier-shell correlation [FSC] between 10 Å and 5.5 Å). These five models were then subjected to iterative local refinement following a previously published protocol 58; from each of the 5 starting models, 100 models were generated, and the top 5 were chosen using the previously described criteria.
Model recombination in Rosetta:
Following visual inspection, both iMDFF models and Rosetta models had local features that seemed to better explain the experimental data in specific regions, likely due to each method exploring different parts of conformational space. We wanted to build a model that combined features from both models. Therefore, we again used RosettaCM to build a final model, using as input both the MDFF model and the 5 Rosetta models described previously. Given multiple input structures, RosettaCM combines segments of both, attempting to minimize the total energy of the system. As before, this was done in the complete symmetric complex, with a score term assessing agreement to experimental data enabled within Rosetta. In this final model recombination, another 1000 models were generated, the top 100 were selected by Rosetta energy, and the top model was selected by integrated high-resolution FSC.
Cryo-EM of the MyD88TIR assemblies
For cryo-EM of the MyD88TIR domain assemblies, 4 µl of protein sample was transferred onto a lacey carbon grid, in an FEI Vitrobot Mark 3, with the chamber set to 25°C and 100% humidity, and plunged into liquid ethane. Frozen/vitrified samples were viewed on a Tecnai F30 microscope operating at 300 kV, and imaged at 59,000x magnification with a Direct Electron LC1100 4k x 4k camera (Direct Electron, San Diego, USA), using the low-dose mode of SerialEM image acquisition software (http://bio3d.colorado.edu/SerialEM/). Micrographs of the MyD88TIR assemblies were treated as 2D crystals, and auto-indexing (with manual refinement), unbending (to correct for lattice distortions), and corrections for the contrast transfer function were performed with the program 2dx 60.
Structural analysis and modeling
Structural analyses were performed using Chimera 55, PyMOL (The PyMOL Molecular Graphics System, Version 1.7.4 Schrödinger, LLC), DALI 61, PISA 62, and PDBeFold 63. Homology models were made using Modeller 64, multiple sequence alignments were prepared using MUSCLE 65, and alignments were formatted using ESPript 66.
Constructs for mammalian expression and cell culture
Full-length human MAL and MyD88, the TIR domains of human MAL (residues 79–221) and MyD88 (residues 155–296), and the N-terminal region of MAL (residues 1–79) were cloned into the pEF6/V5-His-TOPO vector. The MAL constructs encoded an N-terminal c-Myc-tag, while the MyD88 constructs encoded a C-terminal V5-His-tag. Mutants of MAL and MyD88 were generated by traditional PCR. All constructs were sequence-verified. The human MALFL template encoded a naturally occurring single-nucleotide polymorphism (G164A) resulting in a S55N amino-acid change. This amino acid change has previously been established to have no effect on MAL-induced NF-αB activation or MAL localization 67. HEK293 cells were obtained from the ATCC, were tested for mycoplasma, and maintained as previously described 68.
Microscopy
HEK293 cells were plated on poly-L-lysine coated coverslips, transfected and immuno-stained as described previously 68. Myc-tagged MAL was detected using mouse monoclonal (9B11) anti-Myc antibody (Cell Signaling Technology) at a 1:1000 dilution overnight at 4°C followed by goat anti-mouse–Alexa Fluor-555 (Life Technologies) at a 1:1000 dilution for 1 h at room temperature. V5-tagged MyD88 was detected using rabbit monoclonal (D3H8Q) anti-V5 antibody (Cell Signaling Technology) at a 1:500 dilution overnight at 4°C followed by goat anti-rabbit–Alexa Fluor-488 (Life Technologies) at a 1:1000 dilution for 1 h at room temperature. Immuno-stained cells were viewed on either a Zeiss Axioplan 2 microscope and captured using an Axiocam 506 colour/greyscale digital imaging camera with Zeiss Zen software or on a Zeiss LSM 710 laser-scanning confocal microscope also using the Zeiss Zen software. Images from the LSM 710 were merged using ImageJ. Brightness and contrast of all images were adjusted using Adobe Photoshop CS6 software.
Evaluation of MyD88 clustering in HEK293 cells by flow cytometry
Assays were performed using similar conditions to those used to evaluate ASC speck formation 17. To assess the ability of wild-type or mutant MyD88 to form clusters, HEK293 cells (200,000) were plated in 12-well plates and grown overnight. Transfections for each well contained empty vector alone or 200 ng of plasmid expressing V5-tagged wild-type or mutant MyD88. To assess MAL-induced clustering of Myd88, 200 ng of plasmid expressing Myc-tagged MAL was co-transfected with the V5-tagged MyD88-expressing plasmid. Empty vector was added so that the final amount of DNA in each sample was 800 ng. DNA-Lipofectamine complexes were added to cells followed by centrifugation of the plates at 700 x g for 10 min. Cells were harvested after ~16 h and fixed for 15 min with 75% ethanol. Cells were immuno-stained using the mouse monoclonal (9B11) anti-Myc (Cell Signaling Technology) at a 1:2000 dilution and the rabbit monoclonal (D3H8Q) anti-V5 antibody (Cell Signaling Technology) overnight followed by goat anti-rabbit–Alexa Fluor-488 (Life Technologies) and goat anti-mouse Alexa Fluor-647 (Life Technologies) at a 1:10,000 dilution for 60 min. The immuno-stained cells were run on a BD Accuri C6 flow cytometerV5-positive or Myc- and V5-double positive cells were gated and used for further analysis of speck formation using height-to-area analysis. The percentage of speck-forming cells was determined in a window with a broad range of expression levels or low MyD88 (V5) expression as indicated. The data were analyzed using the FlowJo software.
Cell-free expression and seeding of polymerization of MALFL and MyD88FL
MALFL, MALTIR, MyD88FL and MyD88TIR were expressed in vitro using a cell-free protein production system based on Leishmania tarentolae 69. The proteins were tagged with GFP at the N-terminus and single-molecule confocal spectroscopy was performed on a home-made microscope to measure protein aggregation in the cell-free extracts 70. Protein expression levels were measured based on the average fluorescence, and protein oligomers and filaments were detected as large, very intense bursts of fluorescence. Two-color seeding experiments were performed using the same detection principle.
Preparation of Leishmania tarentolae cell-free extracts
Leishmania tarentolae cell-free extracts (LTE) were produced as previously described 69,71,72. Briefly, Leishmania tarentolae Parrot strain was obtained as LEXSY host P10 from Jena Bioscience GmbH, Jena, Germany and cultured in TBGG medium containing 0.2% v/v penicillin/streptomycin (Life Technologies) and 0.05% w/v hemin (MP Biomedical). Cells were harvested by centrifugation at 2500 x g, washed twice by re-suspension in 45 mM HEPES, pH 7.6, containing 250 mM sucrose, 100 mM potassium acetate and 3 mM magnesium acetate and re-suspended to 0.25 g cells/g suspension. Cells were placed in a cell disruption vessel (Parr Instruments, USA) and incubated under 7000 kPa nitrogen for 45 minutes, then lysed by rapid release of pressure. The lysate was clarified by sequential centrifugation at 10 000 x g and 30 000 x g and anti-splice leader DNA leader oligonucleotide was added to 10 µM. The lysate was then desalted into 45 mM HEPES, pH 7.6, containing 100 mM potassium acetate and 3 mM magnesium acetate, supplemented with a coupled translation/transcription feeding solution and snap-frozen until required.
Gateway plasmids for cell-free protein expression
The proteins were cloned into the following cell-free expression Gateway destination vectors 73: N-terminal GFP-tagged (pCellFree_G03), N-terminal mCherry-myc-tagged (pCellFree_G07) or C-terminal mCherry-cMyc-tagged (pCellFree_G08). The open reading frames (ORFs) corresponding to full-length MAL and full-length MyD88 were obtained from the human ORFeome at the Diamantina Institute, UQ 74, the TIR-domain constructs for both proteins were sub-cloned from the bacterial vectors described above. Transfer of ORFs between vectors was carried out using Gateway PCR cloning protocol, based on insert amplification with primers to attB1 and attB2 sites (forward primer: GGGGACAAGTTTGTACAAAAAAGCAGGCTT (nnn)18–25, reverse primer: (nnnn)18–25AACCCAGCTTTCTTGTACAAAGTGGTCCCC) 75.
Single-molecule fluorescence spectroscopy
Single-molecule spectroscopy was performed as described previously 71,76, directly in the cell-free expression mixtures, without any purification steps. Labelling of the proteins for fluorescence measurements was simplified by the use of genetically encoded fluorophores (GFP and mCherry). The principle of the single-molecule fluorescence technique is the following: on a confocal microscope, two overlapping lasers exciting GFP and mCherry fluorophores are used to create a small detection volume in which GFP and mCherry fluorescence emitted by proteins is recorded separately on two single photon-counting detectors. As proteins are freely diffusing, they constantly enter and exit the detection volume of the microscope, creating fluctuations in the fluorescence intensity collected. The amplitude and frequency of these fluctuations are quantified to characterize the oligomerization and aggregation of proteins 70.
In Supplementary Fig. 2, MAL and MyD88 proteins were expressed in LTE by adding the template DNA to 10 µL lysate to a final concentration of 20 nM. The reaction was kept at 27°C for 2.5 h, then the mixture was diluted 10 times in 25 mM HEPES, 50 mM NaCl. A volume of 20 µL of each sample was placed into a custom-made 192-well silicone plate with a 70 × 80 mm glass coverslip (ProSciTech). Plates were analyzed at room temperature on a Zeiss Axio Observer microscope with a custom-built data-acquisition setup. A 488 nm laser is focused in solution using a 40x/1.2 NA water immersion objective (Zeiss). Fluorescence was collected and separated using a 565 nm dichroic mirror and was passed through a 525/20 nm band-pass filter.
Single-molecule fluorescence spectroscopy: seeding experiments
In Supplementary Fig. 2, mCherry-tagged “seeds” of MyD88FL and MALFL were purified using N-terminally tagged MyD88FL and C-terminally tagged MALFL. Proteins were expressed in LTE by addition of the respective template DNAs in 10 µL lysate at a final concentration of 40 nM. The expression was allowed to be carried out for 3.5 h at 27°C. To produce the “seeds”, the samples were then spun down at 13,000 x g for 5 min. 80% of the supernatant was discarded and the solution was sonicated for 1 min in a water bath. In the meantime, GFP-tagged MyD88FL or MALFL were expressed for 2.5 h, from 2 nM DNA template, and diluted 10 times before being placed under the microscope. Two lasers (488 nm and 561 nm) were focused in solution using a 40x/1.2 NA water immersion objective (Zeiss). Fluorescence was collected and separated using a 565 nm dichroic mirror; signal from GFP was passed through a 525/20 nm band-pass filter, while fluorescence from mCherry was filtered by a 580 nm long-pass filter. The fluorescence of the two channels was recorded simultaneously in 1 ms time bins. Fluorescence time traces were recorded for 75 s before 1 µL of “seeds” was introduced into the mixture and the measurements were carried out for an additional 300 s.
Data availability
The 3D cryo-EM density map of MALTIR has been deposited in the Electron Microscopy Data Bank (EMDB) under accession numbers EMD-8625. Atomic coordinates for MALTIR have been deposited in the Protein Data Bank (PDB) under accession number 5UZB.
Supplementary Material
Acknowledgements
We thank Tom Monie for providing the TLR4TIR expression constructs, Darren Brown and Jenny Stow for early cell work, and the Kobe lab members for discussion. This work was supported by the National Health and Medical Research Council (NHMRC grants 1003326, 1107804 to BK, AM, MM, TV; 1071659 to BK; 1108859 to YG, ES, TV) and NIH EB001567 (to EHE). BK is NHMRC Principal Research Fellow (1003325, 1110971), KJS is NHMRC Senior Research Fellow (1059729).
Footnotes
Note: Any Supplementary Information and Source Data files are available in the online version of the paper.
Competing financial interests
The authors declare no competing financial interests.
References
- 1.Akira S, Uematsu S & Takeuchi O Pathogen recognition and innate immunity. Cell 124, 783–801 (2006). [DOI] [PubMed] [Google Scholar]
- 2.Ve T, Gay NJ, Mansell A, Kobe B & Kellie S Adaptors in Toll-like receptor signaling and their potential as therapeutic targets. Curr Drug Targets 13, 1360–74 (2012). [DOI] [PubMed] [Google Scholar]
- 3.Gay NJ, Symmons MF, Gangloff M & Bryant CE Assembly and localization of Toll-like receptor signalling complexes. Nat Rev Immunol 14, 546–58 (2014). [DOI] [PubMed] [Google Scholar]
- 4.Hennessy EJ, Parker AE & O’Neill LA Targeting Toll-like receptors: emerging therapeutics? Nat Rev Drug Discov 9, 293–307 (2010). [DOI] [PubMed] [Google Scholar]
- 5.Lin SC, Lo YC & Wu H Helical assembly in the MyD88-IRAK4-IRAK2 complex in TLR/IL-1R signalling. Nature 465, 885–90 (2010). [DOI] [PMC free article] [PubMed] [Google Scholar]
- 6.Ferrao R et al. IRAK4 dimerization and trans-autophosphorylation are induced by Myddosome assembly. Mol Cell 55, 891–903 (2014). [DOI] [PMC free article] [PubMed] [Google Scholar]
- 7.Bonham KS et al. A promiscuous lipid-binding protein diversifies the subcellular sites of toll-like receptor signal transduction. Cell 156, 705–16 (2014). [DOI] [PMC free article] [PubMed] [Google Scholar]
- 8.xu Y et al. Structural basis for signal transduction by the Toll/interleukin-1 receptor domains. Nature 408, 111–5 (2000). [DOI] [PubMed] [Google Scholar]
- 9.Ve T, Williams SJ & Kobe B Structure and function of Toll/interleukin-1 receptor/resistance protein (TIR) domains. Apoptosis 20, 250–61 (2015). [DOI] [PubMed] [Google Scholar]
- 10.Poltorak A et al. Defective LPS signaling in C3H/HeJ and C57BL/10ScCr mice: mutations in Tlr4 gene. Science 282, 2085–8 (1998). [DOI] [PubMed] [Google Scholar]
- 11.Ozinsky A et al. The repertoire for pattern recognition of pathogens by the innate immune system is defined by cooperation between toll-like receptors. Proc Natl Acad Sci U S A 97, 13766–71 (2000). [DOI] [PMC free article] [PubMed] [Google Scholar]
- 12.Fitzgerald KA et al. Mal (MyD88-adapter-like) is required for Toll-like receptor-4 signal transduction. Nature 413, 78–83 (2001). [DOI] [PubMed] [Google Scholar]
- 13.Oshiumi H et al. TIR-containing adapter molecule (TICAM)-2, a bridging adapter recruiting to toll-like receptor 4 TICAM-1 that induces interferon-beta. J Biol Chem 278, 49751–62 (2003). [DOI] [PubMed] [Google Scholar]
- 14.Fekonja O, Bencina M & Jerala R Toll/interleukin-1 receptor domain dimers as the platform for activation and enhanced inhibition of Toll-like receptor signaling. J Biol Chem 287, 30993–1002 (2012). [DOI] [PMC free article] [PubMed] [Google Scholar]
- 15.Nagpal K et al. Natural loss-of-function mutation of myeloid differentiation protein 88 disrupts its ability to form Myddosomes. J Biol Chem 286, 11875–82 (2011). [DOI] [PMC free article] [PubMed] [Google Scholar]
- 16.Into T, Inomata M, Niida S, Murakami Y & Shibata K Regulation of MyD88 aggregation and the MyD88-dependent signaling pathway by sequestosome 1 and histone deacetylase 6. J Biol Chem 285, 35759–69 (2010). [DOI] [PMC free article] [PubMed] [Google Scholar]
- 17.Sester DP et al. A novel flow cytometric method to assess inflammasome formation. J Immunol 194, 455–62 (2015). [DOI] [PubMed] [Google Scholar]
- 18.Valkov E et al. Crystal structure of Toll-like receptor adaptor MAL/TIRAP reveals the molecular basis for signal transduction and disease protection. Proc Natl Acad Sci U S A 108, 14879–84 (2011). [DOI] [PMC free article] [PubMed] [Google Scholar]
- 19.Kagan JC & Medzhitov R Phosphoinositide-mediated adaptor recruitment controls Toll-like receptor signaling. Cell 125, 943–55 (2006). [DOI] [PubMed] [Google Scholar]
- 20.Lin Z, Lu J, Zhou W & Shen Y Structural insights into TIR domain specificity of the bridging adaptor Mal in TLR4 signaling. PLoS One 7, e34202 (2012). [DOI] [PMC free article] [PubMed] [Google Scholar]
- 21.Bovijn C et al. Identification of binding sites for myeloid differentiation primary response gene 88 (MyD88) and Toll-like receptor 4 in MyD88 adapter-like (Mal). J Biol Chem 288, 12054–66 (2013). [DOI] [PMC free article] [PubMed] [Google Scholar]
- 22.Loiarro M et al. Mutational analysis identifies residues crucial for homodimerization of myeloid differentiation factor 88 (MyD88) and for its function in immune cells. J Biol Chem 288, 30210–22 (2013). [DOI] [PMC free article] [PubMed] [Google Scholar]
- 23.Vyncke L et al. Reconstructing the TIR side of the Myddosome: a paradigm for TIR-TIR interactions. Structure 24, 437–47 (2016). [DOI] [PubMed] [Google Scholar]
- 24.Bovijn C et al. Identification of interaction sites for dimerization and adapter recruitment in Toll/interleukin-1 receptor (TIR) domain of Toll-like receptor 4. J Biol Chem 287, 4088–98 (2012). [DOI] [PMC free article] [PubMed] [Google Scholar]
- 25.Matsunaga N, Tsuchimori N, Matsumoto T & Ii M TAK-242 (resatorvid), a small-molecule inhibitor of Toll-like receptor (TLR) 4 signaling, binds selectively to TLR4 and interferes with interactions between TLR4 and its adaptor molecules. Mol Pharmacol 79, 34–41 (2011). [DOI] [PubMed] [Google Scholar]
- 26.Enokizono Y et al. Structures and interface mapping of the TIR domain-containing adaptor molecules involved in interferon signaling. Proc Natl Acad Sci U S A 110, 19908–13 (2013). [DOI] [PMC free article] [PubMed] [Google Scholar]
- 27.Stylianou E et al. Interleukin 1 induces NF-kappa B through its type I but not its type II receptor in lymphocytes. J Biol Chem 267, 15836–41 (1992). [PubMed] [Google Scholar]
- 28.Gioannini TL & Weiss JP Regulation of interactions of Gram-negative bacterial endotoxins with mammalian cells. Immunol Res 39, 249–60 (2007). [DOI] [PubMed] [Google Scholar]
- 29.Cheng Z, Taylor B, Ourthiague DR & Hoffmann A Distinct single-cell signaling characteristics are conferred by the MyD88 and TRIF pathways during TLR4 activation. Sci Signal 8, ra69 (2015). [DOI] [PMC free article] [PubMed] [Google Scholar]
- 30.Wu H & Fuxreiter M The structure and dynamics of higher-order assemblies: amyloids, signalosomes, and granules. Cell 165, 1055–66 (2016). [DOI] [PMC free article] [PubMed] [Google Scholar]
- 31.von Bernuth H et al. Pyogenic bacterial infections in humans with MyD88 deficiency. Science 321, 691–6 (2008). [DOI] [PMC free article] [PubMed] [Google Scholar]
- 32.Ngo VN et al. Oncogenically active MYD88 mutations in human lymphoma. Nature 470, 115–9 (2011). [DOI] [PMC free article] [PubMed] [Google Scholar]
- 33.Avbelj M et al. Activation of lymphoma-associated MyD88 mutations via allostery-induced TIR-domain oligomerization. Blood 124, 3896–904 (2014). [DOI] [PMC free article] [PubMed] [Google Scholar]
- 34.Ogus AC et al. The Arg753GLn polymorphism of the human toll-like receptor 2 gene in tuberculosis disease. Eur Respir J 23, 219–23 (2004). [DOI] [PubMed] [Google Scholar]
- 35.Guven-Maiorov E et al. The architecture of the TIR domain signalosome in the Toll-like receptor-4 signaling pathway. Sci Rep 5, 13128 (2015). [DOI] [PMC free article] [PubMed] [Google Scholar]
- 36.Khan JA, Brint EK, O’Neill LA & Tong L Crystal structure of the Toll/interleukin-1 receptor domain of human IL-1RAPL. J Biol Chem 279, 31664–70 (2004). [DOI] [PubMed] [Google Scholar]
- 37.Nunez Miguel R et al. A dimer of the Toll-like receptor 4 cytoplasmic domain provides a specific scaffold for the recruitment of signalling adaptor proteins. PLoS One 2, e788 (2007). [DOI] [PMC free article] [PubMed] [Google Scholar]
- 38.Ohnishi H et al. Structural basis for the multiple interactions of the MyD88 TIR domain in TLR4 signaling. Proc Natl Acad Sci U S A 106, 10260–5 (2009). [DOI] [PMC free article] [PubMed] [Google Scholar]
- 39.Tao x., xu Y, Zheng Y, Beg AA & Tong L An extensively associated dimer in the structure of the C713S mutant of the TIR domain of human TLR2. Biochem Biophys Res Commun 299, 216–21 (2002). [DOI] [PubMed] [Google Scholar]
- 40.Toshchakov VY, Szmacinski H, Couture LA, Lakowicz JR & Vogel SN Targeting TLR4 signaling by TLR4 Toll/IL-1 receptor domain-derived decoy peptides: identification of the TLR4 Toll/IL-1 receptor domain dimerization interface. J Immunol 186, 4819–27 (2011). [DOI] [PMC free article] [PubMed] [Google Scholar]
- 41.Nimma S, Ve T, Williams SJ & Kobe B Towards the structure of the TIR-domain signalosome. Curr Opin Struct Biol 43, 122–130 (2017). [DOI] [PubMed] [Google Scholar]
- 42.Alaidarous M et al. Mechanism of bacterial interference with TLR4 signaling by Brucella Toll/interleukin-1 receptor domain-containing protein TcpB. J Biol Chem 289, 654–68 (2014). [DOI] [PMC free article] [PubMed] [Google Scholar]
- 43.Williams SJ et al. Structural basis for assembly and function of a heterodimeric plant immune receptor. Science 344, 299–303 (2014). [DOI] [PubMed] [Google Scholar]
- 44.Kaplan-Turkoz B et al. Structure of the Toll/interleukin 1 receptor (TIR) domain of the immunosuppressive Brucella effector BtpA/Btp1/TcpB. FEBS Lett 587, 3412–6 (2013). [DOI] [PubMed] [Google Scholar]
- 45.Snyder GA et al. Crystal structures of the Toll/Interleukin-1 receptor (TIR) domains from the Brucella protein TcpB and host adaptor TIRAP reveal mechanisms of molecular mimicry. J Biol Chem 289, 669–79 (2014). [DOI] [PMC free article] [PubMed] [Google Scholar]
- 46.Nimma S, Ve T, Williams SJ & Kobe B Towards the structure of the TIR-domain signalosome. Curr Opin Struct Biol (2017). [DOI] [PubMed] [Google Scholar]
- 47.Stols L et al. A new vector for high-throughput, ligation-independent cloning encoding a tobacco etch virus protease cleavage site. Protein Expr Purif 25, 8–15 (2002). [DOI] [PubMed] [Google Scholar]
- 48.Darmanin C et al. Protein crystal screening and characterization for serial femtosecond nanocrystallography. Sci Rep 6, 25345 (2016). [DOI] [PMC free article] [PubMed] [Google Scholar]
- 49.Hoover DM & Lubkowski J DNAWorks: an automated method for designing oligonucleotides for PCR-based gene synthesis. Nucleic Acids Res 30, e43 (2002). [DOI] [PMC free article] [PubMed] [Google Scholar]
- 50.Stemmer WP, Crameri A, Ha KD, Brennan TM & Heyneker HL Single-step assembly of a gene and entire plasmid from large numbers of oligodeoxyribonucleotides. Gene 164, 49–53 (1995). [DOI] [PubMed] [Google Scholar]
- 51.Mindell JA & Grigorieff N Accurate determination of local defocus and specimen tilt in electron microscopy. J Struct Biol 142, 334–347 (2003). [DOI] [PubMed] [Google Scholar]
- 52.Tang G et al. EMAN2: an extensible image processing suite for electron microscopy. J Struct Biol 157, 38–46 (2007). [DOI] [PubMed] [Google Scholar]
- 53.Frank J et al. SPIDER and WEB: processing and visualization of images in 3D electron microscopy and related fields. J Struct Biol 116, 190–9 (1996). [DOI] [PubMed] [Google Scholar]
- 54.Egelman EH A robust algorithm for the reconstruction of helical filaments using single-particle methods. Ultramicroscopy 85, 225–234 (2000). [DOI] [PubMed] [Google Scholar]
- 55.Pettersen EF et al. UCSF Chimera--a visualization system for exploratory research and analysis. J Comput Chem 25, 1605–12 (2004). [DOI] [PubMed] [Google Scholar]
- 56.Croll TI et al. Higher-resolution structure of the human insulin receptor ectodomain: multi-modal inclusion of the insert domain. Structure 24, 469–76 (2016). [DOI] [PMC free article] [PubMed] [Google Scholar]
- 57.Humphrey W, Dalke A & Schulten K VMD: visual molecular dynamics. J Mol Graph 14, 33–8, 27–8 (1996). [DOI] [PubMed] [Google Scholar]
- 58.DiMaio F et al. Atomic-accuracy models from 4.5-A cryo-electron microscopy data with density-guided iterative local refinement. Nat Methods 12, 361–5 (2015). [DOI] [PMC free article] [PubMed] [Google Scholar]
- 59.Song Y et al. High-resolution comparative modeling with RosettaCM. Structure 21, 1735–42 (2013). [DOI] [PMC free article] [PubMed] [Google Scholar]
- 60.Gipson B, Zeng x., Zhang ZY & Stahlberg H 2dx--user-friendly image processing for 2D crystals. J Struct Biol 157, 64–72 (2007). [DOI] [PubMed] [Google Scholar]
- 61.Holm L & Rosenstrom P Dali server: conservation mapping in 3D. Nucleic Acids Res 38, W545–9 (2010). [DOI] [PMC free article] [PubMed] [Google Scholar]
- 62.Krissinel E & Henrick K Inference of macromolecular assemblies from crystalline state. J Mol Biol 372, 774–97 (2007). [DOI] [PubMed] [Google Scholar]
- 63.Krissinel E & Henrick K Secondary-structure matching (SSM), a new tool for fast protein structure alignment in three dimensions. Acta Crystallogr D Biol Crystallogr 60, 2256–68 (2004). [DOI] [PubMed] [Google Scholar]
- 64.Webb B & Sali A Comparative protein structure modeling using MODELLER. Curr Protoc Bioinformatics 47, 5 6 1–5 6 32 (2014). [DOI] [PubMed] [Google Scholar]
- 65.Edgar RC MUSCLE: multiple sequence alignment with high accuracy and high throughput. Nucleic Acids Res 32, 1792–7 (2004). [DOI] [PMC free article] [PubMed] [Google Scholar]
- 66.Robert x. & Gouet P Deciphering key features in protein structures with the new ENDscript server. Nucleic Acids Res 42, W320–4 (2014). [DOI] [PMC free article] [PubMed] [Google Scholar]
- 67.George J et al. MyD88 adaptor-like D96N is a naturally occurring loss-of-function variant of TIRAP. J Immunol 184, 3025–32 (2010). [DOI] [PubMed] [Google Scholar]
- 68.Vajjhala PR et al. The inflammasome adaptor ASC induces procaspase-8 death effector domain filaments. J Biol Chem 290, 29217–30 (2015). [DOI] [PMC free article] [PubMed] [Google Scholar]
- 69.Mureev S, Kovtun O, Nguyen UT & Alexandrov K Species-independent translational leaders facilitate cell-free expression. Nat Biotechnol 27, 747–52 (2009). [DOI] [PubMed] [Google Scholar]
- 70.Gambin Y et al. Confocal spectroscopy to study dimerization, oligomerization and aggregation of proteins: a practical guide. Int J Mol Sci 17(2016). [DOI] [PMC free article] [PubMed] [Google Scholar]
- 71.Sierecki E et al. Rapid mapping of interactions between human SNx-BAR proteins measured in vitro by AlphaScreen and single-molecule spectroscopy. Mol Cell Proteomics 13, 2233–45 (2014). [DOI] [PMC free article] [PubMed] [Google Scholar]
- 72.Kovtun O et al. Leishmania cell-free protein expression system. Methods 55, 58–64 (2011). [DOI] [PubMed] [Google Scholar]
- 73.Gagoski D et al. Gateway-compatible vectors for high-throughput protein expression in pro- and eukaryotic cell-free systems. J Biotechnol 195, 1–7 (2015). [DOI] [PubMed] [Google Scholar]
- 74.Skalamera D et al. A high-throughput platform for lentiviral overexpression screening of the human ORFeome. PLoS One 6, e20057 (2011). [DOI] [PMC free article] [PubMed] [Google Scholar]
- 75.Walhout AJ et al. GATEWAY recombinational cloning: application to the cloning of large numbers of open reading frames or ORFeomes. Methods Enzymol 328, 575–92 (2000). [DOI] [PubMed] [Google Scholar]
- 76.Gambin Y et al. Single-molecule analysis reveals self assembly and nanoscale segregation of two distinct cavin subcomplexes on caveolae. Elife 3, e01434 (2014). [DOI] [PMC free article] [PubMed] [Google Scholar]
Associated Data
This section collects any data citations, data availability statements, or supplementary materials included in this article.
Supplementary Materials
Data Availability Statement
The 3D cryo-EM density map of MALTIR has been deposited in the Electron Microscopy Data Bank (EMDB) under accession numbers EMD-8625. Atomic coordinates for MALTIR have been deposited in the Protein Data Bank (PDB) under accession number 5UZB.