Abstract
High lethality of aortic dissection necessitates accurate predictive metrics for dissection risk assessment. The not infrequent incidence of dissection at aortic diameters <5.5 cm, the current threshold guideline for surgical intervention (Nishimura et al., 2014), indicates an unmet need for improved evidence-based risk stratification metrics. Meeting this need requires a fundamental understanding of the structural mechanisms responsible for dissection evolution within the vessel wall. We present a structural model of the repeating lamellar structure of the aortic media comprised of elastic lamellae and collagen fiber networks, the primary load-bearing components of the vessel wall. This model was used to assess the role of these structural features in determining in-plane tissue strength, which governs dissection initiation from an intimal tear. Ascending aortic tissue specimens from three clinically-relevant patient populations were considered: non-aneurysmal aorta from patients with morphologically normal tricuspid aortic valve (CTRL), aneurysmal aorta from patients with tricuspid aortic valve (TAV), and aneurysmal aorta from patients with bicuspid aortic valve (BAV). Multiphoton imaging derived collagen fiber organization for each patient cohort was explicitly incorporated in our model. Model parameters were calibrated using experimentally-measured uniaxial tensile strength data in the circumferential direction for each cohort, while the model was validated by contrasting simulated tissue strength against experimentally-measured strength in the longitudinal direction. Orientation distribution, controlling the fraction of loaded collagen fibers at a given stretch, was identified as a key feature governing anisotropic tissue strength for all patient cohorts.
Keywords: Aortic dissection, Uniaxial strength, Finite element analysis, Collagen fiber, Elastin, Structural modeling
1. Introduction
Acute dissection of the ascending thoracic aorta (ATA) is a major health concern with high lethality. If left surgically untreated, the mortality rate is 1–1.4% per hour for the first 48 h (Meszaros et al., 2000) which compounds to >60% by 2 weeks (Masuda et al., 1991). Current clinical strategy for dissection prevention is elective surgery for patients with a maximal orthogonal aortic diameter >5.5 cm (Nishimura et al., 2014; Svensson et al., 2013). However, 59% of the patients who experience acute dissection of ATA have an aortic diameter <5.5 cm (Parish et al., 2009). Thus, there is an unmet clinical need for the formulation of evidence-based metrics for earlier and more accurate identification of patients at high risk of dissection. As dissection ultimately involves mechanical failure of the aortic wall tissue, improved understanding of failure biomechanics of the aortic wall is expected to help derive such metrics.
Aortic dissection typically initiates from an intimal tear when in-plane wall stress exceeds the in-plane strength of the aortic media, and propagates intramurally within the media before delaminating media layers (Fig. 1a). Aortic tissue derives its mechanical strength from the content and organization of the structural proteins in the extracellular matrix (ECM), namely elastin and collagen (Raghavan et al., 1996; Schriefl et al., 2015; Shahmansouri et al., 2016; Sokolis et al., 2006; Weisbecker et al., 2013). In vitro experiments have demonstrated that collagen fiber degeneration results in decreased tissue strength (Schriefl et al., 2015; Weisbecker et al., 2013). Different research groups, including ours, have reported that specimens of aneurysmal aorta from patients with congenital bicuspid aortic valve (BAV) exhibit higher tensile strength than specimens of degenerative aneurysms with a normal aortic valve (Ferrara et al., 2016; Forsell et al., 2014; Pichamuthu et al., 2013; Sokolis et al., 2012). These observations, along with the observation of anomalous collagen fiber distribution in aneurysmal aortic medial ECM (Pasta et al., 2016; Phillippi et al., 2014), suggest that the tissue strength is influenced by collagen fiber organization. Barocas and colleagues recently developed multiscale models of porcine aortic tissue with elastin and collagen fibers (Shah et al., 2014; Witzenburg et al., 2017), and predicted that tissue failure is related to the failure of collagen fibers. Damage-based structural models of the aortic tissue have been advanced to elucidate mechanisms of tissue failure (Gasser, 2011; Ferruzzi et al., 2011; Forsell et al., 2013; Pierce et al., 2015; Saez et al., 2012; Volokh, 2008). These modeling efforts, in conjunction with the experimental measurements of tissue strength and microarchitecture, have contributed to our current understanding of the structural basis of vessel wall failure. Still, how disease-induced alterations in collagen microstructure compromises ATA wall tissue strength is not well understood.
Fig. 1.
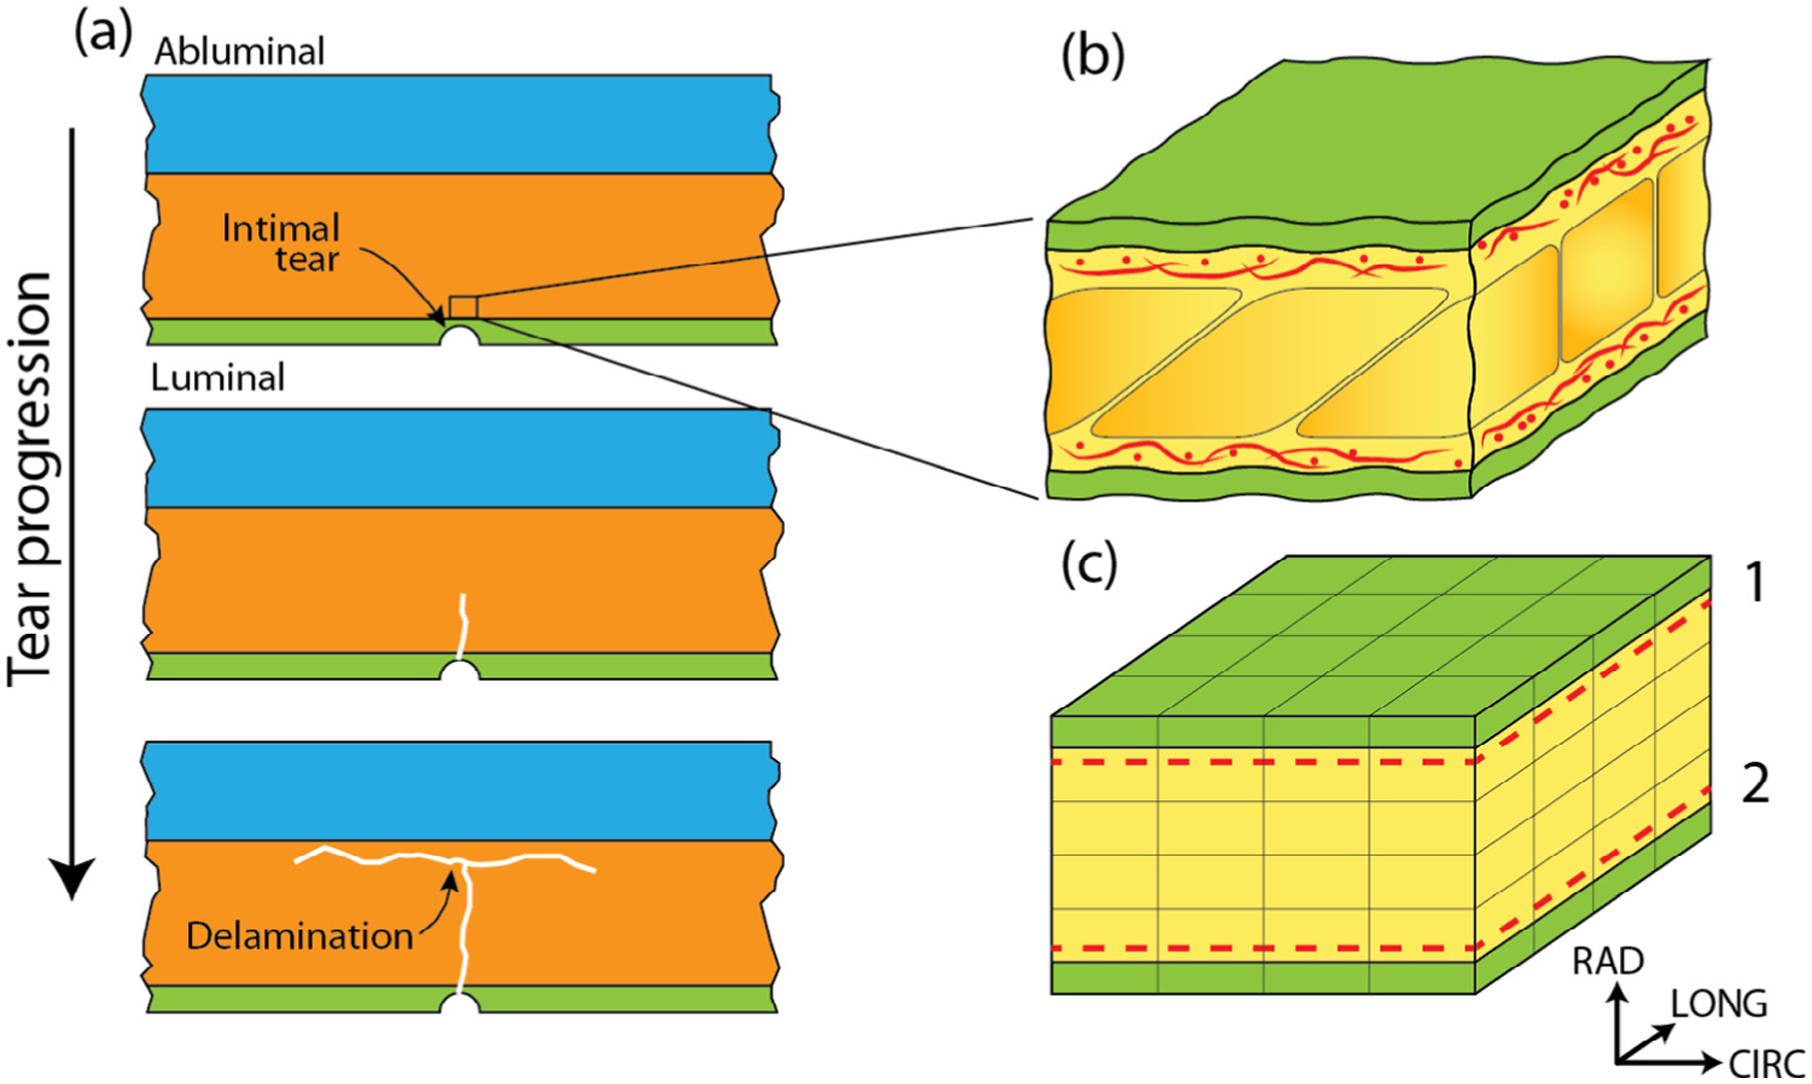
(a) The aortic wall is composed of three layers: the intima (green), media (orange), and adventitia (blue). The entire aortic dissection process is confined within the media. Aortic dissection initiates from an intimal tear (top panel), that propagates abluminally in the media (middle panel), and eventually delaminates layers of the media (bottom panel). Media is composed of repeating lamellar units, a representative region of which is shown in (b). The green region denotes the elastic lamellae while the yellow region corresponds to the inter-lamellar space which includes, among other components, collagen fiber networks (red) situated adjacent to the lamellae. A 25 μm × 25 μm × 12.5 μm segment of the representative finite element model of the lamellar unit is shown in (c). As in (b), the green region represents the elastic lamellae and the yellow the inter-lamellar space. The dashed lines show the locations of collagen network layers 1 and 2.
The goal of this study was to identify structural features of the aortic media governing tissue strength in health and disease, and quantify their contribution towards anisotropic tissue strength. To accomplish this goal, we constructed a structural finite element model of the repeating lamellar structure of the media of the human ATA wall. Collagen fiber architecture for non-aneurysmal and aneurysmal aortic media, previously obtained by multiphoton microscopy (MPM) image analysis (Pasta et al., 2016), was explicitly incorporated into the model. The model parameters were calibrated by regressing simulated uniaxial pre-failure and failure response in the circumferential (CIRC) direction against the experimental stress-strain curve for all patient cohorts. The model, thus calibrated, was validated by contrasting simulated tissue strength against experimentally-measured strength in the longitudinal (LONG) direction. Quantification of the relationship between tissue strength and microstructural features of the media revealed the primary role of collagen fiber orientation distribution.
2. Methods
2.1. Uniaxial strength of human ATA tissue
Previously measured values for the uniaxial tensile strength of human ATA tissue (Pichamuthu et al., 2013) were utilized in this work. Briefly, non-aneurysmal tissue (n = 7), designated as CTRL, as well as aneurysmal tissue from patients with tricuspid (n = 13) and bicuspid (n = 23) aortic valve (labeled TAV and BAV, respectively) were collected from patients with Institutional Review Board approval and informed patient consent. Multiple specimens were cut from the wall tissue of each patient in both CIRC and LONG directions, and were uniaxially tested until failure in a displacement-controlled manner. Details of sample preparation, uniaxial testing protocol, and tissue strength measurements were reported in our earlier publications (Pichamuthu et al., 2013; Raghavan et al., 1996).
2.2. Structural model of aortic media
We created a solid model for lamellar unit (LU) of the ATA media incorporating its elastin and collagen organization. Two elastic lamellae (EL), separated by an interlamellar (IL) space of 11 μm (Wolinsky and Glagov, 1967), were modeled as 3D continua of dimension 250 μm × 250 μm (Fig. 1b,c). The thickness of each lamella in the model was 0.75 μm, half of its physiological dimension (O’Connell et al., 2008), as the lamellae are shared by adjacent LUs. Resulting volume fraction of the EL (Velast) was calculated as 0.12, and that of the IL space (Vil) as 0.68. Collagen fiber networks were placed in the IL space adjacent to each elastic lamella. Individual collagen fibers of the network were modeled as one-dimensional rod elements of 3 μm diameter (Thunes et al., 2016). A custom Matlab (Matlab 2014b, Mathworks, Natick, MA) script was developed to create planar networks of collagen fibers quantified by patient cohort-relevant average of mean fiber direction (γ), orientation index (OI), and areal density (AD). These data were obtained from previously reported multiphoton image analysis performed by our group (Koch et al., 2014; Pasta et al., 2016). As no significant difference in collagen content between aneurysmal and non-aneurysmal (Iliopoulos et al., 2009b; Tang et al., 2005), or BAV and TAV ATA tissue (Pichamuthu et al., 2013) is reported in the literature, AD = 0.48 (Koch et al., 2014) was used for all cohorts. This choice resulted in a collagen volume fraction (Vcol) of 0.20. Fibers, with orientations randomly picked from a distribution quantified by γ and OI, were added to the network until the target AD was reached. Normalcy of the fiber orientation distribution of the final network was ensured by using Lilliefors test (p ≤ 0.05). This network generation method is similar to that described in, for example, (Carleton et al., 2015; D’Amore et al., 2010; Lake et al., 2012; Shah et al., 2014). Resulting fiber networks were symmetrically arranged with respect to the circumferential direction of the vessel (Schriefl et al., 2012) with a mean fiber direction of +γ for the network in layer 1 and −γ for the other (Fig. 2).
Fig. 2.
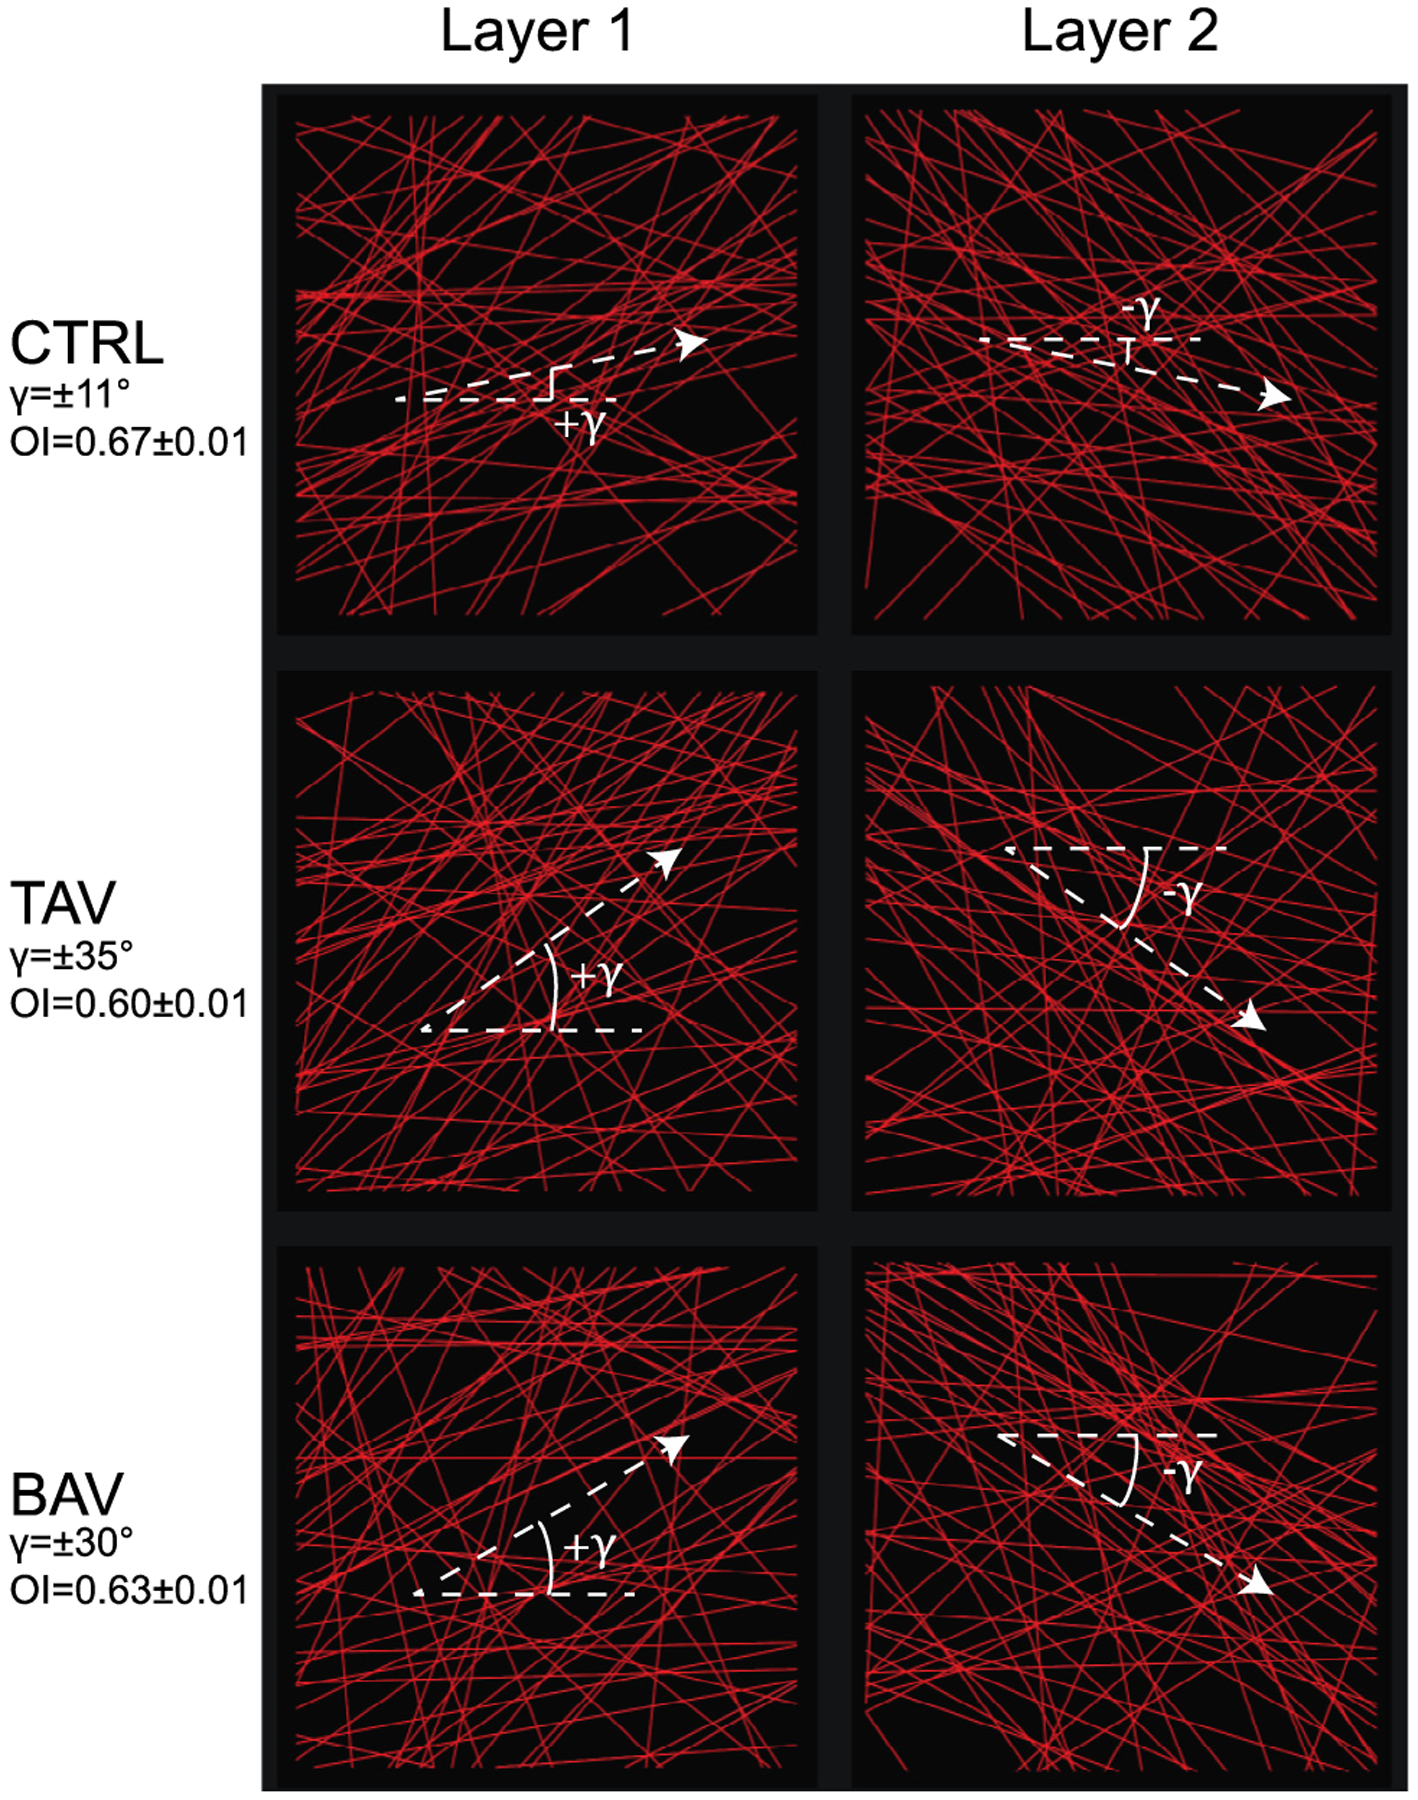
Collagen fiber networks for the CTRL, TAV, and BAV tissues shown on CIRC-LONG plane. Collagen fibers are denoted by red straight lines. Panels in left column represents the fiber network in layer 1 of the computational model, while panels in right column shows the networks in layer 2. Crimp of the fibers were not represented explicitly in our model, but were taken through the recruitment stretch in the fiber constitutive model. Dashed lines show the mean fiber direction for each network.
Elastic lamellae and interlamellar space were modeled with a 1-parameter isotropic incompressible neoHookean material model with a strain energy function Ψ = 0.5μ(I1 − 3), with μ as the shear modulus and I1 = trC as the first invariant of right Cauchy-Green deformation tensor. The following expression was used to describe fiber constitutive law with failure (Fig. 3):
| (1) |
where Ecol is the fiber modulus and λ is the fiber stretch. λr and λp are the recruitment stretch and the stretch associated with peak stress, respectively. An internal parameter S ∈ [0, 1] tracks the damage state of the fiber. An initial value of S is defined as Sinit = 1 with S = Sinit until the peak stretch is reached (λ ⩽ λp), after which S monotonically decreases between fiber stretches of λp and λmax, the fiber failure stretch. Full fiber failure (S = 0) occurs at λmax. Based on our previous work (Maiti and Geubelle, 2004), S evolves in the following manner
| (2) |
where Smin ⩾ 0 is the minimum value of S over the course of the simulation, and 〈a〉 = a if a > 0 and 0 otherwise.
Fig. 3.
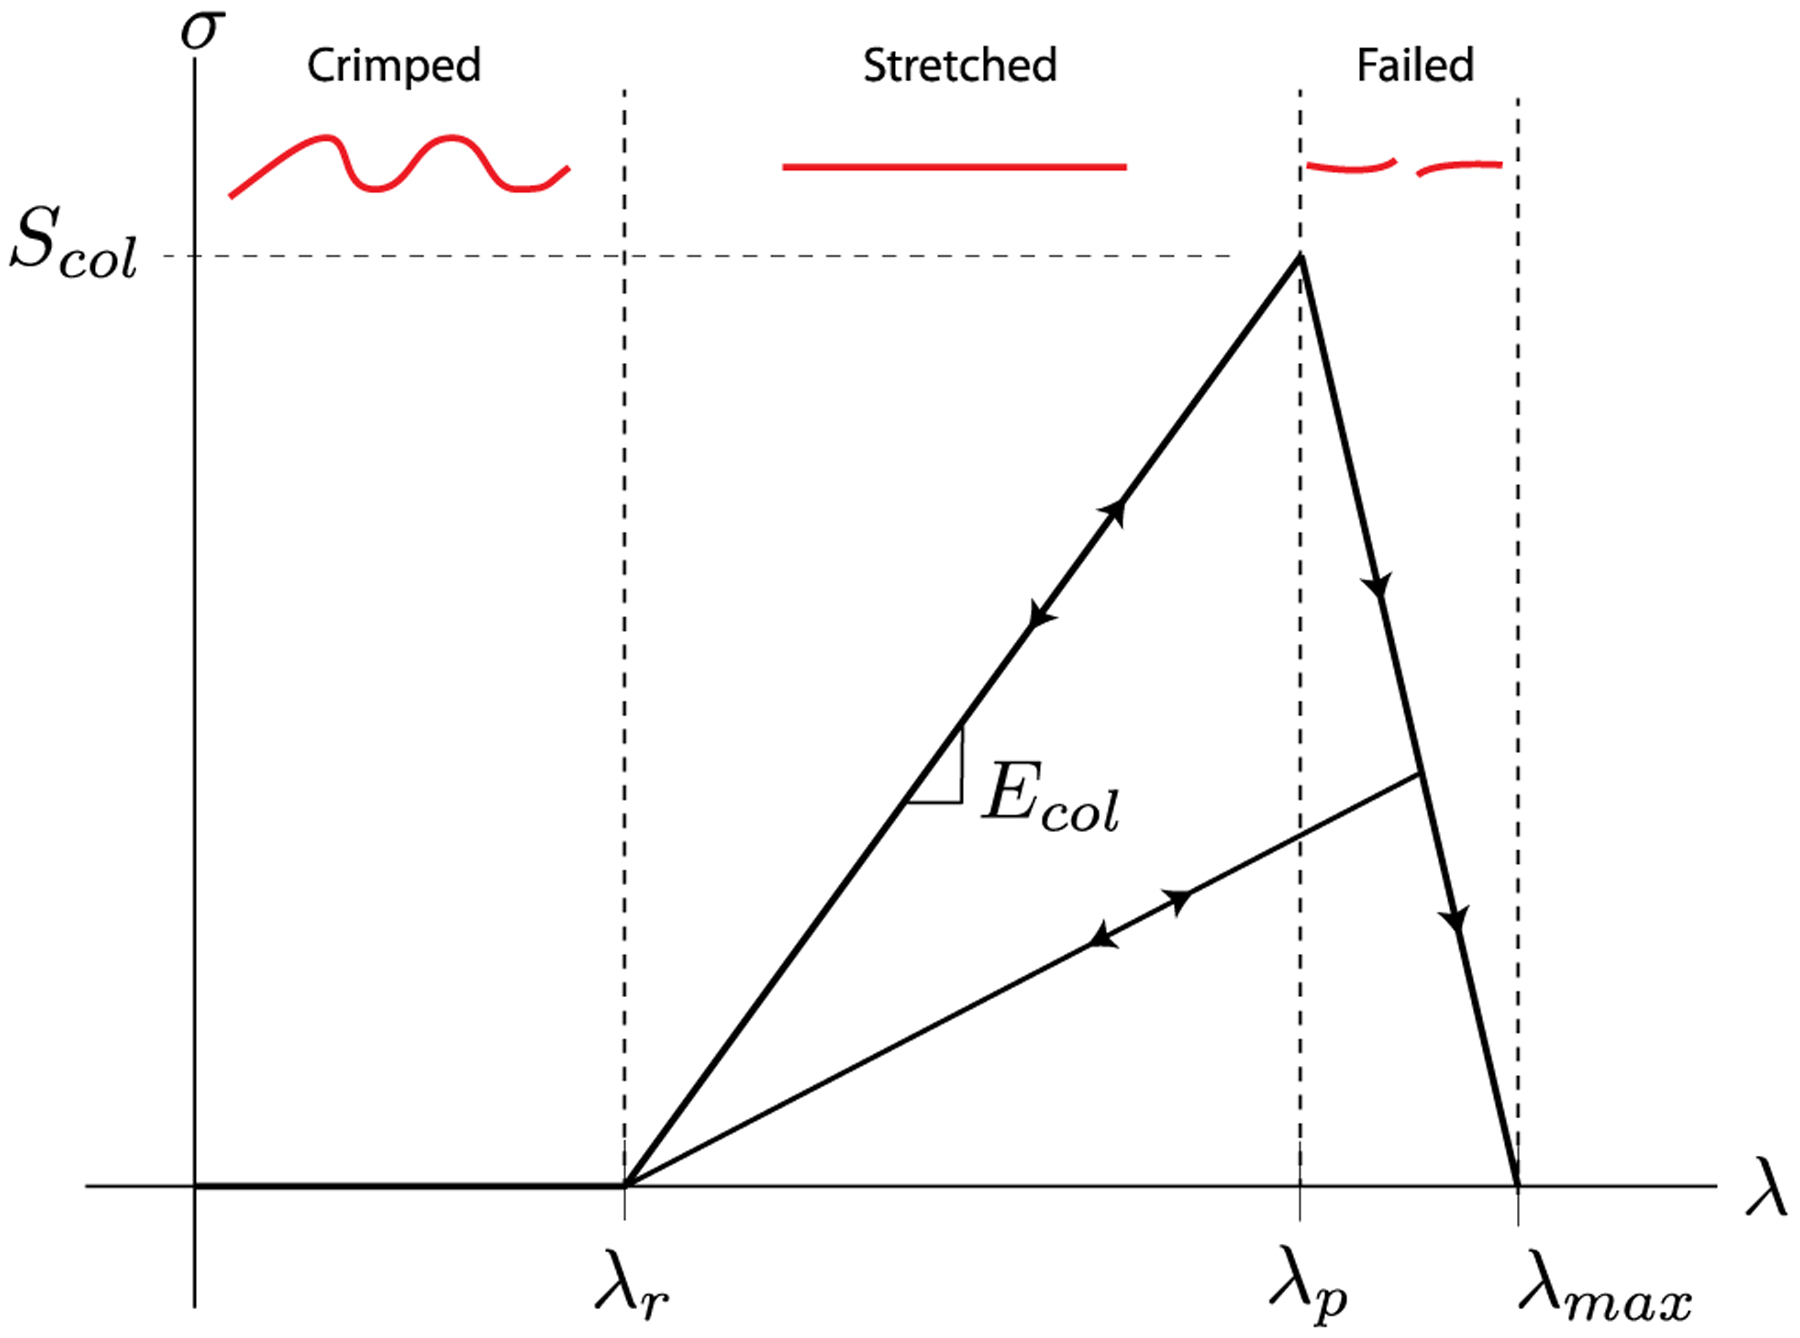
Constitutive model for a single collagen fiber. λ represents the fiber stretch while σ is the fiber stress. The fiber does not carry any stress until the recruitment stretch λr is reached. Once stretched beyond this point, the fiber behaves as a linear elastic rod with an elastic modulus of Ecol. At a stretch of λp, the fiber stress-stretch curve exhibits a peak which is equivalent to Scol, the fiber strength. Fiber stress decreases monotonically in a linear fashion after this peak to a stress of zero at a stretch of λmax = λp + 0.1. Free parameters of the fiber constitutive model are λr, Ecol, and Scol. λp can be computed from these parameters as λp = λr + Scol/Ecol. A representation of the collagen fiber in each stretch region is shown in red. Arrows denote the loading-unloading paths.
2.3. Finite element simulation procedure
A custom fiber-embedded finite element model (detailed in (Thunes et al., 2016)) was used to simulate uniaxial tensile tests in the computational domain. Tensile stretch was applied uniaxially in increments of 0.1% in either the CIRC or LONG direction until the tissue stress reached the post-peak region. Faces orthogonal to the loading direction were placed on rollers. For each stretch increment, reaction forces at all nodes on the loaded face were added together to determine total reaction force. The total force was divided by the current area of the loaded face to obtain Cauchy stress, which was plotted against corresponding applied stretch to determine tissue stress-stretch response. To ensure convergence, we carried out simulations with different mesh densities until the change in simulated tissue strength was <5% resulting in a 15,000 8-noded hexahedral element mesh.
2.4. Parameter estimation and model validation
The model parameter estimation and model validation strategy used in this work is schematically shown in Fig. 4. Experimentally-measured uniaxial stress-stretch data in the CIRC direction was used for patient cohort-relevant model construction, while those in the LONG direction was used for model validation. Within each cohort, experimental CIRC stress-stretch curves measured for multiple specimens (n = 2 or 3) from each patient was averaged. The model-simulated patient-specific CIRC stress-stretch curve was regressed segment-wise against the patient-specific average experimental curve using the Matlab function lsqcurvefit to calibrate the four model parameters. As the initial low stiffness segment of the tissue stress-stretch response is governed by mechanical properties of elastin (Zou and Zhang, 2009), regression of this segment was used to calibrate μelast, the shear modulus of elastic lamellae. Mean value of the collagen fiber recruitment stretch (λr) was determined by fitting the location of the inflection point of the stress-stretch curve. Regression of the high stiffness quasi-linear segment of the curve, dominated by the mechanical behavior of collagen, yielded the collagen fiber elastic modulus (Ecol). Fitting the peak of the stress-stretch response determined the collagen fiber strength, Scol. As the IL space is primarily comprised of a mixture of elastin and collagen fibers, smooth muscle cells, and proteoglycans (Clark and Glagov, 1985; O’Connell et al., 2008), it is expected to be softer than both collagen and elastin. Accordingly, the shear modulus for IL space material was assumed to be 0.33μelast. Model parameters thus calibrated for all patients within a cohort were then averaged to yield cohort-relevant parameters.
Fig. 4.

Computational workflow for the model parameter calibration using CIRC response of the tissue, and validation of the model prediction for the tissue failure properties in the LONG direction using the calibrated parameter set.
To validate the developed model, we simulated stress-stretch response of the ATA tissue in the LONG direction for each patient cohort using corresponding cohort-relevant model parameter values. Multiple simulations were run with different combinations of mean and ±SD values of each model parameter (8 combinations per cohort), and the model-predicted tissue strength and failure stretch in the LONG direction were compared against corresponding experimental measurements. Student’s t-test and Levene’s test were used to determine statistical difference in the mean and variance, respectively, between the experimentally measured and computationally estimated tissue strength and failure stretch (p < 0.05 indicating significant difference). Reported values are expressed as (mean ± standard deviation).
3. Results
Fig. 5 presents the simulated and experimental CIRC stress-stretch responses (red and grey, respectively) for two representative patients from each cohort. The model could recapitulate typical nonlinear pre-failure response of the aortic tissue as well as the peak of the stress-stretch curve. The cohort-averaged coefficients of determination between average experimental and simulated stress-stretch curves were 0.99 ± 0.01, 0.98 ± 0.03 and 0.96 ± 0.03, for the CTRL, BAV, and TAV cases, respectively. Cohort-averaged values of the regressed model parameters along with their literature-reported experimentally measured values are listed in Table 1. This table shows that all the regressed parameter values were comparable to their corresponding experimentally measured values. Uniaxial tissue strength and failure stretch in the CIRC direction, estimated by the model and measured from uniaxial tensile tests, are both shown in Fig. 6a and b, respectively. Differences between mean estimated strength and failure stretch and corresponding experimentally measured values were statistically insignificant (p > 0.05) for all cohorts. In addition, there was no difference in the variance of the estimated and measured tissue strength and failure stretch data (p > 0.05). Fig. 6c and d present model-predicted and experimentally determined tissue strength and stretch in the LONG direction, respectively. Differences between predicted and experimentally measured mean and variance of the tissue strength and failure stretch were again not statistically significant (p > 0.05) for all three cohorts.
Fig. 5.
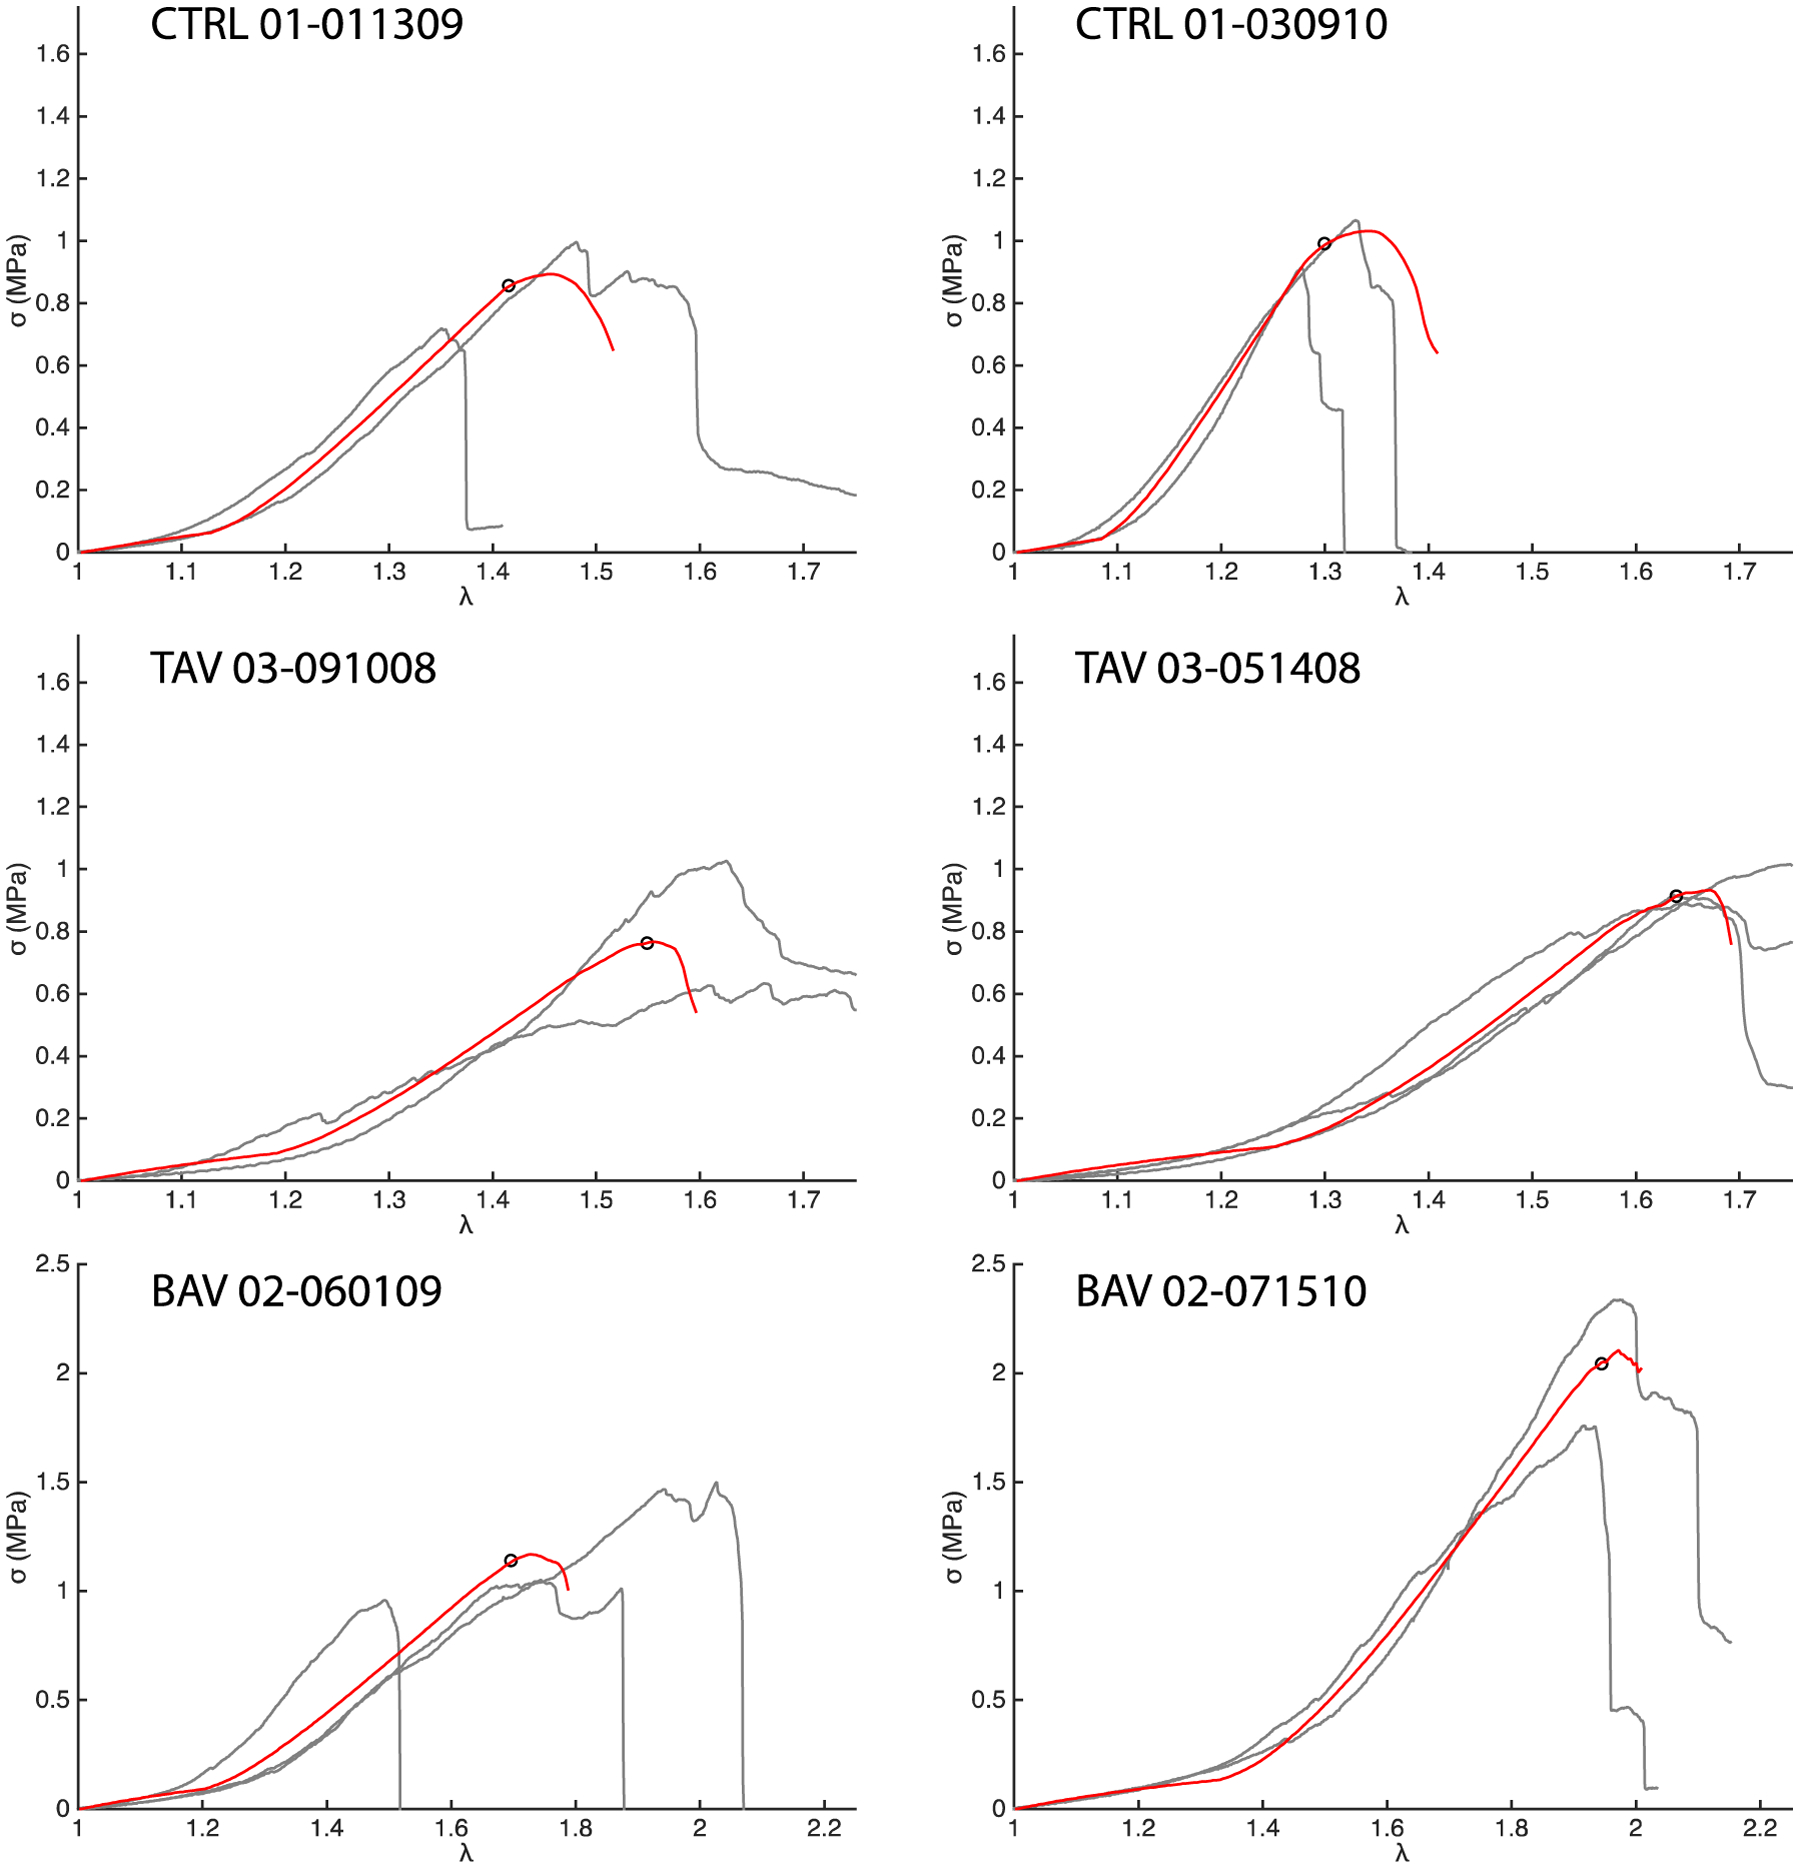
Representative CIRC simulations for two patients each from the CTRL, TAV, and BAV populations. The red curves show the simulation response and the grey curves the experimental data. The simulated stress-stretch curve for a patient was regressed against the average of all the experimental stress-stretch curves for that patient. The hollow black circles mark the average experimental ATA wall tissue strength for the patient.
Table 1.
Calibrated model parameters for the CTRL, TAV, and BAV patient cohorts. No significant difference in the parameter values between the groups could be found (p > 0.05).
| Calibrated model parameters | Literature reported values | |||
|---|---|---|---|---|
| Population | TAV | TAV | BAV | |
| μelast (kPa) | 321 ± 102 | 349 ± 83 | 347 ± 68 | 410 (Aaron and Gosline, 1981; Lillie and Gosline, 2002) |
| Ecol (MPa) | 23 ± 7 | 22 ± 11 | 20 ± 9 | 54 ± 25 (Miyazaki and Hayashi, 1999) |
| Scol (MPa) | 8.2 ± 2.2 | 7.0 ± 4.3 | 12.9 ± 7.0 | 8.5 ± 2.6 (Miyazaki and Hayashi, 1999) |
| λr | 1.19 ± 0.07 | 1.24 ± 0.13 | 1.30 ± 0.10 | 1.20–1.40 (Zulliger and Stergiopulos, 2007) |
Fig. 6.
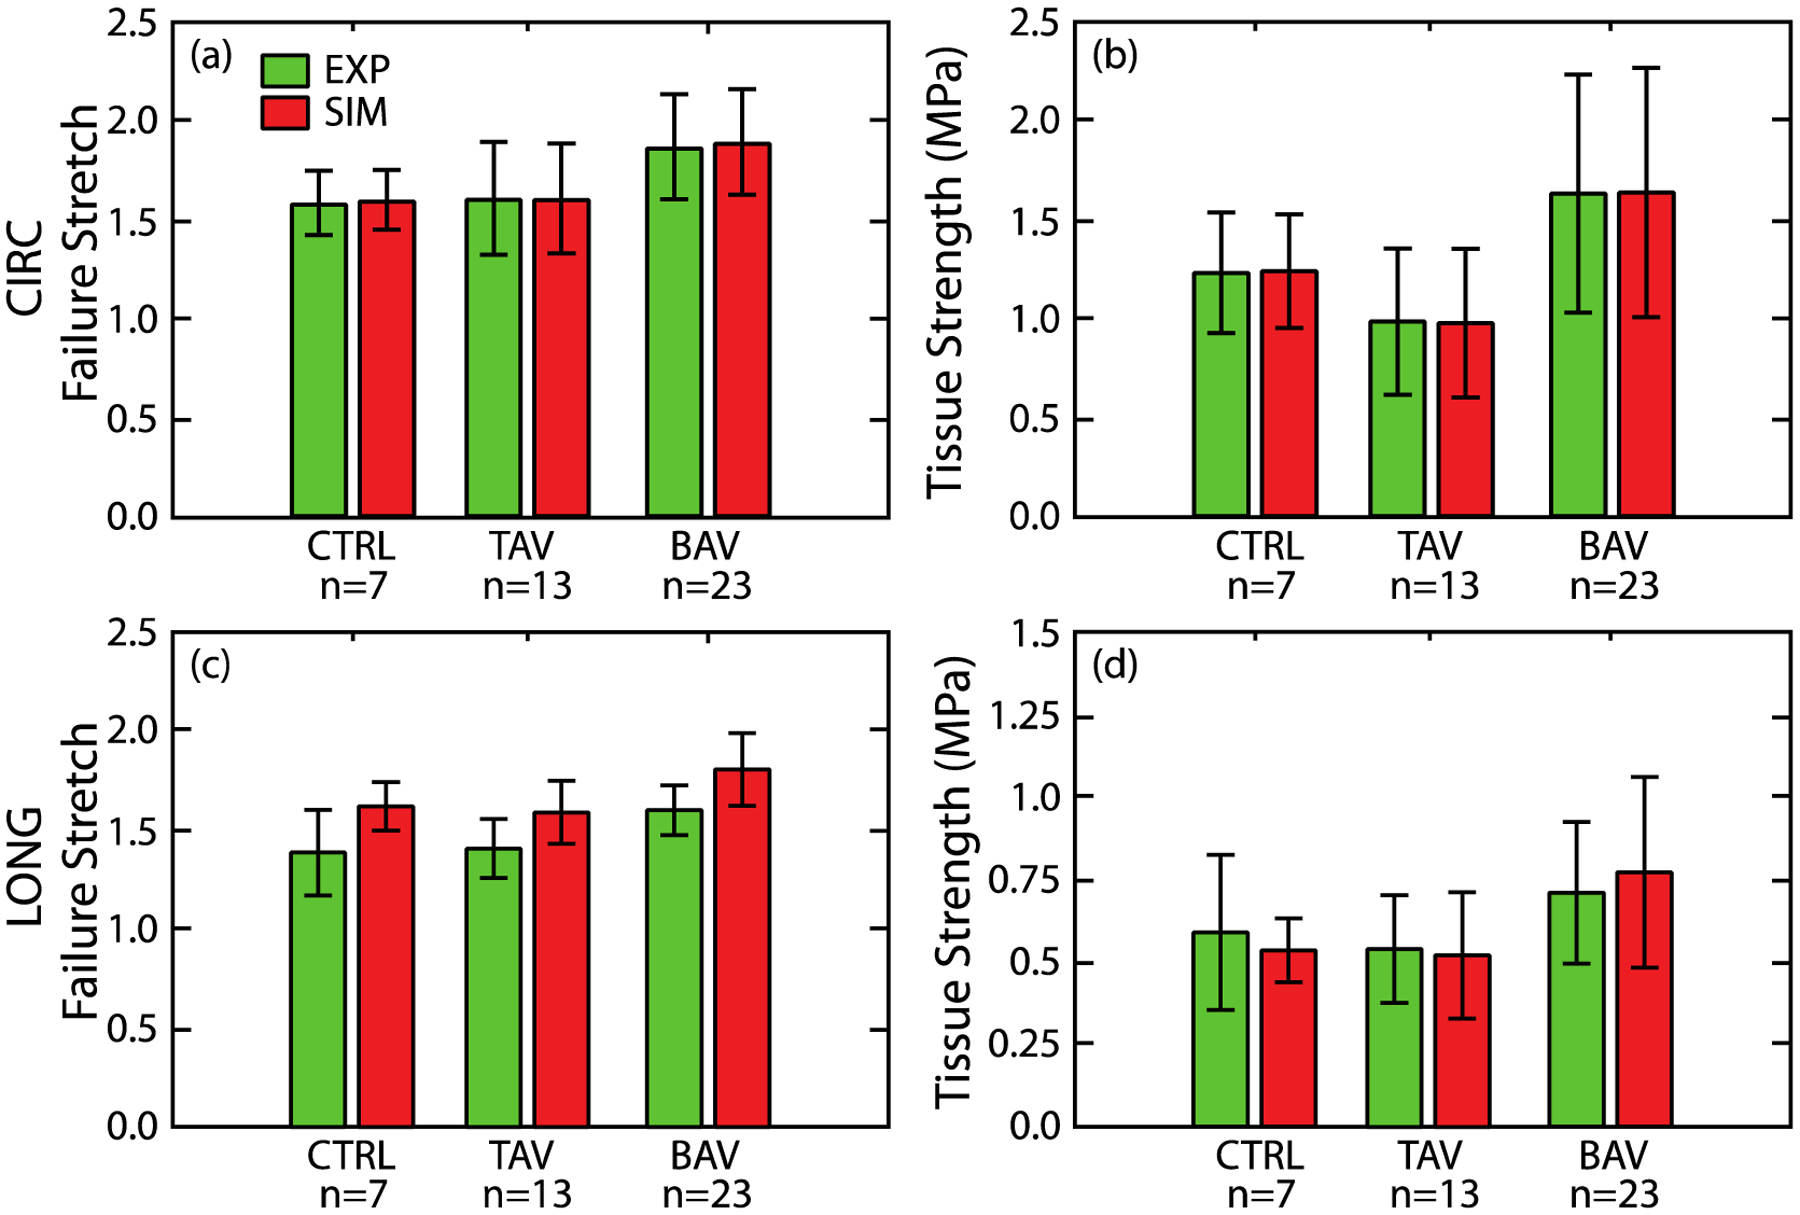
Failure stretch (a) and tissue strength (b) of the ATA wall tissue, estimated by the model, for all patient cohorts in the CIRC direction (red bars) along with corresponding experimentally measured values (green bars) (Pichamuthu et al., 2013). Predicted failure stretch (c) and tissue strength (d) of the ATA wall tissue for all patient cohorts in the LONG direction (red bars) along with corresponding experimental measurements (green bars) (Pichamuthu et al., 2013). There is no significant difference in the mean or standard deviations between the model predicted failure properties and experimental measurements for any patient cohort.
Fig. 7 presents simulated evolution of maximum principal stress under CIRC stretching in the CIRC-LONG plane proximal to the collagen network layer 1. At an applied stretch of 1.1, collagen fibers were unloaded and the stress was carried only by the non-collagenous matrix (Fig. 7 top). At an applied stretch of 1.3, the collagen fibers oriented within ±30° of the CIRC direction were recruited while the remainder still remained unloaded (Fig. 7 middle). Stress heterogeneities in the matrix at this stretch level were caused by stress transfer from the fibers to the surrounding matrix. At an elevated stretch of 1.45, collagen fibers in the loading direction began to fail (Fig. 7 bottom). The matrix stress in the regions of collagen fiber failure was concomitantly elevated (maximum value of 2.0 MPa for TAV cases, for example) well beyond 1.38 ± 0.08 MPa, the ultimate stress of elastin (Lillie and Gosline, 2002). Comparable stress evolution was also observed for the BAV cohort (not shown).
Fig. 7.
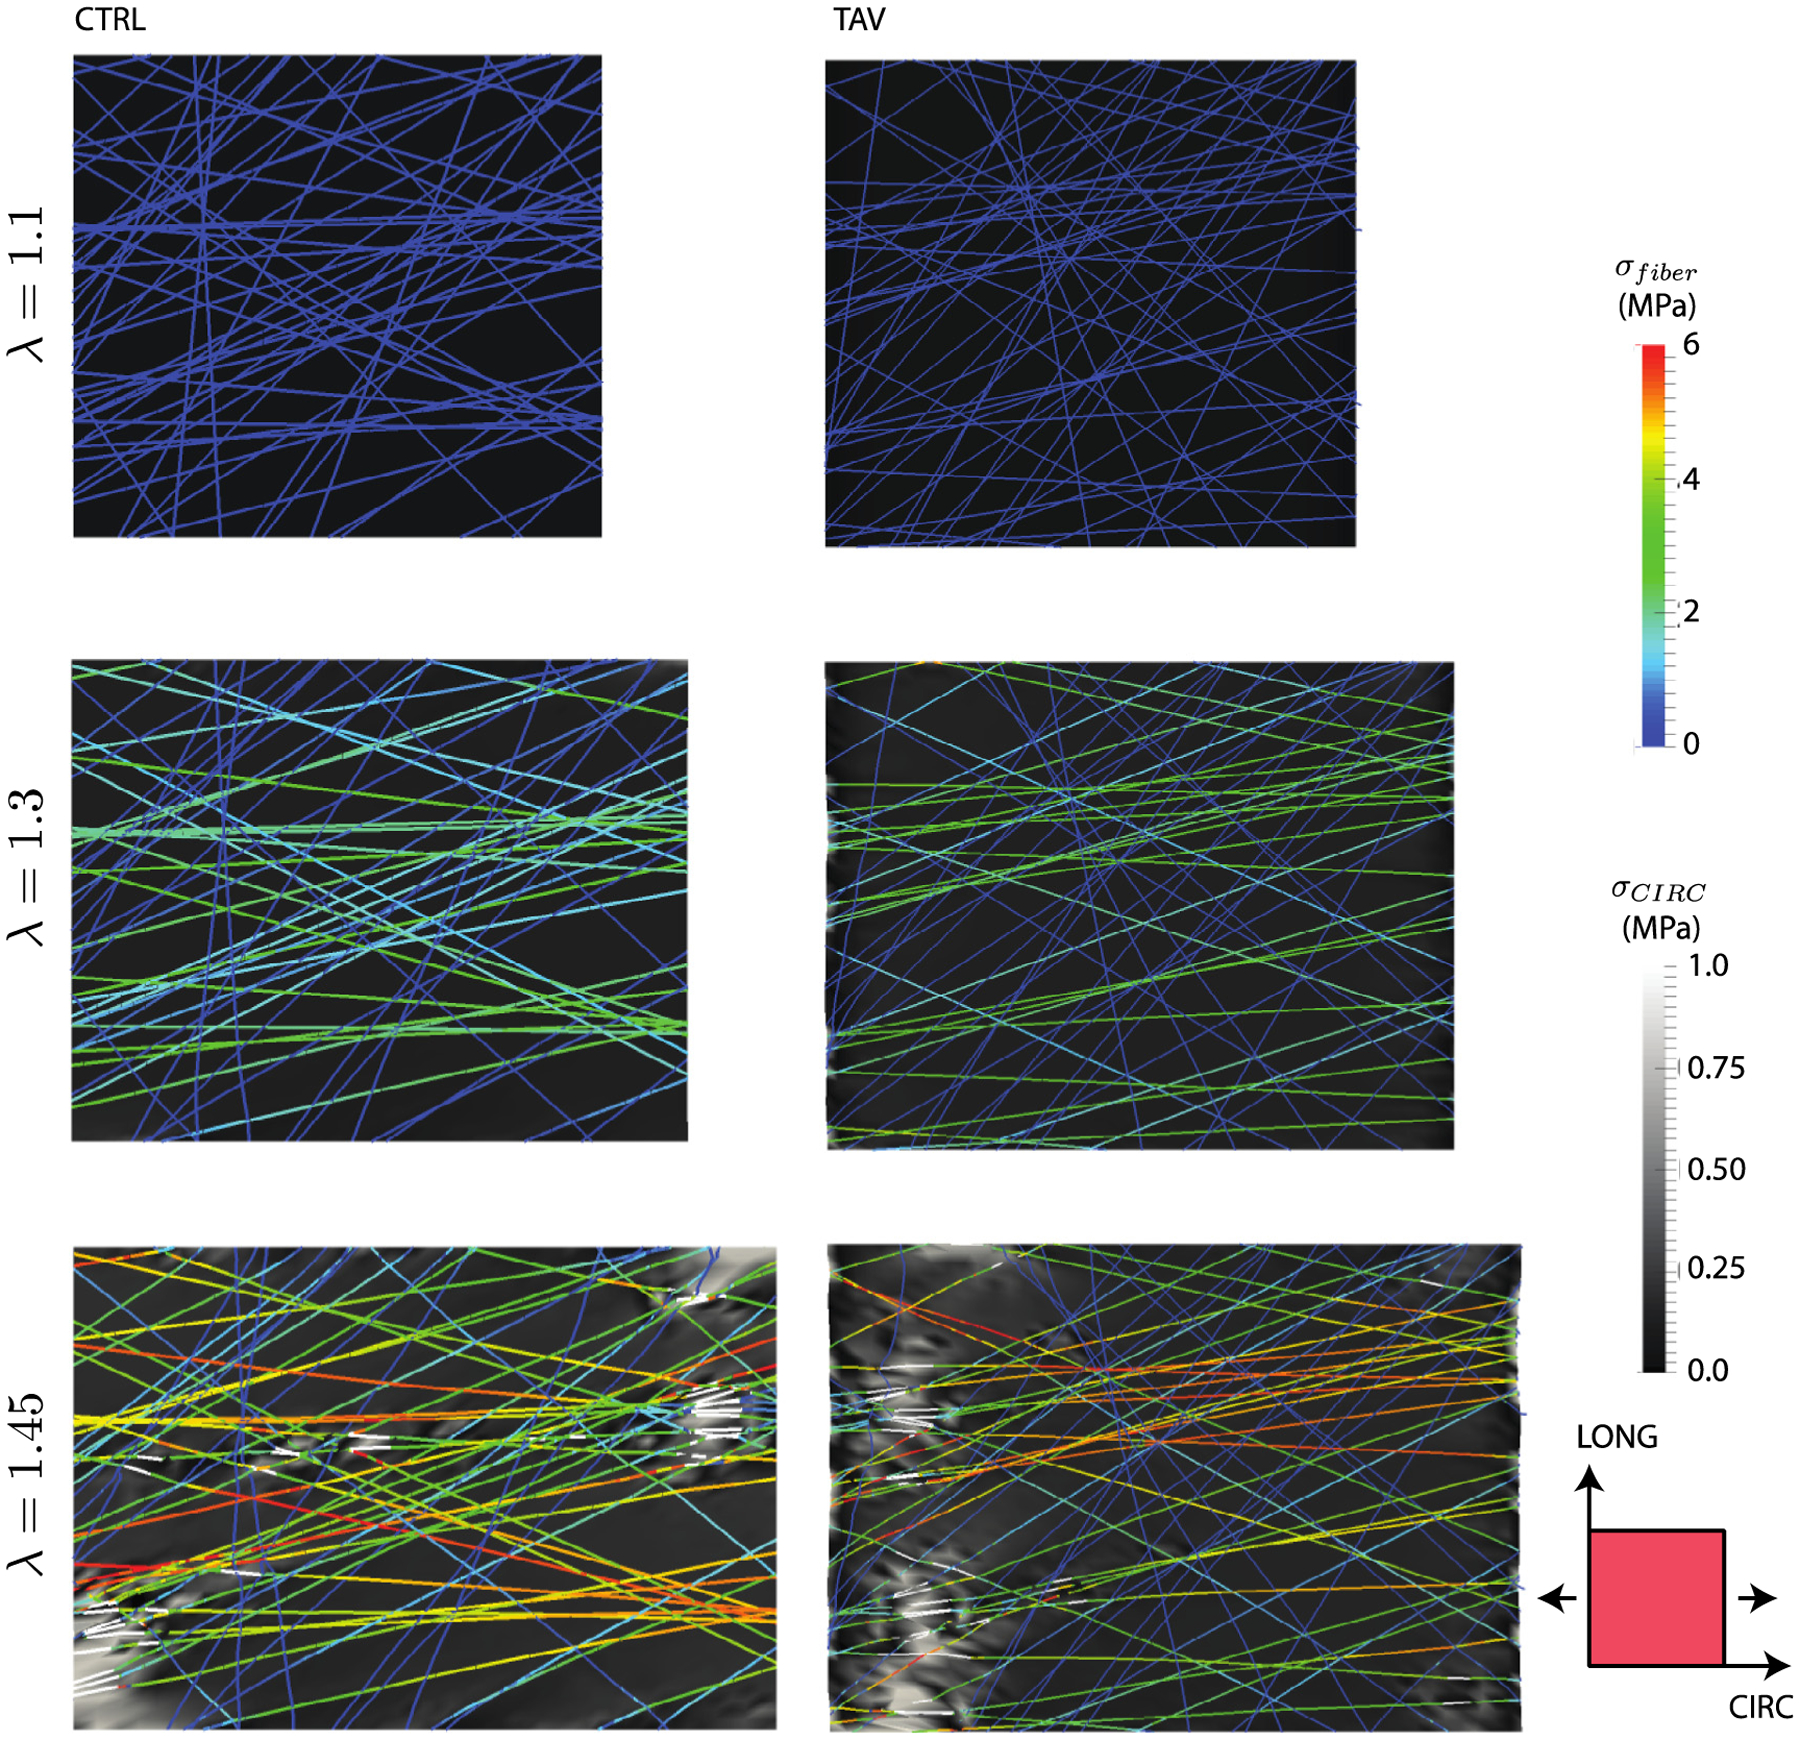
Stress evolution in the CIRC-LONG plane proximal to the collagen network layer 1 for representative CTRL and TAV tissues loaded in the CIRC direction. The cross-section shown in the figure was taken at the level of the fiber network. Fibers stresses are shown in color scale, while the lamella stress (background) is shown in greyscale. At an applied stretch of 1.1 (top), the matrix stress was isotropic as the collagen fibers did not reached their recruitment stretch. (middle) The elastic lamella stress and fiber stress at an applied stretch of 1.3 revealed that the collagen fibers primarily oriented in the loading direction started carrying stress. Fibers nearly orthogonal to the loading direction did not carry any stress. (bottom) Fiber and matrix stresses at an applied stretch of 1.45 showed onset of fiber failure. Failed segments of the fiber are shown by white lines. Local elastic lamella stress was highly heterogeneous, and exhibited sharp peaks in the regions of fiber failure. Although upper limit of the matrix stress contours were capped at 1 MPa for better visualization purpose, peak matrix stress for the CTRL case was 2.4 MPa, and that for the TAV case was 2.9 MPa.
Fig. 8 presents the evolution of stress distribution for applied stretch in LONG direction. The trend was overall similar to that for the CIRC stretching case. Under low loading (below the recruitment stretch of the collagen fibers), the matrix stress was homogeneous (Fig. 8 left). Heterogeneity in the matrix stresses was observed with collagen fibers recruitment and load bearing (Fig. 8 middle). At elevated stretch, focal increase in matrix stresses were noted in the regions of fiber failures (Fig. 8 bottom). However, the number of loaded fibers in the LONG direction, and consequently number of failed fibers, was fewer compared to the CIRC loading case for all cohorts.
Fig. 8.
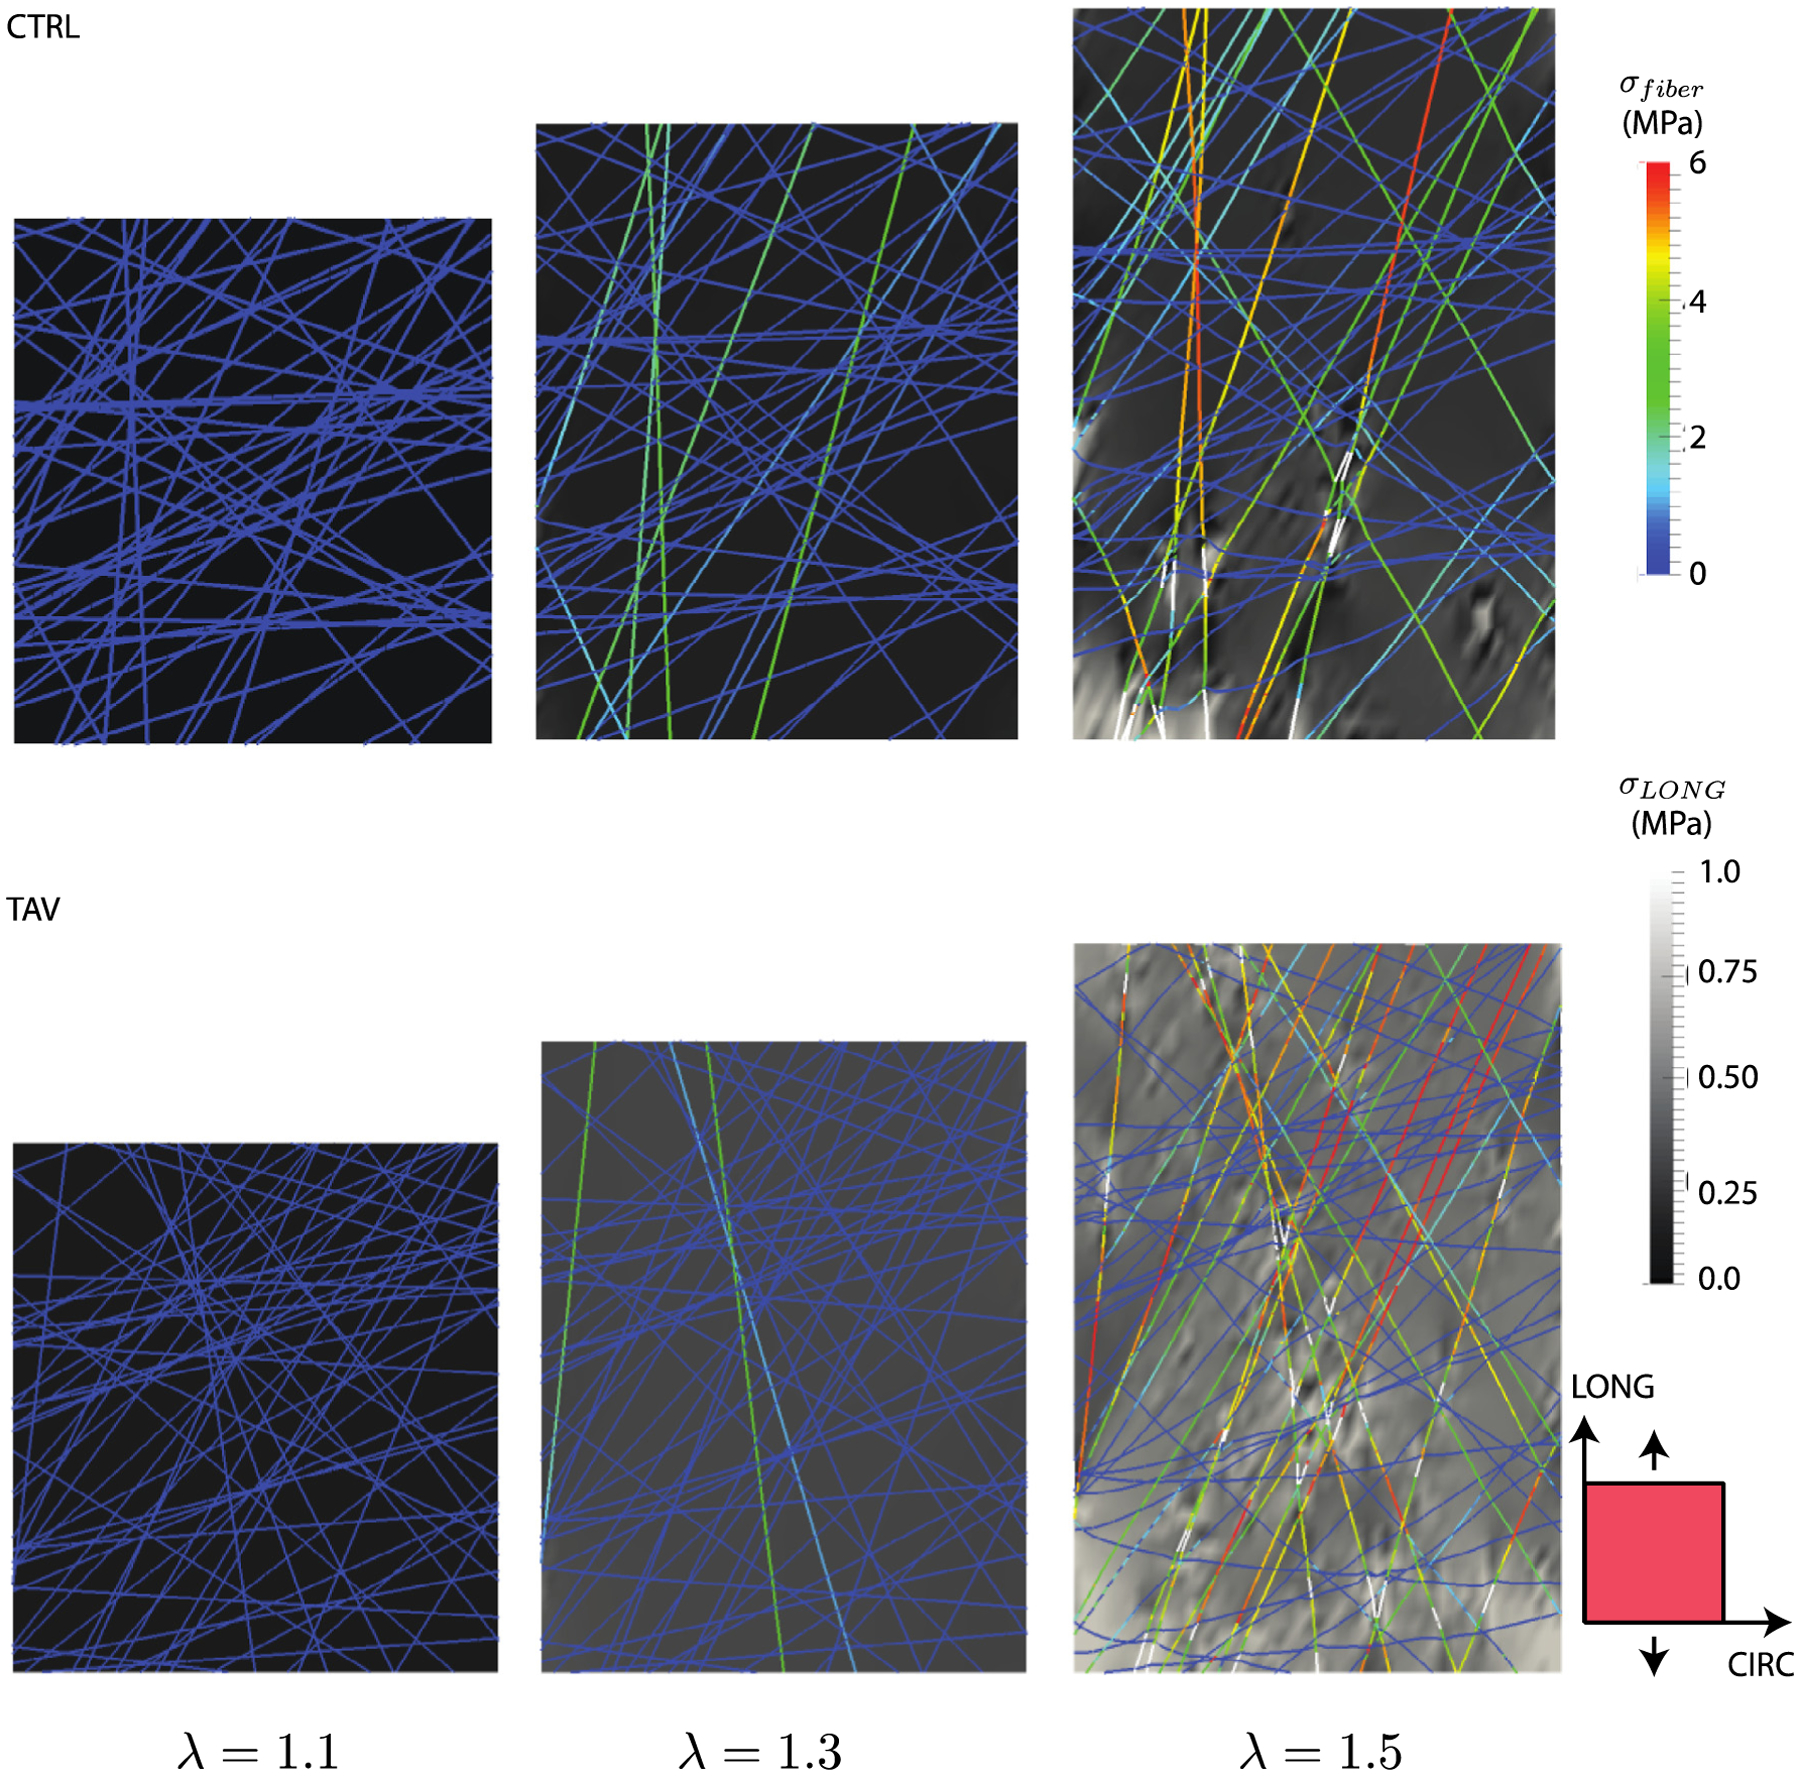
Stress evolution in the CIRC-LONG plane proximal to the collagen network layer 1 for representative CTRL and TAV tissues loaded in the LONG direction. Fibers stresses are shown in color scale, while the lamella stress (background) is shown in greyscale. At an applied stretch of 1.1 (left), the matrix stress was isotropic as the collagen fibers did not reach their recruitment stretch. (middle) The elastic lamella stress and fiber stress at an applied stretch of 1.3 revealed that the collagen fibers primarily oriented in the loading direction started carrying stress. Fibers nearly orthogonal to the loading direction did not carry any stress. (right) Fiber and matrix stresses at an applied stretch of 1.5 showed onset of fiber failure. Failed segments of the fiber are shown by white lines. Local elastic lamella stress was highly heterogeneous, and exhibited sharp peaks in the regions of fiber failure. Although upper limit of the matrix stress contours were capped at 1 MPa for better visualization purpose, peak matrix stress for the CTRL case was 1.6 MPa, and that for the TAV case was 2.1 MPa.
4. Discussion
From a biomechanics perspective, aortic dissection will initiate from an intimal tear whenever in-plane wall stress exceeds in-plane tissue strength. While dissection initiation requires very high blood pressure, its propagation can be sustained at normal pressure levels (MacLean et al., 1999; Roach et al., 1999; Tiessen and Roach, 1993). Thus, initiation of dissection is likely the critical biomechanical event in the evolution of ATA dissection. In this article, we quantified structural mechanisms responsible for in-plane strength of the aortic media using a computational approach. Primary load-bearing components of the media, namely collagen fibers and the elastic lamellae, were explicitly incorporated in the model. Examination of the evolution of failure process (Figs. 7 and 8) revealed localized breakage of collagen fiber bundles and colocalized elastic lamella stress in excess of elastin strength suggesting concomitant lamella failure. Precipitous decrease in overall tissue stress accompanying collagen fiber failure (Figs. 5, 7 & 8) suggests collagen breakage as the governing tissue failure mechanism, as also discussed in (Witzenburg et al., 2017). However, both collagen and non-collageneous components contributed to tissue strength. For example, non-collageneous matrix stress at failure was 20 ± 5% of the CIRC strength and 41 ± 8% of LONG strength, averaged over all three cohorts. Taken together, these observations suggest a “master-slave mechanism” of tissue failure where collagen fibers with higher strength and stiffness but lower failure stretch act as “master”, while elastic sheets (and IL matrix) with lower stiffness and strength but higher failure stretch act as “slave”. In the absence of collagen fibers, the entire tissue stress would be borne by the matrix resulting in a tissue failure stretch of ~2.0 (that of elastin), but a strength of only about 410 kPa (estimated using rule of mixture). Presence of load bearing fraction of the “master” collagen fibers, which depends on the fiber orientation, raises the load-bearing capability of the tissue considerably resulting in higher tissue strength but lower failure stretch of 1.4–1.6. The fraction of load-bearing collagen fibers in the LONG direction was markedly less than that in the CIRC direction resulting in anisotropy in the tissue strength. Specifically, the percentages of load-bearing fibers at failure were 90 ± 2, 82 ± 6, and 87 ± 2 for CTRL, TAV, and BAV cohorts in the CIRC direction, respectively, and 33 ± 21, 30 ± 20, and 30 ± 19 for those cohorts in the LONG direction. While strength anisotropy has been observed experimentally (e.g. (Pal et al., 2014; Pichamuthu et al., 2013)), the presented structural model provides compelling evidence that orientation distribution of the collagen fibers is the primary contributing factor to this phenomenon.
Based on the failure mechanism suggested above, we approximated the tissue as a linear elastic composite material, and estimated the tissue strength Stissue using rule of mixture (Daniel and Ishai, 2006)
| (3) |
where Nf is the percentage of collagen fibers bearing load at the instant of failure, Velast and Vil are volume fractions of elastic lamellae and IL space, and Eelast and Eil are their elastic moduli, respectively. Also, overall failure stretch of the tissue is denoted by λfail. We calculated CIRC tissue strength for all the patients in all three cohorts using this expression, and performed correlation analysis against the experimentally measured tissue strength. The result of this analysis is presented in Fig. 9a–c. In the subfigures, the best-fit lines show that rule of mixtures (Eq. (3)) can estimate the experimentally-derived tissue strength reasonably well. Assessed Pearson correlation (r), Spearman’s rank correlation (ρ), and the slope of the regression line (k) for CTRL and TAV cohorts exhibited very strong correlation between the estimated and corresponding measured tissue strength for CTRL (r = 0.98, ρ=0.96, k = 0.89) and TAV (r = 0.86, ρ = 0.88, k = 0.90). Strength of correlation for BAV cohort was moderately strong (r = 0.73, ρ = 0.71, k = 0.75). We conjecture that the cause of relatively weak correlation between experimentally measured BAV tissue strength and estimation from Eq. (2) may be due to wider scatter in the experimental strength and failure stretch data for this cohort. Fig. 9d and e present analytically estimated and experimentally measured tissue strength for all cohorts for CIRC and LONG directions, respectively. An excellent agreement between the strengths for all the cohorts can be observed (p > 0.05 for all cases), corroborating the proposed “master-slave” tissue failure mechanism as the primary mechanism governing aortic tissue strength. Further research is required to test whether this mechanism is operative in failure of other soft fibrous tissues.
Fig. 9.
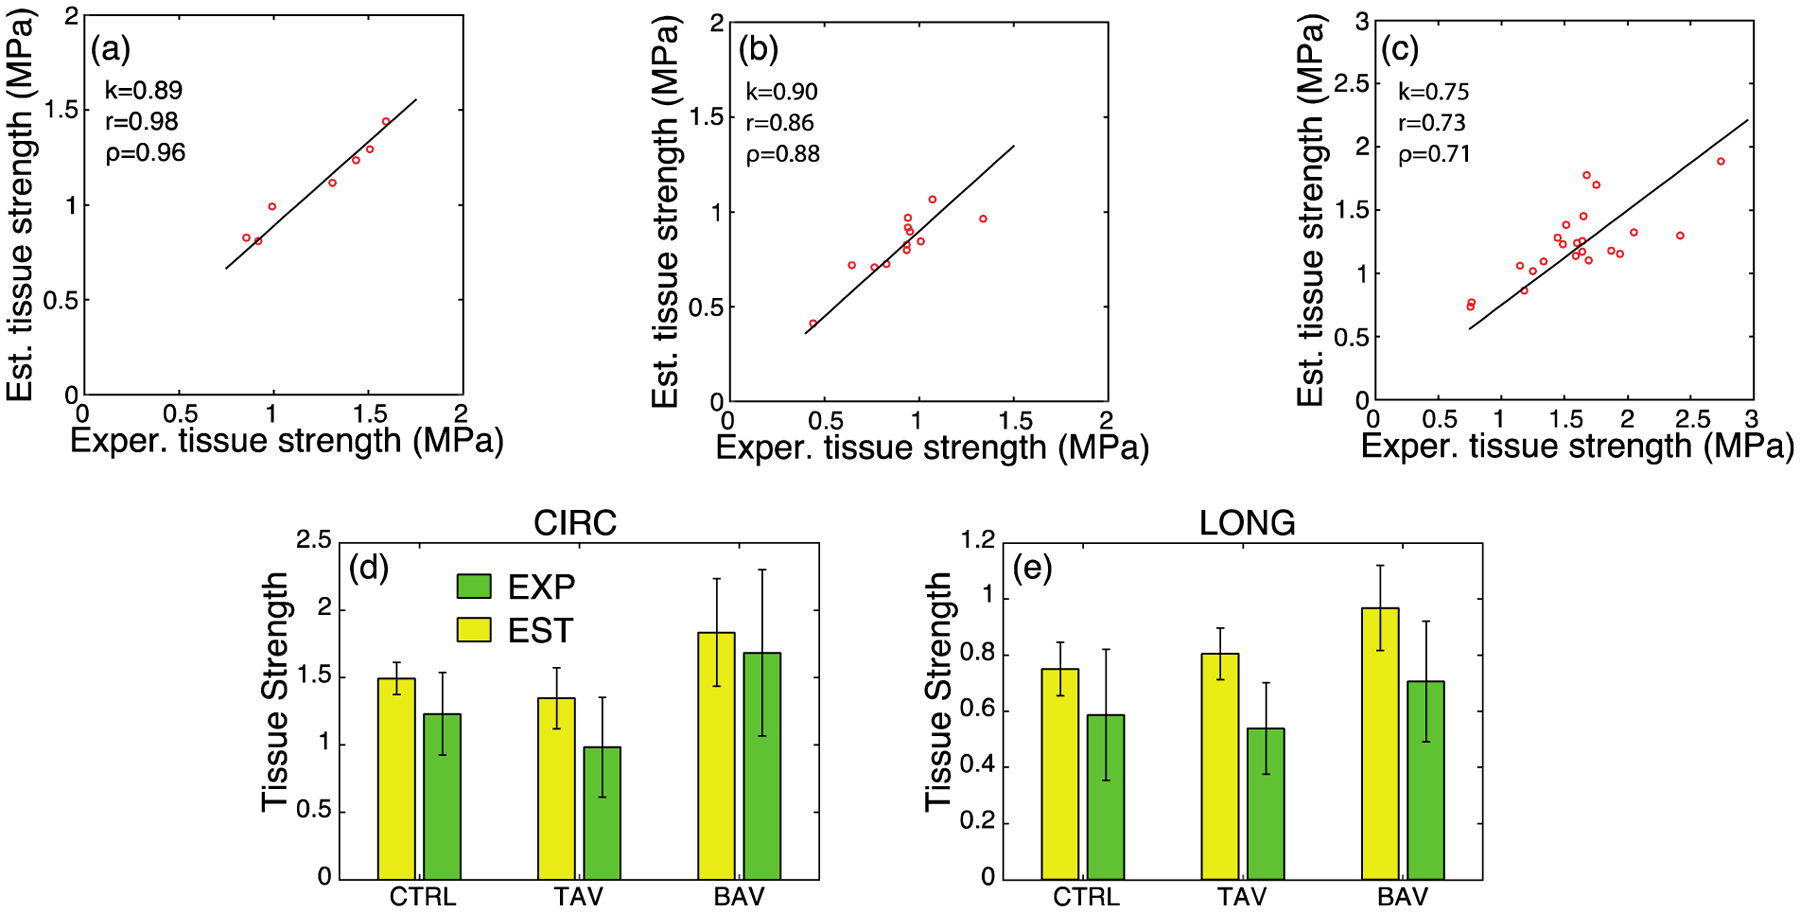
Comparison of the experimental tissue strength and analytically estimated tissue strength using Eq. (2) for the (a) CTRL, (b) TAV, and (c) BAV populations under CIRC loading. k denotes the slope of a regression line through the origin and r and ρ represent the Pearson correlation and Spearman’s rank correlation, respectively. (d) Experimental (green) and estimated (yellow) tissue strengths in the CIRC direction. (e) Experimental (green) and estimated (yellow) tissue strengths in the LONG direction. For all cohorts in both the directions, no statistical difference was found between experimental and corresponding analytically estimated tissue strength.
Recent experiments of ex vivo degradation of the aortic tissue collagen revealed that the wall strength is correlated with collagen content (Schriefl et al., 2015; Weisbecker et al., 2013). Deleterious effect of aging on the tensile strength of the aneurysmal sinus tissue was demonstrated by (Iliopoulos et al., 2013). (Pichamuthu et al., 2013) demonstrated that both CIRC and LONG tensile strengths are higher in BAV patients compared to TAV patients. (Phillippi et al., 2014) reported collagen fiber microstructure in the aortic media ECM is uniquely distinct between aneurysmal BAV and TAV tissue. These prior works circumstantially demonstrate how collagen fiber organization directly influences tissue strength in the human aorta. Barocas and collaborators have recently studied the failure of porcine aortic tissue using a multiscale modeling technique (Shah et al., 2014; Witzenburg et al., 2017). They subjected the tissue model to various loading conditions, and identified collagen fiber failure as the predominant mechanism for tissue failure. Our present study advances prior structure-function theories for tissue failure by identifying the microstructural failure mechanisms in healthy and diseased ATA tissue under in-plane loading conditions. This work suggests that differences in collagen fiber orientation among the considered patient cohorts can explain the differences in their uniaxial aortic tissue strength.
The computational model described here has the following limitations. We did not take into account the anisotropic behavior of elastin fibers (Pukacki et al., 2000; Rezakhaniha et al., 2011), which may contribute differently to the tissue strength anisotropy. We however do not expect that accounting for this phenomenon will change the major conclusions of the current work. Finally, we modeled only the aortic media, while the experimental stress-stretch data were gathered from the specimens of the entire vessel wall. (Iliopoulos et al., 2009a) showed that rupture initiated at the media for majority of the human ATA wall tissue during uniaxial testing, and peak stress was associated with media failure. Additionally, strength of the media is lower than the strength of adventitia for human ATA (Pasta et al., 2013) and other cardiovascular tissues (Holzapfel et al., 2004; Teng et al., 2009), justifying our choice of the modeling region.
We have shown that our computational model is able to accurately recapitulate tissue uniaxial failure response in two orthogonal directions (LONG and CIRC). As all the anisotropy in our model is provided by the collagen fiber architecture only, the model should also be able to estimate tissue failure properties under physiological biaxial loading conditions. Prediction of failure over the entire biaxial loading space will allow for creation of a population-relevant failure envelope for the tissue that, in conjunction with patient specific aorta models, could lead to a metric to evaluate individual dissection risk. Finally, the identification of ECM components responsible for anisotropic ATA tissue strength in health and disease may lead to the design of better therapeutic intervention to minimize the risk of aortic dissection.
Acknowledgements
Research reported in this work was supported in part by NIH Award Number R01HL109132 (TGG), and the NSF Award Number CBET 1511504 (JRT and SM).
Conflict of interest statement
The authors do not have any financial interest or other relationship (grant, research support, consultant, etc.) with any manufacturer(s) of any commercial product(s) to disclose.
References
- Aaron BB, Gosline JM, 1981. Elastin as a random-network elastomer: a mechanical and optical analysis of single elastin fibers. Biopolymers 20, 1247–1260. [Google Scholar]
- Carleton JB, D’Amore A, Feaver KR, Rodin GJ, Sacks MS, 2015. Geometric characterization and simulation of planar layered elastomeric fibrous biomaterials. Acta Biomater. 12, 93–101. [DOI] [PMC free article] [PubMed] [Google Scholar]
- Clark JM, Glagov S, 1985. Transmural organization of the arterial media. The lamellar unit revisited. Arteriosclerosis, Thrombosis, Vascular Biol. 5, 19–34. [DOI] [PubMed] [Google Scholar]
- D’Amore A, Stella JA, Wagner WR, Sacks MS, 2010. Characterization of the complete fiber network topology of planar fibrous tissues and scaffolds. Biomaterials 31, 5345–5354. [DOI] [PMC free article] [PubMed] [Google Scholar]
- Daniel IM, Ishai O, 2006. Engineering Mechanics of Composite Materials. Oxford University Press. [Google Scholar]
- Ferrara A, Morganti S, Totaro P, Mazzola A, Auricchio F, 2016. Human dilated ascending aorta: Mechanical characterization via uniaxial tensile tests. J. Mech. Behav. Biomed. Mater 53, 257–271. [DOI] [PubMed] [Google Scholar]
- Ferruzzi J, Vorp DA, Humphrey JD, 2011. On constitutive descriptors of the biaxial mechanical behaviour of human abdominal aorta and aneurysms. J R Soc. Interface 8, 435–450. [DOI] [PMC free article] [PubMed] [Google Scholar]
- Forsell C, Bjorck HM, Eriksson P, Franco-Cereceda A, Gasser TC, 2014. Biomechanical properties of the thoracic aneurysmal wall: differences between bicuspid aortic valve and tricuspid aortic valve patients. Ann. Thorac. Surg 98, 65–71. [DOI] [PubMed] [Google Scholar]
- Forsell C, Swedenborg J, Roy J, Gasser TC, 2013. The quasi-static failure properties of the abdominal aortic aneurysm wall estimated by a mixed experimental-numerical approach. Ann. Biomed. Eng 41, 1554–1566. [DOI] [PubMed] [Google Scholar]
- Gasser TC, 2011. An irreversible constitutive model for fibrous soft biological tissue: a 3-D microfiber approach with demonstrative application to abdominal aortic aneurysms. Acta Biomater. 7, 2457–2466. [DOI] [PubMed] [Google Scholar]
- Holzapfel GA, Sommer G, Regitnig P, 2004. Anisotropic mechanical properties of tissue components in human atherosclerotic plaques. J. Biomech. Eng 126, 657. [DOI] [PubMed] [Google Scholar]
- Iliopoulos DC, Deveja RP, Kritharis EP, Perrea D, Sionis GD, Toutouzas K, Stefanadis C, Sokolis DP, 2009a. Regional and directional variations in the mechanical properties of ascending thoracic aortic aneurysms. Med. Eng. Phys 31, 1–9. [DOI] [PubMed] [Google Scholar]
- Iliopoulos DC, Kritharis EP, Boussias S, Demis A, Iliopoulos CD, Sokolis DP, 2013. Biomechanical properties and histological structure of sinus of Valsalva aneurysms in relation to age and region. J. Biomech 46, 931–940. [DOI] [PubMed] [Google Scholar]
- Iliopoulos DC, Kritharis EP, Giagini AT, Papadodima SA, Sokolis DP, 2009b. Ascending thoracic aortic aneurysms are associated with compositional remodeling and vessel stiffening but not weakening in age-matched subjects. J. Thorac. Cardiovasc. Surg 137, 101–109. [DOI] [PubMed] [Google Scholar]
- Koch RG, Tsamis A, D’Amore A, Wagner WR, Watkins SC, Gleason TG, Vorp DA, 2014. A custom image-based analysis tool for quantifying elastin and collagen micro-architecture in the wall of the human aorta from multi-photon microscopy. J. Biomech 47, 935–943. [DOI] [PMC free article] [PubMed] [Google Scholar]
- Lake SP, Hadi MF, Lai VK, Barocas VH, 2012. Mechanics of a fiber network within a non-fibrillar matrix: model and comparison with collagen-agarose co-gels. Ann. Biomed. Eng 40, 2111–2121. [DOI] [PMC free article] [PubMed] [Google Scholar]
- Lillie MA, Gosline JM, 2002. The viscoelastic basis for the tensile strength of elastin. Int. J. Biol. Macromol 30, 119–127. [DOI] [PubMed] [Google Scholar]
- MacLean NF, Dudek NL, Roach MR, 1999. The role of radial elastic properties in the development of aortic dissections. J. Vascular Surg 29, 703–710. [DOI] [PubMed] [Google Scholar]
- Maiti S, Geubelle PH, 2004. Mesoscale modeling of dynamic fracture of ceramic materials. CMES-Comput. Model. Eng. Sci 5, 91–101. [Google Scholar]
- Masuda Y, Yamada Z, Morooka N, Watanabe S, Inagaki Y, 1991. Prognosis of patients with medically treated aortic dissections. Circulation 84, III7–13. [PubMed] [Google Scholar]
- Meszaros I, Morocz J, Szlavi J, Schmidt J, Tornoci L, Nagy L, Szep L, 2000. Epidemiology and clinicopathology of aortic dissection. Chest 117, 1271–1278. [DOI] [PubMed] [Google Scholar]
- Miyazaki H, Hayashi K, 1999. Tensile tests of collagen fibers obtained from the rabbit patelar tendon. Biomed. Microdevices 2, 151–157. [Google Scholar]
- Nishimura RA, Otto CM, Bonow RO, Carabello BA, Erwin JP 3rd, Guyton RA, O’Gara PT, Ruiz CE, Skubas NJ, Sorajja P, Sundt TM 3rd, Thomas JD, 2014. 2014 AHA/ACC Guideline for the management of patients with valvular heart disease: a report of the american college of cardiology/american heart association task force on practice guidelines. Circulation 129, e521–643. [DOI] [PubMed] [Google Scholar]
- O’Connell MK, Murthy S, Phan S, Xu C, Buchanan J, Spilker R, Dalman RL, Zarins CK, Denk W, Taylor CA, 2008. The three-dimensional micro- and nanostructure of the aortic medial lamellar unit measured using 3D confocal and electron microscopy imaging. Matrix Biol. 27, 171–181. [DOI] [PMC free article] [PubMed] [Google Scholar]
- Pal S, Tsamis A, Pasta S, D’Amore A, Gleason TG, Vorp DA, Maiti S, 2014. A mechanistic model on the role of “radially-running” collagen fibers on dissection properties of human ascending thoracic aorta. J. Biomech 47, 981–988. [DOI] [PMC free article] [PubMed] [Google Scholar]
- Parish LM, Gorman JH 3rd, Kahn S, Plappert T, St John-Sutton MG, Bavaria JE, Gorman RC, 2009. Aortic size in acute type A dissection: implications for preventive ascending aortic replacement. Eur. J. Cardiothorac. Surg 35, 941–945. discussion 945–946. [DOI] [PubMed] [Google Scholar]
- Pasta S, Phillippi JA, Tsamis A, D’Amore A, Raffa GM, Pilato M, Scardulla C, Watkins SC, Wagner WR, Gleason TG, Vorp DA, 2016. Constitutive modeling of ascending thoracic aortic aneurysms using microstructural parameters. Med. Eng. Phys 38, 121–130. [DOI] [PMC free article] [PubMed] [Google Scholar]
- Pasta S, Rinaudo A, Luca A, Pilato M, Scardulla C, Gleason TG, Vorp DA, 2013. Difference in hemodynamic and wall stress of ascending thoracic aortic aneurysms with bicuspid and tricuspid aortic valve. J. Biomech 46, 1729–1738. [DOI] [PMC free article] [PubMed] [Google Scholar]
- Phillippi JA, Green BR, Eskay MA, Kotlarczyk MP, Hill MR, Robertson AM, Watkins SC, Vorp DA, Gleason TG, 2014. Mechanism of aortic medial matrix remodeling is distinct in patients with bicuspid aortic valve. J. Thorac. Cardiovasc. Surg 147, 1056–1064. [DOI] [PMC free article] [PubMed] [Google Scholar]
- Pichamuthu JE, Phillippi JA, Cleary DA, Chew DW, Hempel J, Vorp DA, Gleason TG, 2013. Differential tensile strength and collagen composition in ascending aortic aneurysms by aortic valve phenotype. Ann. Thorac. Surg 96, 2147–2154. [DOI] [PMC free article] [PubMed] [Google Scholar]
- Pierce DM, Maier F, Weisbecker H, Viertler C, Verbrugghe P, Famaey N, Fourneau I, Herijgers P, Holzapfel GA, 2015. Human thoracic and abdominal aortic aneurysmal tissues: Damage experiments, statistical analysis and constitutive modeling. J. Mech. Behav. Biomed. Mater 41, 92–107. [DOI] [PubMed] [Google Scholar]
- Pukacki F, Jankowski T, Gabriel M, Oszkinis G, Krasinski Z, Zapalski S, 2000. The mechanical properties of fresh and cryopreserved arterial homografts. Eur. J. Vasc. Endovasc. Surg 20, 21–24. [DOI] [PubMed] [Google Scholar]
- Raghavan ML, Webster MW, Vorp DA, 1996. Ex vivo biomechanical behavior of abdominal aortic aneurysm: Assessment using a new mathematical model. Ann. Biomed. Eng 24, 573–582. [DOI] [PubMed] [Google Scholar]
- Rezakhaniha R, Fonck E, Genoud C, Stergiopulos N, 2011. Role of elastin anisotropy in structural strain energy functions of arterial tissue. Biomech. Model Mechanobiol 10, 599–611. [DOI] [PubMed] [Google Scholar]
- Roach MR, He JC, Kratky RG, 1999. Tear propagation in isolated, pressurized porcine thoracic aortas. Can. J. Cardiol 15, 569–575. [PubMed] [Google Scholar]
- Saez P, Alastrue V, Pena E, Doblare M, Martinez MA, 2012. Anisotropic microsphere-based approach to damage in soft fibered tissue. Biomech. Model. Mechanobiol 11, 595–608. [DOI] [PubMed] [Google Scholar]
- Schriefl AJ, Schmidt T, Balzani D, Sommer G, Holzapfel GA, 2015. Selective enzymatic removal of elastin and collagen from human abdominal aortas: uniaxial mechanical response and constitutive modeling. Acta Biomater. 17, 125–136. [DOI] [PubMed] [Google Scholar]
- Schriefl AJ, Zeindlinger G, Pierce DM, Regitnig P, Holzapfel GA, 2012. Determination of the layer-specific distributed collagen fibre orientations in human thoracic and abdominal aortas and common iliac arteries. J R Soc. Interface 9, 1275–1286. [DOI] [PMC free article] [PubMed] [Google Scholar]
- Shah SB, Witzenburg C, Hadi MF, Wagner HP, Goodrich JM, Alford PW, Barocas VH, 2014. Prefailure and failure mechanics of the porcine ascending thoracic aorta: experiments and a multiscale model. J. Biomech. Eng 136, 021028. [DOI] [PMC free article] [PubMed] [Google Scholar]
- Shahmansouri N, Alreshidan M, Emmott A, Lachapelle K, Cartier R, Leask RL, Mongrain R, 2016. Evaluating ascending aortic aneurysm tissue toughness: Dependence on collagen and elastin contents. J. Mech. Behav. Biomed. Mater 64, 262–271. [DOI] [PubMed] [Google Scholar]
- Sokolis DP, Kefaloyannis EM, Kouloukoussa M, Marinos E, Boudoulas H, Karayannacos PE, 2006. A structural basis for the aortic stress-strain relation in uniaxial tension. J. Biomech 39, 1651–1662. [DOI] [PubMed] [Google Scholar]
- Sokolis DP, Kritharis EP, Giagini AT, Lampropoulos KM, Papadodima SA, Iliopoulos DC, 2012. Biomechanical response of ascending thoracic aortic aneurysms: association with structural remodelling. Comput. Methods Biomech. Biomed. Eng 15, 231–248. [DOI] [PubMed] [Google Scholar]
- Svensson LG, Adams DH, Bonow RO, Kouchoukos NT, Miller DC, O’Gara PT, Shahian DM, Schaff HV, Akins CW, Bavaria J, Blackstone EH, David TE, Desai ND, Dewey TM, D’Agostino RS, Gleason TG, Harrington KB, Kodali S, Kapadia S, Leon MB, Lima B, Lytle BW, Mack MJ, Reece TB, Reiss GR, Roselli E, Smith CR, Thourani VH, Tuzcu EM, Webb J, Williams MR, 2013. Aortic valve and ascending aorta guidelines for management and quality measures: executive summary. Ann. Thorac. Surg 95, 1491–1505. [DOI] [PubMed] [Google Scholar]
- Tang PC, Coady MA, Lovoulos C, Dardik A, Aslan M, Elefteriades JA, Tellides G, 2005. Hyperplastic cellular remodeling of the media in ascending thoracic aortic aneurysms. Circulation 112, 1098–1105. [DOI] [PubMed] [Google Scholar]
- Teng Z, Tang D, Zheng J, Woodard PK, Hoffman AH, 2009. An experimental study on the ultimate strength of the adventitia and media of human atherosclerotic carotid arteries in circumferential and axial directions. J. Biomech 42, 2535–2539. [DOI] [PMC free article] [PubMed] [Google Scholar]
- Thunes JR, Pal S, Fortunato RN, Phillippi JA, Gleason TG, Vorp DA, Maiti S, 2016. A structural finite element model for lamellar unit of aortic media indicates heterogeneous stress field after collagen recruitment. J. Biomech 49, 1562–1569. [DOI] [PMC free article] [PubMed] [Google Scholar]
- Tiessen IM, Roach MR, 1993. Factors in the initiation and propagation of aortic dissections in human autopsy aortas. J. Biomech. Eng 115, 123. [DOI] [PubMed] [Google Scholar]
- Volokh KY, 2008. Prediction of arterial failure based on a microstructural bi-layer fiber-matrix model with softening. J. Biomech 41, 447–453. [DOI] [PubMed] [Google Scholar]
- Weisbecker H, Viertler C, Pierce DM, Holzapfel GA, 2013. The role of elastin and collagen in the softening behavior of the human thoracic aortic media. J. Biomech 46, 1859–1865. [DOI] [PubMed] [Google Scholar]
- Witzenburg CM, Dhume RY, Shah SB, Korenczuk CE, Wagner HP, Alford PW, Barocas VH, 2017. Failure of the porcine ascending aorta: multidirectional experiments and a unifying microstructural model. J. Biomech. Eng 139. [DOI] [PMC free article] [PubMed] [Google Scholar]
- Wolinsky H, Glagov S, 1967. A lamellar unit of aortic medial structure and function in mammals. Circ. Res 20, 99–111. [DOI] [PubMed] [Google Scholar]
- Zou Y, Zhang Y, 2009. An experimental and theoretical study on the anisotropy of elastin network. Ann. Biomed. Eng 37, 1572–1583. [DOI] [PubMed] [Google Scholar]
- Zulliger MA, Stergiopulos N, 2007. Structural strain energy function applied to the ageing of the human aorta. J. Biomech 40, 3061–3069. [DOI] [PubMed] [Google Scholar]


