Abstract
Growth laws emerging from studies of cell populations provide essential constraints on the global mechanisms that coordinate cell growth1–3. The foundation of bacterial cell cycle studies relies on two interconnected dogmas that were proposed more than 50 years ago—the Schaechter–Maaloe–Kjeldgaard growth law that relates cell mass to growth rate1 and Donachie’s hypothesis of a growth-rate-independent initiation mass4. These dogmas spurred many efforts to understand their molecular bases and physiological consequences5–14. Although they are generally accepted in the fast-growth regime, that is, for doubling times below 1 h, extension of these dogmas to the slow-growth regime has not been consistently achieved. Here, through a quantitative physiological study of Escherichia coli cell cycles over an extensive range of growth rates, we report that neither dogma holds in either the slow- or fast-growth regime. In their stead, linear relations between the cell mass and the rate of chromosome replication–segregation were found across the range of growth rates. These relations led us to propose an integral-threshold model in which the cell cycle is controlled by a licensing process, the rate of which is related in a simple way to chromosomal dynamics. These results provide a quantitative basis for predictive understanding of cell growth–cell cycle relationships.
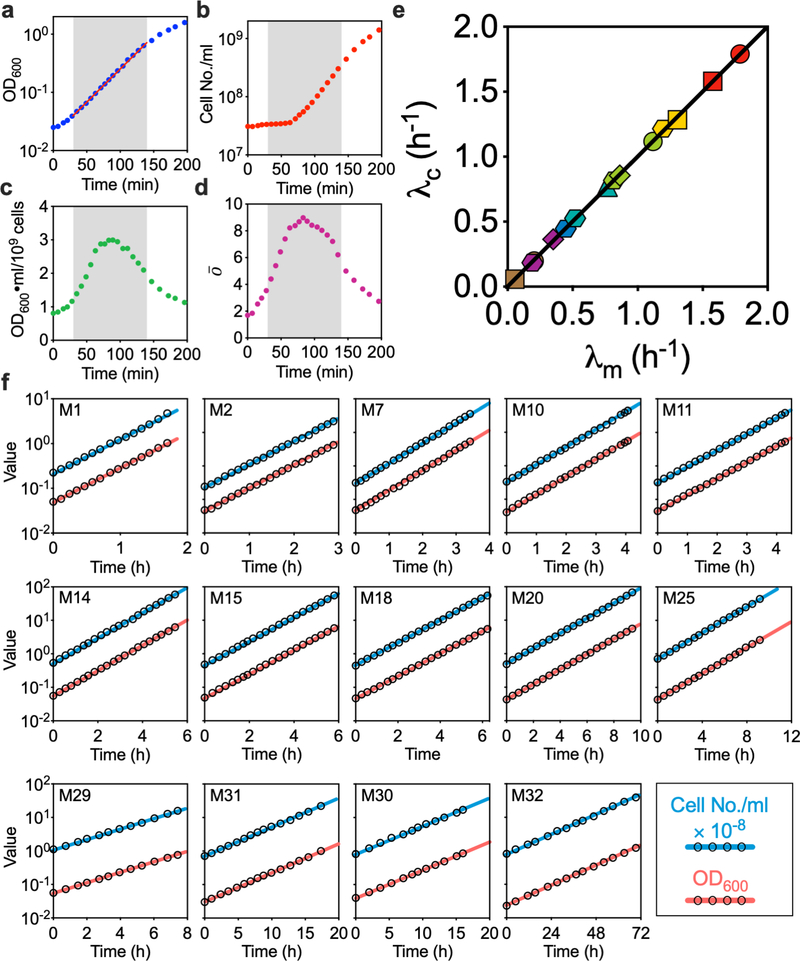
A fundamental notion in the quantitative study of bacterial physiology is steady-state growth15,16, where the rate of total cell-mass growth (λm) is identical to the rate of cell number growth (λc). The steady-state growth of laboratory strains of Escherichia coli is commonly characterized as either fast or slow, depending on whether the cell-doubling time is below or above 1 h (ref. 17). To cover both growth regimes, we cultured E. coli K12 MG1655 cells in 32 different growth media with corresponding nutrient-imposed growth rates ranging from 0.06 h−1 to 1.7 h−1 (doubling times ranging from ~700 min to 24 min, respectively; Extended Data Fig. 1). To obtain quantitative relationships that were as accurate and reproducible as possible, special care was taken to ensure that all of the experimental cultures in this study lie on the steady-state line λm = λc, which is hereafter designated as λ (Extended Data Fig. 2).
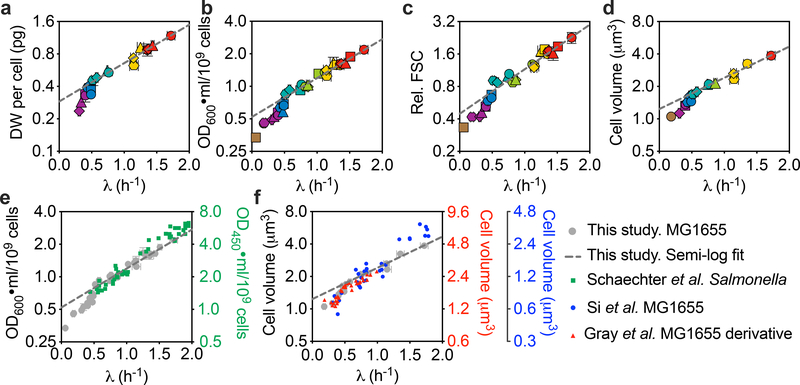
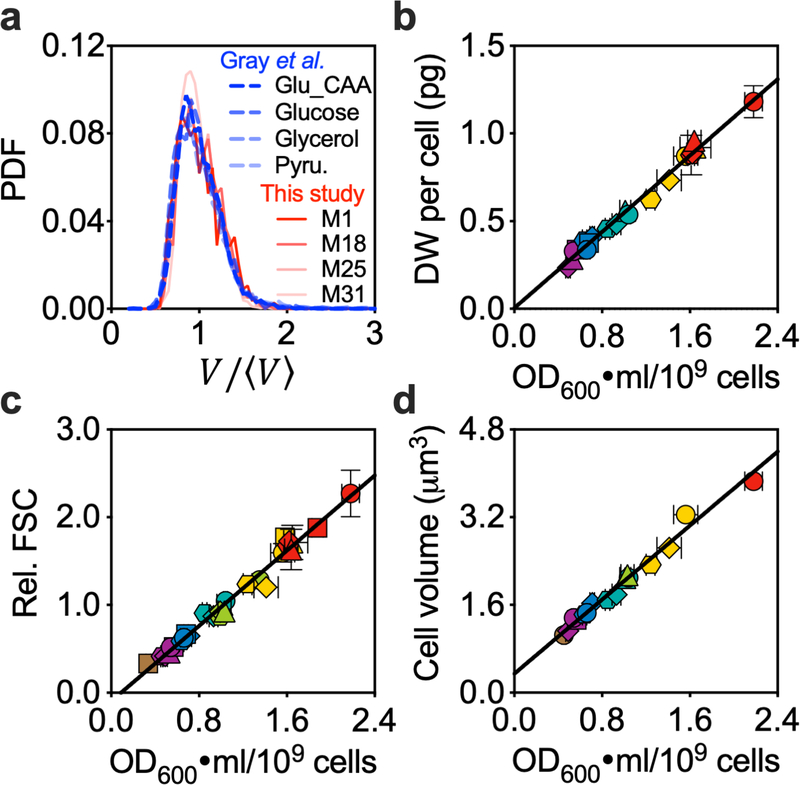
The Schaechter–Maaloe–Kjeldgaard (SMK) growth law1 states that the population-averaged cellular mass () scales exponentially with growth rate λ, that is , where T is a growth-rate-independent constant of ~1 h. We examined several Imeasures of , including dry weight (DW), optical density (OD) and cell size using flow cytometry and microscopy imaging (see Methods). For each measure, the data for plotted against growth rate on semi-log axes did not show the expected linear relationship (Fig. 1a–d) but, rather, what could be loosely described as two linear regions with a break near λ = 0.7 h−1 (that is, a doubling time of 1 h). Notably, a linear fit to the fast-growth data alone resulted in a value of T that differed from 1 h. Our OD data seem to be in good agreement with those obtained by Schaechter et al.1 (Fig. 1e, green squares) for the mostly fast growth rates that they analysed, even though they studied a Salmonella strain. We also extracted cell size data from recent studies by Si et al.5 and Gray et al.18, and found that their data are consistent with ours (Fig. 1f, blue and red symbols). Aside from the average cell size, even the size distributions appear to be indistinguishable for a variety of growth media18 (Extended Data Fig. 3a). Given the equivalence of different measures of cell mass (Extended Data Fig. 3b–d), OD at 600 nm (OD600) ml per cell was used as the measure of throughout the rest of this study.
Fig. 1 |. SMK growth law does not describe the steady-state growth of E. coli.
The SMK growth law states that , where T is a growth-rate-independent constant of ~1 h, but this is an incorrect description, even in the fast growth regime, where λ > 0.7 h−1. a-d, Population-averaged DW per cell (a), OD600 ml per 109 cells (b), relative FSC (normalized to the FSC of cells grown in M18) (c) or cell volume from microscopy images (d) plotted against growth rate on semi-log axes. All of the experimental cultures were ensured to be in steady state (Extended Data Fig. 2; see Methods). The different symbols indicate different growth media (Extended Data Fig. 1). For a–c and the x axis of d, data are mean ± s.d.; for the y axis of d, data are mean with the 95% confidence intervals (CIs) of population-averaged cell volume. Sample sizes and the mean values for each symbol are provided in Extended Data Fig. 8. Many of the error bars are smaller than the size of the symbols. The straight dashed lines were semi-log fit to the data in fast-growth regime (λ > 0.7 h−1); the slopes of the lines for a–d are 0.82, 0.83, 0.95 and 0.67, respectively, which—in most cases—differs substantially from the value 1 asserted by the SMK growth law and also required by Donachie’s cell-mass relation (see the main text). Data from the slow-growth regime deviated from the lines in all cases. e, Comparison between the optical density data from b (grey circles) and the original data from Schaechter et al.1. The error bars of the grey circles are presented in the same manner as in b; the green squares are the data of each individual experiment, with no statistical methods applied. f, Comparison between the cell volume data from d (grey circles) and the datasets extracted from recent reports, Gray et al.18 (red triangles, first right y axis) or Si et al.5 (blue dots, second right y axis). The data from Gray et al.18 are quite similar to ours in the region of overlap, including an apparent transition at λ ≈ 0.7 h−1 in this semi-log plot. The behaviour of the data from Si et al.5 near to growth rates of ~0.7 h−1 is difficult to discern owing to the sparseness of the data. We note that, even though all three studies (Gray et al.18, Si et al.5 and the present study) characterized the cell volume on the basis of microscopy images, the absolute cell volumes reported by the different studies differ by about twofold. Such systematic differences probably reflect the different image-processing methods used, as reported previously40. Gray et al.18 and the present study used two closely related software packages, Oufti41 and MicrobeTracker42, respectively, to characterize cell volume, and the resulting values are considerably more comparable with each other than with those of Si et al.5. The error bars of the grey circles in e and f are as described for those in b and d, respectively. Data points other than the grey circles are presented as their original value in the publications, with no further statistics applied; the CIs or s.d. of the population-averaged cell volume have been omitted for simplicity.
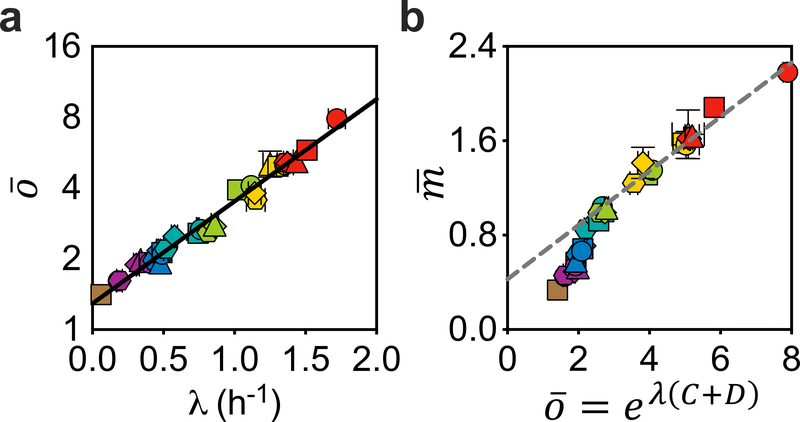
Donachie proposed a physiological interpretation of the parameter T in the SMK law, namely, T = C + D, where C is the time required to replicate the chromosome and D is the time interval between termination of replication and completion of cell division4. The sum C + D is referred to here as the replication–segregation time, that is, the time elapsed between the initiation of a round of DNA replication and the cell division at which the corresponding sister chromosomes segregate17. This refined SMK growth law, referred to here as Donachie’s cell-mass relation, therefore takes the form , which was recently tested under various perturbations5,6. Within the Cooper–Helmstetter framework, the quantity eλ(c+D) is just the population-averaged number of DNA replication origins per cell19, denoted as . We measured this quantity directly as previously described6,20 (see Methods) and observed an exponential relation throughout the range of growth rates (Fig. 2a). Thus, we obtain the following equation
| (1) |
Fig. 2 |. Donachie’s cell-mass relation does not hold.
Standard run-out experiments6,20 followed by flow cytometry analysis were applied to quantify the population-averaged number of DNA replication origins per cell (see Methods). a, Semi-log plot of versus growth rate λ. The straight line is a semi-log fit , with best fit values α = 0.28 and β = 0.99 h (R2 > 0.97). b, Population-averaged cellular mass (in units of OD600 ml per 109 cells) is not proportional to eλ(C + D). The straight line is linear fit to the data in the fast-growth regime (λ > 0.7 h−1). The linear fit does not go through the origin, clearly showing that is not proportional to eλ(C + D), even for fast-growth rates. For a and b, data are mean ± s.d.; many of the error bars are smaller than the size of the symbols. Sample sizes and mean values for each symbol are provided in Extended Data Fig. 8.
Equation (1) defines an empirical relation between C + D and growth rate, yielding a Michaelis–Menten-like formula for the rate of the replication–segregation process, . A number of authors have determined population-averaged C + D or at various growth rates for E. coli5,21–23. Michelsen et al.22 in particular obtained data far into the slow-growth regime. When compared to these published data, equation (1) provides a good fit in all cases (Extended Data Fig. 4), using the α and β values fixed from our data alone. Studies of single cells in a microfluidics device by Wallden et al.24 previously found that C + D varies with binned growth rate, and they obtained a three-parameter fit that is qualitatively similar to equation (1). The relationship between their results and those obtained in batch culture across different nutrient conditions remains to be established.
Given equation (1), Donachie’s cell-mass relation would predict , that is, the SMK growth law. The breakdown of the SMK growth law (Fig. 1) therefore implies that Donachie’s cell-mass relation cannot hold either. Indeed, the relation between and eλ(C + D) (represented by ) is not linear (Fig. 2b). We note that, although a good linear fit can be obtained for data in the fast-growth regime (Fig. 2b, dashed line), it would require a non-zero intercept, which indicates that Donachie’s cell-mass relation does not hold.
This led us to directly examine Donachie’s hypothesis of a constant initiation mass4, which states that the cell’s mass per replication origin has a growth-rate-independent value at the time of DNA-replication initiation. The original derivation required that C + D is constant over growth rates4. This holds approximately at fast growth but is known to break down in the slow-growth regime17,21,22. A consistent modelling framework that extends the constant-initiation-mass hypothesis across all growth rates has been lacking. This hypothesis has nevertheless been used as the starting point of numerous modelling studies5,25 and has been examined quantitatively over a variety of growth conditions by multiple recent studies5,7,24. Results of these studies are all consistent with the constant-initiation-mass hypothesis despite challenges by some early studies9,10,26–28.
The initiation mass can be obtained by the relation (ref. 29); our data (Fig. 3a) clearly show that the initiation mass is not constant, with a non-monotonic dependence on the growth rates, peaking at λ ≈ 0.7 h−1 (a doubling time of 1 h). Although we conclude that Donachie’s hypothesis is incorrect, our data are actually largely consistent with those from recent studies, although the sparsity and variability of those data gave the appearance of a constant initiation mass—Wallden et al.24 directly measured the single-cell initiation volume in three different growth conditions and found that it is constant. However, we note that the conditions tested in their study were at a different temperature (Fig. 3b), which is known to affect growth rate but has little effect on cell mass1, making it difficult to compare to our results obtained at 37 °C. Si et al.5 used a combination of microscopy imaging and run-out experiments to quantify the initiation volume. They reported the constancy of initiation mass for different growth rates under various perturbations. However, their data show considerable variability (Fig. 3c, green diamonds) and cannot rule out the tight trend suggested by our data (grey circles).
Fig. 3 |. Donachie’s constant-initiation-mass hypothesis breaks down.
During steady-state growth, wild-type bacterial cells initiate DNA replication at all available origins synchronously once per cell cycle. The cell mass per origin at initiation, termed the initiation mass, was hypothesized by Donachie to be a constant independent of growth rate. a, The initiation mass mi (in units of 10−10 OD600 ml, characterized as described in the main text) is plotted against growth rate λ. In contrast to the Donachie hypothesis, it varied by ~50% across different growth rates, reaching a peak value ~5.5 × 10⁻¹⁰ OD600 ml at a growth rate 0.7 h−1. The growth rate dependence of the initiation mass is well described by the black curve from . b, Comparison between the data from a (grey circles) and those extracted from Wallden et al.24 (MG1655, red squares, right y axis). For the data from Wallden et al.24, the error bars for initiation volume are set to 10% as they described; the error bars for growth rate represent the s.d. at the single-cell level as they described. The culture temperature for the middle data point (arrow) was 30 °C, while the other two data points and ours were obtained at 37 °C. c, Comparison between the data from a (grey circles) and those extracted from Si et al.5 (MG1655, green diamonds, right y axis). The error bars for the data from Si et al.5 represent the s.d. of biological replicates. d, Relative DnaA protein concentration exhibits a non-monotonic dependence on growth rate. Relative DnaA protein concentration varied by ~50%, reaching a minimum value at ~0.7 h−1, approximately where the initiation mass reaches a peak. It was quantified by quantitative proteomics and was normalized to the population average of the total protein concentration across growth rates (see Methods). Except for the data points that have already been published elsewhere and described above (the red squares in b and the green diamonds in c), in a–d, data are mean ± s.d.; many of the error bars are smaller than the size of the symbols. Sample sizes and mean values for each symbol are provided in Extended Data Fig. 8.
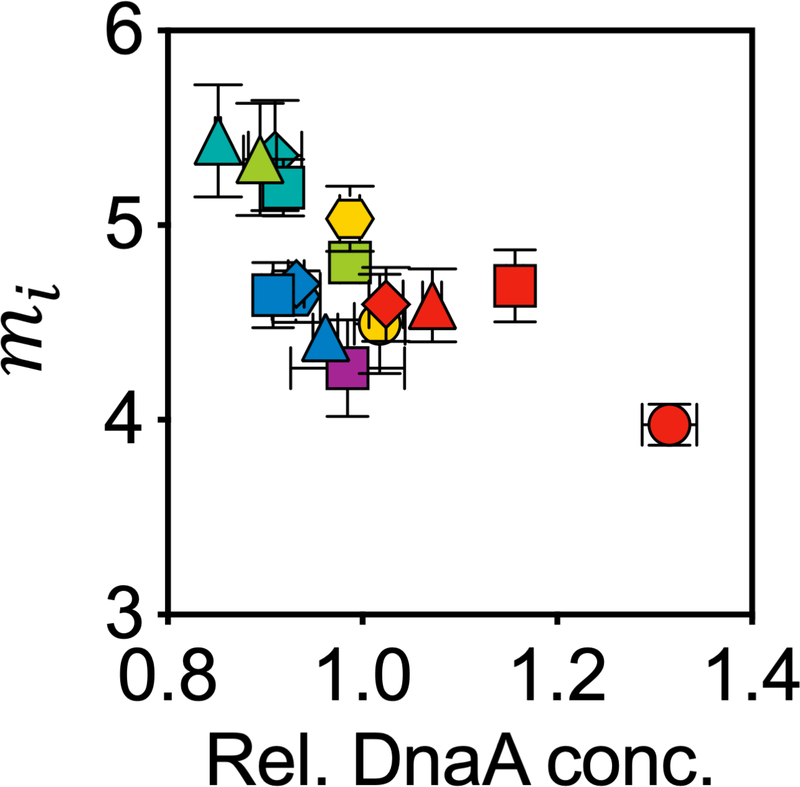
At the molecular level, DnaA is centrally involved in the initiation of DNA replication in E. coli. Its expression level was found to correlate negatively with the initiation mass in a DnaA-titratable strain8. Using quantitative proteomics (see Methods), we found that the protein concentration of DnaA was also negatively correlated with the initiation mass in wild-type cells (Extended Data Fig. 5), and their growth-rate dependences were mirror images of each other (compare Fig. 3d with Fig. 3a). However, this finding does not necessarily imply a causative relationship in wild-type cells, but could be the result of an underlying mechanism that controls both.
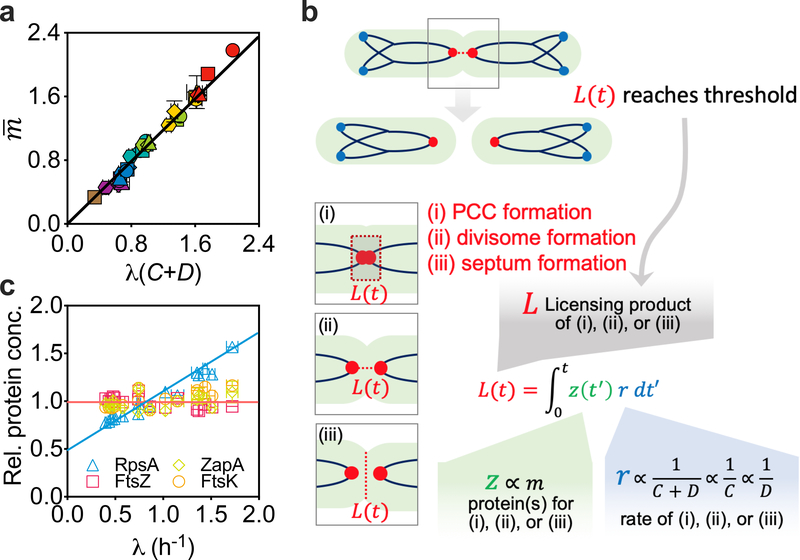
The breakdown of the two longstanding dogmas may simply suggest that the regulation of the cell cycle in the slow- and fast-growth regimes is intrinsically different. However, our data suggest otherwise. Plotting the data in Fig. 2b directly against λ(C + D) revealed a crisp linear relation (R2 > 0.97) across the entire growth-rate range examined (Fig. 4a),
| (2) |
with the best-fit slope m0 = 1.00 ± 0.013 OD600 ml per 109 cells or 0.545 ± 0.015 pg DW per cell (Extended Data Fig. 3b). This simple relation suggests the existence of a unifying mechanism that governs cell cycle progression in both slow- and fast-growth conditions. The population-averaged cellular mass is proportional to λ(C + D), which is a measure of the number of generations elapsed during the period C + D (ref. 30). Equations (1) and (2) yield an initiation mass (that is, cellular mass at initiation divided by the number of replication origins) that is growth-rate dependent, . This relation peaks at α + βλ = λ(C + D) = 1 (a doubling time of ~55 min) and captures well the non-monotonic behaviour of our experimental data (Fig. 3a, solid line).
Fig. 4 |. The linear relation given by equation (2) unifies the slow- and fast-growth regimes.
a, The population-averaged cellular mass scales linearly with λ(C + D), a measure of the generation number during the time from initiation of a round of DNA replication to the cell division at which the corresponding sister chromosomes segregate. b, Hypothetical mechanistic basis of the integral threshold model. The key feature of our model is that cell division depends on the synthesis of a licensing product, which could be the PCC11 (i), divisome33,34 (ii), septum33,34 (iii) or their combinations. c, Quantitative proteomics showed that the concentrations of ZapA, FtsK and FtsZ, which are proposed to be involved in PCC formation or septum formation, were roughly constant across different growth rates, suggesting that they are candidate proteins involved in the synthesis (or construction) of the licensing product. By contrast, the concentration of RpsA, a ribosomal protein, increased linearly with growth rate, suggesting that it is not directly involved in such synthesis. For a and c, data are mean ± s.d.; many of the error bars are smaller than the size of the symbols. Sample sizes and mean values for each symbol are provided in Extended Data Fig. 8.
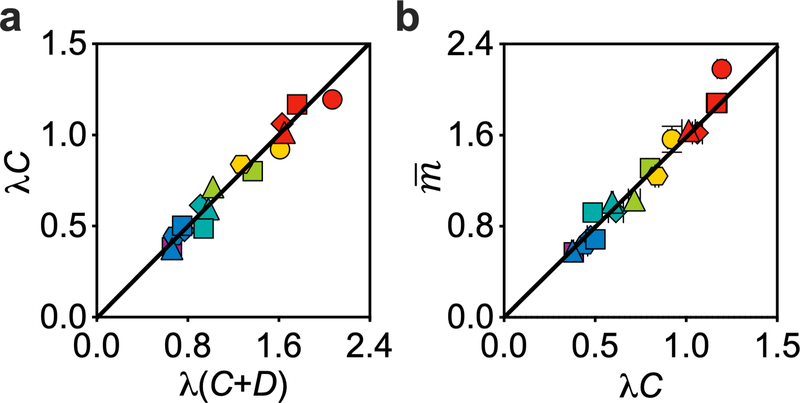
We further determined the C period using a deep-sequencing version of standard methods6,19 for a subset of 16 media (Extended Data Fig. 6; see Methods) and found that C period is proportional to C+D by a factor b = 0.625 ± 0.011 (Extended Data Fig. 7a). Given this relation, equation (2) can be written alternatively as , another linear relation that is supported by a direct plot of the data, with (Extended Data Fig. 7b). Owing to the linear relationship between C and C + D, equation (2) also implies that , which, if any of these steady-state relations directly reflect causative mechanisms, awaits further experimentation.
To explore a more dynamical picture, we considered the impact of equation (2) in constraining a class of simple models31,32, where a product of an accumulation process licenses cell division after reaching a threshold. This licensing product could be the divisome33,34, the septum34,35 and/or the proposed progress control complex (PCC)11, all of which are constructed during the time leading up to cell division (Fig. 4b). Mathematically, the synthesis of this product, accumulated to a level L(t) at time t since the most recent division and reset to zero at division, can be implemented by one or a collection of proteins of abundance z per cell (proportional to the cell mass) working at a specific synthesis rate r, such that (Fig. 4b).
The growth-rate dependence of cell mass would arise in such a model through that of z and r. To obtain the growth-rate dependence of z, we generated extensive quantitative proteomics data across the spectrum of growth rates studied (see Methods). The analyses of these data revealed that the proteome fraction of hypothetical proteins involved in PCC formation (ZapA and FtsK)11, as well as the representative protein for septum formation (FtsZ)33,34, were all relatively independent of the growth rate (coefficient of variation was less than 10%); by contrast, the ribosomal protein RpsA varied strongly with growth rate (Fig. 4c). The cell-mass relation given in equation (2) is then recovered when the specific synthesis rate r of the licensed product is proportional to 1/(C + D), 1/C or 1/D. At the mechanistic level, this proportionality suggests that there is a quantitative link between the licensing process and chromosome dynamics, for example, the rate of DNA elongation, which occurs at rate 1/C, the rate of chromosome segregation, which occurs at a rate of approximately 1/D, or their combination. This then suggests how the growth-rate dependence of cell mass can be directly connected to the growth-rate dependence of the C and/or D period (Supplementary Notes 2). Numerical simulations of this integral-threshold cell-division model were also seen to reproduce key features of cell division at both the population and single-cell levels (Supplementary Notes 2 and 3). Our model can be viewed as an extension of the threshold model of Si et al.32 to incorporate the observed growth-rate dependences, and, in the process, connect cell division events to chromosomal dynamics without involving replication initiation. Further comparison with previous models suggested that our model permits the reconciliation of the recently suggested accumulator31,32 and concurrent13 models for coordinating the chromosomal cycle, the cell division cycle and cell-mass increase (Supplementary Notes 4).
Here, our experimental results from steady-state batch culture clearly demonstrated that two long-standing dogmas—the SMK growth law and Donachie’s constant-initiation-mass hypothesis—do not hold for either the fast- or slow-growth regimes. Instead, we revealed linear relations between cell mass and the dynamics of DNA elongation and/or segregation, covering both the slow- and fast-growth regimes in a unified manner. The linear relations directly refute Donachie’s hypothesis. More generally, it refutes the long-standing idea that cell division is enslaved to DNA-replication initiation control, with strong repercussions for the many existing cell-cycle models that take the constant initiation mass as a central assumption5,25,36,37. Instead, our data and model support recent ideas that the target of division control is the division process itself, but with inputs from chromosomal events11,31,32,38. These findings also shift the consideration of chromosomal events from a focus on replication initiation to DNA elongation and/or segregation as the critical chromosomal processes, as previously proposed by one of the authors of this paper11. Going forward, the relationships revealed by this study provide a rigorous and quantitative framework for further defining the biological processes and molecular components that govern the cell cycle of E. coli.
Methods
Bacterial strain and growth media.
The bacterial cell strain used in this study was E. coli K12 AMB1655, which was provided by A. Danchin of AMAbiotics. Growth media with different compositions of nutrients were used to attain different growth rates. Detailed information on these media is provided in Extended Data Fig. 1 and Supplementary Table 1.
Culture procedure.
Unless otherwise stated, we picked 3–5 single colonies from an LB agar plate and inoculated these colonies into 14 ml round-bottom test tubes containing 2 ml of the desired culture medium. Test tubes were kept in a shaker (220 r.p.m., Shanghai Zhichu Instrument) overnight (or longer, for slow-growth media) at 37 °C as the seed-culture procedure. Given the extremely slow growth rate of cells grown in media M29–M32, M18 was used as the growth medium for the seed-culture procedure. The seed cultures were centrifuged and then washed with the desired culture medium before inoculation into the desired medium for further experiments. The following culture procedure was applied to demonstrate that exponential mass growth does not by itself indicate steady-state growth. Seed cultures were inoculated into prewarmed fresh medium with a starting OD600 of approximately 0.02 and were cultured in a water-bath shaker (150 r.p.m., Shanghai Zhichu Instrument) at 37 °C. The OD600, cell number concentration and population-averaged cellular origin number were characterized simultaneously at different time points to generate Extended Data Fig. 2a–d. The following culture procedure was applied to verify the establishment of the steady-state growth. Seed cultures were inoculated into prewarmed fresh medium with a starting OD600 of approximately 0.02 and cultured in a water-bath shaker (150 r.p.m.) at 37 °C. Successive dilutions were performed by transferring cell suspension into prewarmed fresh medium with a dilution ratio of 1:9 once the OD600 reached 0.2 and repeated for another two rounds. The OD600 and cell-number concentration were then characterized at different time points. During the sampling procedure, successive dilutions were performed with a dilution ratio of 1:4 once the OD600 reached 0.2. The time point for taking the initial sample is denoted as time 0 in Extended Data Fig. 2f. Except for the above-mentioned protocols that were established for specific purposes, the following culture procedure was applied to establish steady-state growth. Seed cultures were inoculated into prewarmed fresh medium with a starting OD600 of approximately 0.02 and cultured in a water-bath shaker (150 r.p.m.) at 37 °C. Successive dilutions were performed by transferring cell suspension into prewarmed fresh medium with a dilution ratio of 1:9 once the OD600 reached 0.2 and repeated for another two rounds. The OD600 growth curve was then characterized to calculate the steady-state growth rate (λ). Samples to quantify the , C + D, C, , DW per cell, RNA + protein per cell and forward scatter (FSC) per cell were collected at an OD600 of approximately equal to 0.2.
Measurement of DW per cell.
The DW per cell was inferred from the DW per OD600 ml and cell number per OD600 ml. The DW per OD600 ml was characterized on the basis of the method used by Erickson et al.39, and the cell number per OD600 ml was characterized using flow cytometry as described below.
Characterization of population-averaged OD600 ml per 109 cells.
When the OD600 reached approximately 0.2, samples for characterizing OD600 ml per 109 cells were taken and the OD600 was carefully measured using a spectrometer (Genesys 10s, Thermo Fisher Scientific). To prepare samples for cell counting, an aliquot (see below) of cell suspension was immediately diluted with precooled cell count buffer (0.9% NaCl with 0.12% formaldehyde, filtered using a 0.22-μm filter) and kept in an ice-water bath. The volume of cell suspension and cell count buffer was predetermined empirically on the basis of the growth medium used. To get the most reliable cell counts, the cell concentration after this step should be within the range from 5 × 10⁶ ml−1 to 2 × 10⁷ ml−1. Cell counting was performed using a flow cytometer equipped with 405 nm laser (CytoFLEX (S), Beckman Coulter Life Sciences). One aspect of this instrument that is essential for the current study was the ability to control the flow rate precisely. To 900 μl of stain buffer (0.9% NaCl with 1 μg ml−1 DAPI, filtered using 0.22-μm filter), a 100 μl sample was added. The sample was then incubated in an ice water bath for 3 min. The flow rate and running time were 1 μl s−1 and 100 s, respectively. The trigger channel was set on SSC-H, the gain for FSC, SSC and DAPI channels was set to 500, 500 and 2,000, respectively. The DAPI-stained particles were deemed to be the bacterial cells (Supplementary Fig. 1a–c). The OD600 ml per 109 cells was then calculated by dividing the OD600 by the corresponding cell-number concentration. Two different flow cytometry instruments, CytoFLEX or CytoFLEX S, were used in this study, and we confirmed that the calculated population-averaged OD600 ml per 109 cells was not related to the specific instrument applied.
Characterization of the population-averaged cell volume.
The population-averaged cell volume was characterized on the basis of microscopy images as previously described6. In brief, when the OD600 of a steady-state culture reached approximately 0.2, 10 μl of the culture was immobilized using a 15 × 15 mm agarose pad (1% agarose prepared with 0.9% NaCl) and covered with a coverslip. Immobilized cells were imaged using a Nikon Ti-E microscope equipped with a ×100/1.45 NA phase-contrast objective and an Andor Zyla 4.2s camera. The images were acquired within 5 min at room temperature after immobilization. MicrobeTracker, a customized MATLAB-based (MathWorks) image-processing package was used to process the images. One pixel on the image equalled 0.065 μm, which was validated using a graticule. Approximately 1,000 cells were analysed to get the population-averaged cell volume. The exact number of cells analysed for each growth condition is provided in Extended Data Fig. 8.
Characterization of the relative FSC of the cells.
The FSC-A of the cells was extracted from the experiments while characterizing the population-averaged OD600 ml per 109 cells. The FSC-A for cells grown in different growth media was normalized to the FSC-A for cells grown in M18. Only FSC-A obtained using the same instrument were used in Fig. 1c and Extended Data Fig. 3c. We experienced difficulties in making effective comparisons between the FSC-A obtained using different instruments, even when using identical parameter settings.
RNA and protein per cell measurement.
The RNA and protein per cell were inferred from the RNA per OD600 ml, protein per OD600 ml and cell number per OD600 ml. The RNA per OD600 ml and protein per OD600 ml were characterized on the basis of the method used by You et al.3, and the cell number per OD600 ml was characterized using flow cytometry as described above. By comparing with the DW per cell, we found that RNA and protein account for around 80% of the total dry mass in all conditions, and the deviation from SMK growth law was also evidenced by plotting the combined mass of RNA and protein per cell against the growth rate (Supplementary Fig. 2).
Characterizing the population-averaged cellular origin number , λ(C + D) and the sum of the C and D periods.
Replication run-out experiments were conducted to quantify as previously described6,20 with modifications. In brief, rifamycin and cephalexin were added into the cell suspension with final concentrations of 300 μg ml−1 and 30 μg ml−1, respectively, and cells were allowed to grow for 2–3 mass-doubling times to finish ongoing replication. To cell suspensions (300 μl) after run-out experiments, 700 μl precooled absolute ethanol was added by drops with continuous mixing. The fixed sample could be applied for further flow cytometry characterization after incubating for 30 min at 4 °C, or stored at 4 °C for at least 24 h without affecting the results. To the 20 μl fixed samples, 480 μl stain buffer (20 mM Tris-HCl, pH 8.0, 130 mM NaCl, 0.1% Triton X-100, 10 ng ml−1 DAPI) was added directly, mixed well using a vortex and kept at room temperature for 3 min. Flow cytometry analysis was performed using a CytoFLEX (S) system equipped with a 405-nm laser. The trigger channel was set on DAPI, and the gains for the FSC, SSC and DAPI channels were set to 500, 500 and 2,000 respectively. was calculated on the basis of the distribution of the DAPI signalling of the run-out experiments (Supplementary Fig. 1d–h). Two different flow cytometry instruments, CytoFLEX and CytoFLEX S, were used in this study, and we confirmed that the calculated was not related to the specific instrument applied. λ(C + D) and the sum of the C and D periods were evaluated from using the formulae and , respectively.
Characterization of the λC and C period.
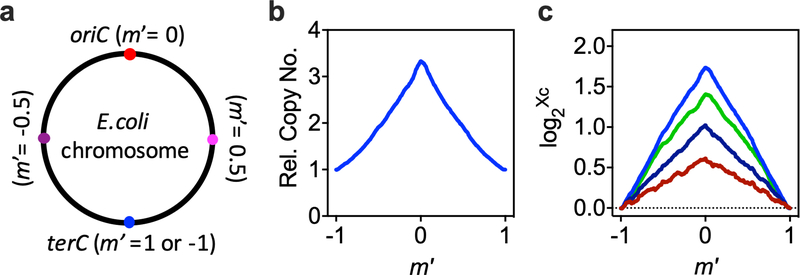
Theoretical analysis has revealed that, for a population of cells undergoing steady-state growth, the ratio of the frequencies of different genes depends on the C period, the location on the chromosome (m′; Extended Data Fig. 6) and the mass doubling time (τ)19. The gene-frequency ratio between oriC and terC has therefore been widely used to quantify the C period. In a previous study6, we developed a quantitative-PCR-based method to more precisely characterize the C period by taking more chromosomal sites into consideration. Here, further improvements were made by taking the whole chromosome into consideration using deep sequencing. Total DNA of steady-state culture was extracted using the genomic DNA purification kit (Tiangen) according to the manufacturer’s protocol, with three DNA samples extracted from run-out cells as control experiments. DNA samples were sent to BGI for deep sequencing using an Illumina HiSeq 2000. Python packages, including Plotly, Pysam, Biopython and SKlearn, were used for deep-sequencing data analysis. Programs, such as Bowtie2 (v.2.2.9, mode ‘very sensitive local’) and Samtools (v.1.6), were used for read alignment on the basis of the genome as the reference. The genome was then separated into more than 900 segments with 5,000 bp for each fragment. The total read count per fragment was found to be strongly biased by the GC content of the fragment for some samples, ComputeGCBias and CorrectGCBias in DeepTools (v.3.3.1) were used to compute and correct for GC bias and produce corrected-read numbers for each segment after correction. To smooth the data, we used the moving-average number of 41 sequential segments as the read number for the centre segment. The m′ coordinate was defined as the relative distance from the replication origin, with the distance from oriC to terC set at ±1. We calculated the gene frequencies (Xc) for each fragment relative to that for terC. For run-out cells, Xc was approximately equal to 1.0 for all m′ (data not shown). For each experimental sample, the correlation between m′ and log2[Xc] was fit to two lines, depending on whether m′ was greater or less than 0. The λC and C period were calculated as λC = |k| × ln2, and C = |k| × τ, respectively, where k is the slope of the linear fit and τ is the mass doubling time. For each experimental sample, there were two different k values of opposite sign. We noticed that they were approximately equal in absolute value. We took the mean value of the periods based on the individual k as the C period for this experimental sample.
Shift-up experiment.
For the shift-up experimental data presented in Supplementary Fig. 7, growth conditions were shifted from M25 to M6, corresponding to a growth-rate shift from 0.43 h−1 to 1.35 h−1. These two growth media have an identical chemical composition except that M6 contains nucleotides (AUCG) and amino acids (EZ) but M25 does not. We therefore avoided unnecessary manipulation, such as centrifugation or filtration when conducting the shift, minimizing undesired perturbation on the cells other than the nutrition down-shift. Before nutrition shift-up, cells were growing in steady state in M25 as described in the culture procedure section of the Methods. When OD600 reached approximately 0.1, an aliquot of cell suspension was added to an equal volume of prewarmed 2× M6 medium, which is M6 with extra AUCG and EZ. By doing so, the growth condition for the cells was shifted from M25 to M6. The OD600 and cell-number concentration were followed before and after the shift-up. Cells were diluted by a ratio of 1:3 once the OD600 reached 0.2. By taking the dilution ratio into account, continuously varying mass and cell-number growth curves were produced.
Proteomics.
To collect a sample for proteomics, a cell suspension of 15 ml from steady-state culture at OD600 approximately 0.2 was transferred into a test tube (50 ml), treated with liquid nitrogen immediately and then kept at −80 °C. After collecting all of the samples for 16 different growth media, these samples were thawed to 0 °C, centrifuged at 4 °C (10,000g for 5 min), the supernatant was discarded and the pellet was washed once with ice-water-cooled PBS. After discarding the supernatant, the pellets were stored at −80 °C. The following procedure was performed by Jingjie PTM Biolabs. The sample was sonicated three times on ice using a high-intensity ultrasonic processor (Scientz) in lysis buffer (8 M urea, 1% Triton X-100, 10 mM dithiothreitol, 1% protease inhibitor cocktail and 2 mM EDTA). Total protein was extracted using the trichloroacetic acid method and was dissolved in urea solution (8 M). Protein concentration was quantified using the BCA kit according to the manufacturer’s instructions. For digestion, the protein solution was reduced with 5 mM dithiothreitol for 30 min at 56 °C and alkylated with 11 mM iodoacetamide for 15 min at room temperature in darkness. The protein sample was then diluted by adding 100 mM TEAB to a urea concentration of less than 2 M. Finally, trypsin was added at a mass ratio of 1:50 trypsin to protein for the first digestion overnight and a mass ratio of 1:100 trypsin to protein for a second digestion for 4 h. After trypsin digestion, peptides were desalted using a Strata X C18 SPE column (Phenomenex) and vacuum-dried. Peptides were reconstituted in 0.5 M TEAB and processed according to the manufacturer’s protocol for the tandem mass tag (TMT) labelling kit. To conduct comparisons among 18 kinds of growth conditions (with 2 additional growth conditions that are not related to this study), with 3 biological replicates for each condition, a mixed sample was prepared by mixing the all of the 54 protein samples at equal protein amounts. Protein samples were placed into six groups, with nine different protein samples and the mixed sample in each group. Different TMT tags, including 126, 127N, 127C, 128N, 128C, 129N, 129C, 130N, 130C and 131, were used to label different samples within the same group. To improve proteome coverage, the tryptic peptides were fractionated by high-pH reverse-phase HPLC using an Agilent 300Extend C18 column (5 μm particles, 4.6 mm ID, 250 mm length). In brief, peptides were first separated with a gradient of 8% to 32% acetonitrile (pH 9.0) over 60 min into 60 fractions. The peptides were then combined into 18 fractions and dried by vacuum centrifuging. One fraction of the mixed peptides was dissolved in solvent A (0.1% formic acid in 2% acetonitrile), directly loaded onto a custom-made reversed-phase analytical column (15 cm length, 75 μm ID). The gradient comprised an increase from 6% to 18% solvent B (0.1% formic acid in 90% acetonitrile) over 40 min, 18% to 28% in 12 min and climbing to 80% in 4 min and then holding at 80% for the final 4 min, all at a constant flow rate of 300 nl min−1 using an EASY-nLC 1000 UPLC system. The peptides were analysed using nano-spray-ionization source followed by tandem mass spectrometry (MS/MS) in an Orbitrap Fusion Lumos MS (Thermo) coupled online to the UPLC system. The electrospray voltage applied was 2.4 kV. The m/z scan range was 350 to 1,550 for full scan, and intact peptides were detected in the Orbitrap at a resolution of 60,000. Peptides were then selected for MS/MS using the NCE setting as 32 and the fragments were detected in the Orbitrap at a resolution of 30,000. Automatic gain control was set at 5E4. Fixed first mass was set as 100 m/z. The resulting MS/MS data were processed using the Maxquant search engine (v.1.5.2.8). Tandem mass spectra were searched against the SwissProt Escherichia coli K12 (MG1655) database (4,313 sequences) concatenated with a reverse decoy database. Trypsin/P was specified as the cleavage enzyme allowing for up to two missing cleavages. The mass tolerance for precursor ions was set at 20 ppm in the first search and 5 ppm in the main search, and the mass tolerance for fragment ions was set at 0.02 Da. Carbamidomethyl on Cys was specified as fixed modification, and oxidation on Met was specified as variable modifications. False-discovery rate was adjusted to <1% and minimum score for peptides was set to >40. To convert the proteomics data into relative protein per OD600 ml, we characterized the total protein per OD600 ml for several different growth conditions. An empirical smooth line was used to describe the growth-rate dependence of the total protein per OD600 ml and used for the conversion.
Reporting Summary.
Further information on research design is available in the Nature Research Reporting Summary linked to this article.
Data availability
The data that support the findings of this study are available from the corresponding author on reasonable request. The deep-sequencing data used to characterize the λC and C period have been deposited at NCBI BioProject with the accession code PRJNA615952. Source data for Figs. 1a–d, 2a,b, 3a,d and 4a,c and Extended Data Figs. 3b–d, 5 and 7a,b are provided with the paper.
Code availability
Simulation data can be generated using the custom-made code and the parameter sets provided. The code that was used for the simulations in this study are available at https://github.com/BaiYangBqdq/general_relations_bacterial_growth_cell_cycle.
Extended Data
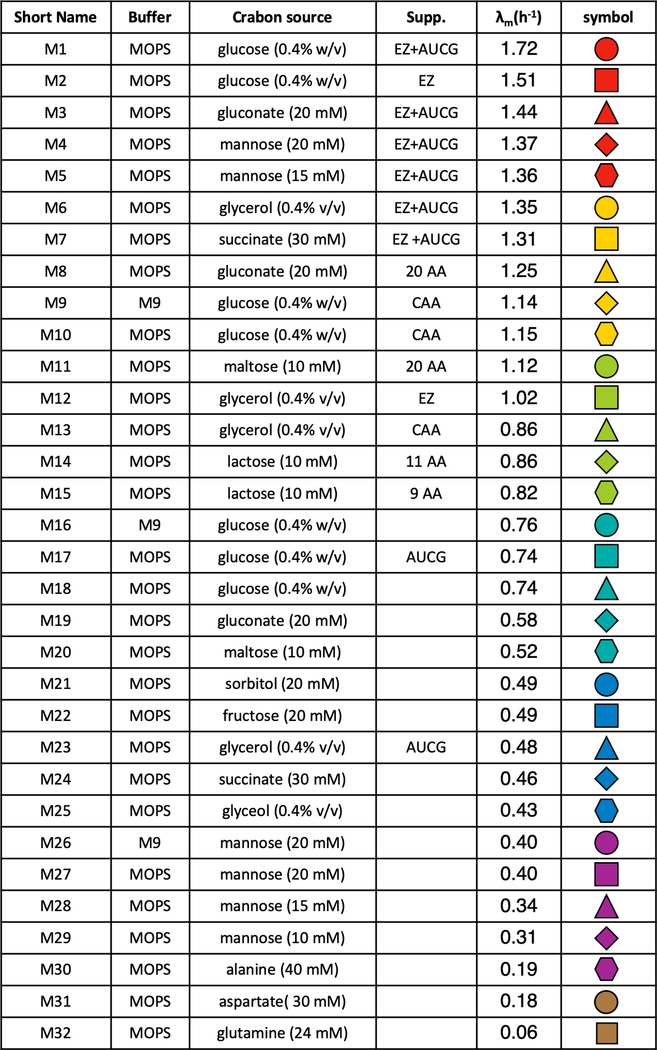
Extended Data Fig. 1 |. Composition of growth media used in the study.
The composition of the 32 growth media used in this study, detailed chemical information on the buffer and supplement (supp.) are available in Supplementary Table 1. Corresponding mass growth rate under steady-state growth status and the symbols used in figures for each growth medium are presented as well.
Extended Data Fig. 2 |. Steady-state growth is validated by monitoring mass and cell-number growth simultaneously.
A fundamental but often ignored point in bacterial physiology studies is the establishment of steady state growth15,16, where the total cell mass growth rate λm is identical to cell number growth rate λc. In an exploratory experiment on early growth of cells in medium M1 (Extended Data Fig. 1) after inoculation from seed culture, overnight cultured cells were inoculated into pre-warmed medium with starting OD600 at 0.02, then grown without further dilution. The OD600, cell number, and population-averaged cellular origin number were characterized at different time points (Methods). We found that the total cell mass growth (a) quickly entered exponential phase (the grey area, from 30 to 140 minutes), but cell number growth (b) showed a considerable lag. As a result, the average cellular mass (c) and origin number (d) varied throughout the exponential growth phase, which clearly indicated that the cells were not in true steady state. By employing serial dilutions (see Methods), we found that cells grown for more than 10 mass doublings after inoculation from seed-culture were safely in steady state. This was a key step in ensuring the validity of the findings presented in this study. Following this protocol, we show in (e) that experimental cultures in 14 representative growth media covering the entire range of growth rates examined in this study lie on the steady state line λm=λc. Representative growth curves in the steady state are shown in (f): After 10 mass doublings after inoculation from seed-culture, OD600 and the cell number concentration are plotted versus time, taking the dilution ratio into account to plot the ‘sawtooth’ behavior as a single smooth curve. The cell number (red lines) and cell mass (blue lines) growth curves formed two parallel lines in semi-log plots, indicating the steady-state growth had been achieved.
Extended Data Fig. 3 |. Tight correlation of different measures for cellular mass or size.
a, Density distributions (in Probability Density Function, PDF) for cell volume normalized by average cell size, as quantified by automated image analysis (Methods), for cells taken from the conditions described in Fig. 1d. Distributions for cells at comparable growth rates from Gray et al.18 were taken for comparison. When normalized by mean cell size, the different distributions appear very similar. b-d, The dry weight (DW) per cell (b), relative FSC (forward scatter) (c), and cell volume (d) plotted against the OD600·ml per 109 cells. All three measures are linearly correlated with the OD600·ml per 109 cells. The cell volume is expected to be a precise quantitative measure of cell size. However, data sets from different published studies5,18,40,43 show an approximately two-fold difference for the same strain or closely related stains under similar growth conditions, possibly due to the difficulty in quantifying the actual cell diameter based on microscopic images. Given the variability in the measured FSC or cell volume, and the convenience and robustness in quantifying the cell number concentration and OD600, we used the OD600·ml per 109 cells as the population-averaged cellular mass for the rest of the current study. Symbols and error bars in panels b-d (except for the y axis of panel d) represent the mean±SDs of the; many of the error bars were smaller than the size of the symbols. Symbols and error bars on y axis of panel d represent mean with 95% CI of population-averaged cell volume. Sample size and mean value for each symbol are provided in Extended Data Fig. 8.
Extended Data Fig. 4 |. Linear relation between λ(C+D) and growth rate λ.
Comparison between the data in this study and those extracted from Table 3 (a) or 4 (b) in Michelsen et al.22 c, Comparison between the data in this study and those extracted from Allman et al21. The C and D periods were characterized by resolving the DNA histogram of cells in batch culture (a, c) or continuous culture (b). d-e, The semi-log relationship between and growth rate. d, Comparison between the data in this study and those extracted from Si et al5. Their were characterized by using run-out protocol followed by Hoechst 33342 staining and microscopic image analysis5. e, Comparison between the data in this study and those extracted from Zhu et al23. Their data were derived from replication origin per genome, and genome equivalents per cell for cells in batch culture. The straight lines represent Eq. 1 (d,e) or its derived form (a-c). The relationship between C+D period and growth rate is also presented in the inset to each panel. The solid line in the inserted plots represents Eq. 1’s derivative. The error bars for the gray filled circles in panels a-e represent the mean±SDs of the data; many of the error bars were smaller than the size of the symbols. Sample size and mean value for each symbol are provided in Extended Data Fig. 8. Data points other than the gray filled circles are presented as their original value in the publications, with no further statistics applied.
Extended Data Fig. 5 |. Negative correlation of initiation mass with relative DnaA protein concentration.
Shown are the initiation mass from Fig. 3a and the corresponding relative DnaA concentrations from Fig. 3d. Symbols and error bars represent the mean±SDs of the data. Sample size and mean value for each symbol are provided in Extended Data Fig. 8.
Extended Data Fig. 6 |. Measurement of the C period by deep sequencing.
a, Definition of the relative chromosomal location (m′). To characterize the C period, the genome was binned into over 900 fragments of size 5,000bp. The relative chromosomal location for each fragment (m′) is defined by its relative location between oriC (m′ = 0) and terC (m′ = ±1). b, Dependence of relative gene copy number (Xc) on chromosome location for cells grown in M1 (Extended Data Fig. 1). The relative gene copy number was obtained by normalizing the deep sequencing counts for each fragment to the count number for the fragment containing terC (Methods). c, Linear correlation between the logarithm of the relative copy number of the fragment and m′. Representative plots of 4 biologically independent samples have been presented. Colors represent growth media: blue, green, navy, and red correspond to M1, M3, M13, and M23, respectively (Extended Data Fig. 1).
Extended Data Fig. 7 |. The Linear relation between C and C + D.
a, The logarithm of population-averaged cellular origin number, which equals to λ(C+D), is proportional to λC, which was determined by deep sequencing as described in Methods and Extended Data Fig. 6. The direct proportionality between the independently measured λ(C+D) and λC suggests that the C period is proportional to the sum of the C and D periods. b, The population-averaged cellular mass scales linearly (R2 > 0.94) with λC, a measure of average number of replication positions per chromosome, with best-fit slope OD600·ml/109 cells or 0.89 ± 0.04 pg DW/cell. Symbols and error bars represent the mean±SDs of the data. Sample size and mean value for each symbol are provided in Extended Data Fig. 8.
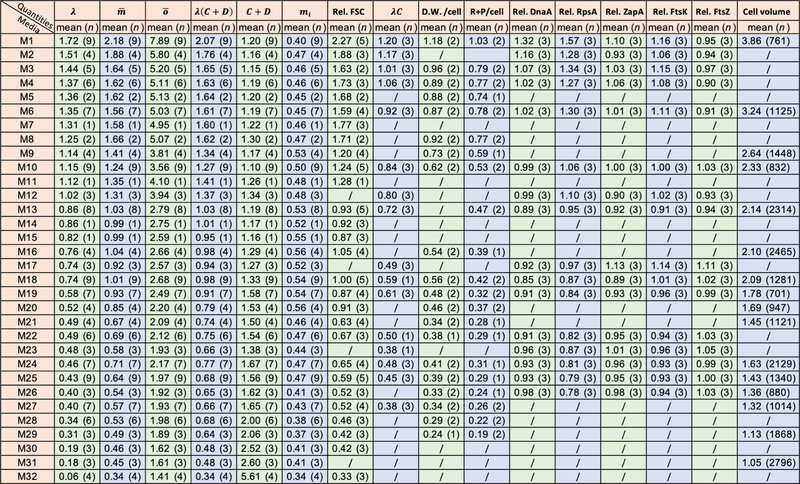
Extended Data Fig. 8 |. Sample size and mean value of the experiments in this study.
Thirty-two different kinds of growth media were used in this study. Here we summarize the number of biologically independent experiments for each quantity we characterized. Note that the growth rate (λ), population-averaged cellular mass OD600ml per 109 cells (), population-averaged cellular oriC No. (), and the derived λ(C+D), C+D, initiation mass (mi, in units of 10–9 OD600 ml) were examined simultaneously for a same experimental culture, so these parameters have the same replicate number.
Supplementary Material
Acknowledgements
We thank numerous colleagues for discussions. This research was financially supported by the National Key R&D Program of China (2018YFA0902701), the Strategic Priority Research Program (XDPB0305) and the Key Research Program (KFZD-SW-216) of the Chinese Academy of Sciences, Shenzhen Grants (JCYJ20170818164139781, KQTD2015033117210153 and Engineering Laboratory [2016]1194) to C.L., the National Natural Science Foundation of China (number 31700045) to H.Z., the National Natural Science Foundation of China (nos. 11804355 and 31770111), the Guangdong Nature Science Foundation (2018A030310010) and Shenzhen Grants (JCYJ20170413153329565 and KQTD2016112915000294) to Y.B, the National Key R&D Program of China (2018YFA0903400) to X.F., grant no. NIH R01 GM025326 to N.K. and grant no. NIH R01 GM095903 to T.H.
Footnotes
Competing interests
The authors declare no competing interests.
Additional information
Extended data is available for this paper at https://doi.org/10.1038/s41564-020-0717-x.
Supplementary information is available for this paper at https://doi.org/10.1038/s41564-020-0717-x.
Reprints and permissions information is available at www.nature.com/reprints.
Publisher’s note Springer Nature remains neutral with regard to jurisdictional claims in published maps and institutional affiliations.
References
- 1.Schaechter M, Maaloe O & Kjeldgaard NO Dependency on medium and temperature of cell size and chemical composition during balanced grown of Salmonella typhimurium. J. Gen. Microbiol 19, 592–606 (1958). [DOI] [PubMed] [Google Scholar]
- 2.Scott M, Gunderson CW, Mateescu EM, Zhang Z & Hwa T Interdependence of cell growth and gene expression: origins and consequences. Science 330, 1099–1102 (2010). [DOI] [PubMed] [Google Scholar]
- 3.You C et al. Coordination of bacterial proteome with metabolism by cyclic AMP signalling. Nature 500, 301–306 (2013). [DOI] [PMC free article] [PubMed] [Google Scholar]
- 4.Donachie WD Relationship between cell size and time of initiation of DNA replication. Nature 219, 1077–1079 (1968). [DOI] [PubMed] [Google Scholar]
- 5.Si F et al. Invariance of initiation mass and predictability of cell size in Escherichia coli. Curr. Biol 27, 1278–1287 (2017). [DOI] [PMC free article] [PubMed] [Google Scholar]
- 6.Zheng H et al. Interrogating the Escherichia coli cell cycle by cell dimension perturbations. Proc. Natl Acad. Sci. USA 113, 15000–15005 (2016). [DOI] [PMC free article] [PubMed] [Google Scholar]
- 7.Sauls JT et al. Control of Bacillus subtilis replication initiation during physiological transitions and perturbations. mBio 10, e02205–19 (2019). [DOI] [PMC free article] [PubMed] [Google Scholar]
- 8.Lobner-Olesen A, Skarstad K, Hansen FG, von Meyenburg K & Boye E The DnaA protein determines the initiation mass of Escherichia coli K-12. Cell 57, 881–889 (1989). [DOI] [PubMed] [Google Scholar]
- 9.Churchward G, Estiva E & Bremer H Growth rate-dependent control of chromosome replication initiation in Escherichia coli. J. Bacteriol 145, 1232–1238 (1981). [DOI] [PMC free article] [PubMed] [Google Scholar]
- 10.Wold S, Skarstad K, Steen HB, Stokke T & Boye E The initiation mass for DNA replication in Escherichia coli K-12 is dependent on growth rate. EMBO J. 13, 2097–2102 (1994). [DOI] [PMC free article] [PubMed] [Google Scholar]
- 11.Kleckner NE, Chatzi K, White MA, Fisher JK & Stouf M Coordination of growth, chromosome replication/segregation, and cell division in E. coli. Front. Microbiol 9, 1469 (2018). [DOI] [PMC free article] [PubMed] [Google Scholar]
- 12.Micali G, Grilli J, Marchi J, Osella M & Cosentino Lagomarsino M Dissecting the control mechanisms for DNA replication and cell division in E. coli. Cell Rep. 25, 761–771 (2018). [DOI] [PubMed] [Google Scholar]
- 13.Micali G, Grilli J, Osella M & Cosentino Lagomarsino M Concurrent processes set E. coli cell division. Sci. Adv 4, eaau3324 (2018). [DOI] [PMC free article] [PubMed] [Google Scholar]
- 14.Jun S, Si F, Pugatch R & Scott M Fundamental principles in bacterial physiology—history, recent progress, and the future with focus on cell size control: a review. Rep. Prog. Phys 81, 056601 (2018). [DOI] [PMC free article] [PubMed] [Google Scholar]
- 15.Fishov I, Zaritsky A & Grover NB On microbial states of growth. Mol. Microbiol 15, 789–794 (1995). [DOI] [PubMed] [Google Scholar]
- 16.Neidhardt FC Bacterial growth: constant obsession with dN/dt. J. Bacteriol 181, 7405–7408 (1999). [DOI] [PMC free article] [PubMed] [Google Scholar]
- 17.Cooper S & Helmstetter CE Chromosome replication and the division cycle of Escherichia coli B/r. J. Mol. Biol 31, 519–540 (1968). [DOI] [PubMed] [Google Scholar]
- 18.Gray WT et al. Nucleoid size scaling and intracellular organization of translation across bacteria. Cell 177, 1632–1648 (2019). [DOI] [PMC free article] [PubMed] [Google Scholar]
- 19.Bremer H & Churchward G An examination of the Cooper-Helmstetter theory of DNA replication in bacteria and its underlying assumptions. J. Theor. Biol 69, 645–654 (1977). [DOI] [PubMed] [Google Scholar]
- 20.Skarstad K, Boye E & Steen HB Timing of initiation of chromosome replication in individual Escherichia coli cells. EMBO J. 5, 1711–1717 (1986). [DOI] [PMC free article] [PubMed] [Google Scholar]
- 21.Allman R, Schjerven T & Boye E Cell cycle parameters of Escherichia coli K-12. J. Bacteriol 173, 7970–7974 (1991). [DOI] [PMC free article] [PubMed] [Google Scholar]
- 22.Michelsen O, Teixeira de Mattos MJ, Jensen PR & Hansen FG Precise determinations of C and D periods by flow cytometry in Escherichia coli K-12 and B/r. Microbiology 149, 1001–1010 (2003). [DOI] [PubMed] [Google Scholar]
- 23.Zhu M et al. Manipulating the bacterial cell cycle and cell size by titrating the expression of ribonucleotide reductase. mBio 8, e01741–17 (2017). [DOI] [PMC free article] [PubMed] [Google Scholar]
- 24.Wallden M, Fange D, Lundius EG, Baltekin O & Elf J The synchronization of replication and division cycles in individual E. coli cells. Cell 166, 729–739 (2016). [DOI] [PubMed] [Google Scholar]
- 25.Ho PY & Amir A Simultaneous regulation of cell size and chromosome replication in bacteria. Front. Microbiol 6, 662 (2015). [DOI] [PMC free article] [PubMed] [Google Scholar]
- 26.Helmstetter CE Initiation of chromosome replication in Escherichia coli. II. Analysis of the control mechanism. J. Mol. Biol 84, 21–36 (1974). [DOI] [PubMed] [Google Scholar]
- 27.Zaritsky A & Zabrovitz S DNA synthesis in Escherichia coli during a nutritional shift-up. Mol. Gen. Genet 181, 564–566 (1981). [DOI] [PubMed] [Google Scholar]
- 28.Bates D & Kleckner N Chromosome and replisome dynamics in E. coli: loss of sister cohesion triggers global chromosome movement and mediates chromosome segregation. Cell 121, 899–911 (2005). [DOI] [PMC free article] [PubMed] [Google Scholar]
- 29.Bremer H, Churchward G & Young R Relation between growth and replication in bacteria. J. Theor. Biol 81, 533–545 (1979). [DOI] [PubMed] [Google Scholar]
- 30.Helmstetter C, Cooper S, Pierucci O & Revelas E On the bacterial life sequence. Cold Spring Harb. Symp. Quant. Biol 33, 809–822 (1968). [DOI] [PubMed] [Google Scholar]
- 31.Ghusinga KR, Vargas-Garcia CA & Singh A A mechanistic stochastic framework for regulating bacterial cell division. Sci. Rep 6, 30229 (2016). [DOI] [PMC free article] [PubMed] [Google Scholar]
- 32.Si F et al. Mechanistic origin of cell-size control and homeostasis in bacteria. Curr. Biol 29, 1760–1770 (2019). [DOI] [PMC free article] [PubMed] [Google Scholar]
- 33.Bi EF & Lutkenhaus J FtsZ ring structure associated with division in Escherichia coli. Nature 354, 161–164 (1991). [DOI] [PubMed] [Google Scholar]
- 34.Wu LJ & Errington J Nucleoid occlusion and bacterial cell division. Nat. Rev. Microbiol 10, 8–12 (2011). [DOI] [PubMed] [Google Scholar]
- 35.Adams DW & Errington J Bacterial cell division: assembly, maintenance and disassembly of the Z ring. Nat. Rev. Microbiol 7, 642–653 (2009). [DOI] [PubMed] [Google Scholar]
- 36.Donachie WD Co-ordinate regulation of the Escherichia coli cell cycle or the cloud of unknowing. Mol. Microbiol 40, 779–785 (2001). [DOI] [PubMed] [Google Scholar]
- 37.Donachie WD & Blakely GW Coupling the initiation of chromosome replication to cell size in Escherichia coli. Curr. Opin. Microbiol 6, 146–150 (2003). [DOI] [PubMed] [Google Scholar]
- 38.Harris LK & Theriot JA Relative rates of surface and volume synthesis set bacterial cell size. Cell 165, 1479–1492 (2016). [DOI] [PMC free article] [PubMed] [Google Scholar]
- 39.Erickson DW et al. A global resource allocation strategy governs growth transition kinetics of Escherichia coli. Nature 551, 119–123 (2017). [DOI] [PMC free article] [PubMed] [Google Scholar]
- 40.Basan M et al. Inflating bacterial cells by increased protein synthesis. Mol. Syst. Biol. 11, 836 (2015). [DOI] [PMC free article] [PubMed] [Google Scholar]
- 41.Paintdakhi A et al. Oufti: an integrated software package for high-accuracy, high-throughput quantitative microscopy analysis. Mol. Microbiol 99, 767–777 (2016). [DOI] [PMC free article] [PubMed] [Google Scholar]
- 42.Sliusarenko O, Heinritz J, Emonet T & Jacobs-Wagner C High-throughput, subpixel precision analysis of bacterial morphogenesis and intracellular spatio-temporal dynamics. Mol. Microbiol 80, 612–627 (2011). [DOI] [PMC free article] [PubMed] [Google Scholar]
- 43.Taheri-Araghi S et al. Cell-size control and homeostasis in bacteria. Curr. Biol 25, 385–391 (2015). [DOI] [PMC free article] [PubMed] [Google Scholar]
Associated Data
This section collects any data citations, data availability statements, or supplementary materials included in this article.
Supplementary Materials
Data Availability Statement
The data that support the findings of this study are available from the corresponding author on reasonable request. The deep-sequencing data used to characterize the λC and C period have been deposited at NCBI BioProject with the accession code PRJNA615952. Source data for Figs. 1a–d, 2a,b, 3a,d and 4a,c and Extended Data Figs. 3b–d, 5 and 7a,b are provided with the paper.


