

Abstract
Both anthropogenic impacts and historical climate change could contribute to population decline and species extinction, but their relative importance is still unclear. Emerging approaches based on genomic, climatic and anthropogenic data provide a promising analytical framework to address this question. This study applied such an integrative approach to examine potential drivers for the endangerment of the green peafowl (Pavo muticus). Several demographic reconstructions based on population genomes congruently retrieved a drastic population declination since the mid-Holocene. Furthermore, a comparison between historical and modern genomes suggested genetic diversity decrease during the last 50 years. However, climate-based ecological niche models predicted stationary general range during these periods and imply the little impact of climate change. Further analyses suggested that human disturbance intensities were negatively correlated with the green peafowl's effective population sizes and significantly associated with its survival status (extirpation or persistence). Archaeological and historical records corroborate the critical role of humans, leaving the footprint of low genomic diversity and high inbreeding in the survival populations. This study sheds light on the potential deep-time effects of human disturbance on species endangerment and offers a multi-evidential approach in examining underlying forces for population declines.
Keywords: de novo genome assembly, population genomics, species crisis, demographic trajectory, ecological niche modelling, human disturbance
1. Introduction
Accelerated loss of biodiversity threatens ecosystem services and human wellbeing, and has become one of the most pressing global issues [1,2]. Intensified anthropogenic disturbance, including habitat disturbance and overexploitation, are believed to act as immediate causes of population extirpation and species extinction [2,3]. Nevertheless, dramatic climate changes since the last glacial period (112–12 thousand years ago, Ka; LGP) might have severely reduced effective population sizes (Nes) and drive the vulnerability of species to modern anthropogenic threats [4]. This raises a fundamental question for conservation: is anthropogenic disturbance or drastic historical climatic change the major driver for population declines? The lack of such knowledge would hamper the process of reverting the decline in threatened species and saving them from the brink of extinction [5].
As a promising approach, combined analysis that ‘cross-examines' genomic, climatic and anthropogenic data has been employed to understand the process of species crisis (e.g. [6–8]). Nevertheless, the popular pairwise sequentially Markovian coalescent (PSMC) method relies on information about recombination events from a single diploid individual and has poor power in informing effects of human disturbance emerging in the Holocene (e.g. from 11.7 Ka until the present day) [9]. Its extensions, such as the multiple sequentially Markovian coalescent (MSMC) [10] and the demographic inference using composite approximate likelihood (diCal) [11], extend to sample several individuals (e.g. ≤10) and typically require haplotype genomes; potential switch errors, however, might greatly distort their estimates on demography [12]. Recent advances in population genomics prompt improved techniques to analyse a large number of unphased genomes and present high resolution in population size histories of the recent past (e.g. close to 100 years before present). While these approaches employ various algorithms and explore different genomic features (see details in the electronic supplementary material, table S1), they independently respond to unmodelled complexities of underlying demography. Therefore, combining multiple of demographic approaches could improve analytic robustness by providing intercomparison [13]. Furthermore, the very recent population histories (e.g. in the last 100 years), a challenge for coalescent simulations, could be directly characterized by genetic diversity comparison between modern samples and historical specimens in museum collections [8]. In addition, the development of ecological niche models (ENMs) [14] and historical land use models (e.g. [15]) makes it possible to directly qualify potential effects of climatic change and human disturbance. These advances provide a unique opportunity to examine the relative importance of human and climates in species vulnerability [13]. Under such a framework, we predict that if anthropogenic factors played a predominant role in population declination, the recent Ne decrease estimated by population genomic data would be more drastic than the predicted range dynamics under climates and would be negatively correlated with human disturbance; alternatively, a climate-related explanation is more likely given a dominant LGP population declination and consistent trajectories of Holocene demography and predicted range dynamics under climate change. Here, we used such an analytical framework to examine the threats contributing to the endangerment of the green peafowl (Pavo muticus, Phasianidae, Galliformes), an elegant pheasant in East and Southeast Asia.
The green peafowl is one of the most striking pheasants, with long and magnificent train feathers [16]. It was once widely and commonly distributed over subtropical and tropical forests in East and Southeast Asia, and far north to the modern northern limit of the Oriental Region around 5 Ka (figure 1) [17,18]. However, this bird experienced population extirpation in southern China [18,19] and is undergoing a rapid population decline in southwest China and Southeast Asia, where now only small populations can be found in scattered ranges [16]. Given its declining trend, this species has been categorized as globally Endangered by the International Union for Conservation of Nature (IUCN) Red List and listed in Appendix II of the Convention on International Trade in Endangered Species (CITES). Although sporadic historical records [18,19] and modern surveys [20] suggested human disturbance on the green peafowl, it is unclear whether climatic dynamics since the LGP contributed to its historical population declination and extirpation.
Figure 1.

(a) Sampling localities and distribution of the green peafowl. Closed curves indicate distribution ranges obtained from BirdLife International (2018), with a green peafowl's photograph by Xiaosong Zhuang (b). (Online version in colour.)
In this study, we synthesized multiple lines of genomic, climatic and anthropogenic evidence to disentangle the effects of human interventions and palaeoclimatic dynamics on the endangered status of the green peafowl. First, we reconstructed its historical Ne trajectory with genome-wide genetic variations by de novo assembling a draft genome and resequencing 31 modern samples. In addition, we resequenced six museum specimens and compared their genomic diversities with modern ones to summarize population dynamics of the very recent past (e.g. the last 50 years). Then, we constructed climate-based ENMs to examine potential climatic constraints at four time points—the last interglacial period (LIG, approx. 132–112 Ka), the last glacial maximum (LGM, approx. 26–19 Ka), the mid-Holocene (MH, approx. 7–5 Ka) and the present day (AD 1960–1990). We finally characterized human disturbance within the green peafowl's ranges through the Holocene and statistically measured their correlations with this bird's Ne values and distributions. We further discussed potential human impacts in combination with multiple lines of evidence from archaeology, written records and recent documented threats. Although the present study is focusing on a case species, our approach can easily be extended to other species and to facilitate our understanding of the potential causes of population declines.
2. Material and methods
(a). Genome assembly and annotation
Muscle tissue was collected from a relict wing of a female green peafowl poached in southwest China (figure 1). We avoided using captive individuals to guarantee a non-hybrid for sequencing given widespread hybridization between the green and Indian peafowl (P. cristatus) in captivity. We extracted total genomic DNA using the SQ Tissue DNA Kit (D603201, OMEGA, Norcross, GA, USA) following the manufacturer's protocol and prepared and sequenced three libraries (one paired-end and two mate-pair ones) with detailed protocols in the electronic supplementary material, Materials and Methods.
Raw sequences were assembled into scaffolds using ALLPATHS-LG v. 52488 [21] with the default parameters. This primary assembly was further polished by three rounds of gap filling and scaffold elongation using a combination of SOAP GapCloser v. 1.12 [22] and SSPACE v. 3.0 [23]. Subsequent operations, such as identification of potential contaminations, statistics of genome assemblage, genome structural and functional annotations were conducted according to protocols detailed methods in the electronic supplementary material, Materials and Methods. To obtain the putative chromosomal locations, all assembled scaffolds were mapped onto pseudo-chromosomes of the chicken assembly (GenBank assembly accession: GCA_000002315.5, hereafter the chicken genome) via synteny using Chromosemble in Satsuma v. 2.0 [24].
(b). Resequencing and variant calling
To comprehensively reconstruct the demographical history of the green peafowl, we resequenced 31 modern samples (with a feather or blood tissues) collected from wild origins during 2017–2018 from several geographic populations, roughly covering its extant continental distribution (figure 1; electronic supplementary material, table S2). These samples included 11 from southwest China, seven from Thailand, one from Cambodia and the remaining 12 seized by Chinese customs with a probable origin of Vietnam. We additionally resequenced six museum specimens stored in Kunming Natural History Museum of Zoology and collected from southwest China during 1956–1976 (see details in the electronic supplementary material, table S2), a period with relatively abundant green peafowls [17]. Detailed protocols for DNA extraction, library preparation, quality control for raw data, read mapping, variant calling and filtration on relatedness are noted in the electronic supplementary material, Materials and Methods. We emphasized unrelatedness among individuals in the final datasets, to reduce biases in subsequent analyses.
(c). Genetic clustering analysis
Population structure may leave genomic signatures resembling population inflation that would confound demographic inferences [25]. Hence, a pilot genetic clustering analysis was conducted based on putatively unlinked neutral SNPs using the likelihood-based Admixture v. 1.3.0 [26]. In brief, putatively neutral loci were prepared by excluding exons and their flanking sequences (10 000 bp for both directions) based on genome structural annotations as well as conserved non-coding elements and their bidirectional flanking sequences (100 bp) (see detailed protocols in the electronic supplementary material, Materials and Methods). These operations resulted in a set of 790 898 putatively unlinked and neutral SNPs. Admixture analyses were run for K (number of supposed genetic clusters) = 1 to K = 5, with ten runs for each K value and other parameters set to the default values. The best-fitting K value was determined with the lowest cross-validation (CV) error.
(d). Demographic reconstruction
Here, to characterize the historical demography of the green peafowl, a strategy of the combination of four kinds of coalescent simulations with various algorithms and distinct data exploration (see details in electronic supplementary material, table S1) was employed for intercomparison [13]. In general, the popular individual-genome-based PSMC approach has an aptitude for ancient histories but the deficiency in the recent past [9], while the other three population genome methods (SMC++ [12]; PopSizeABC [27]; Stairway Plot [28]) major in more recent demography (e.g. close to 100 years before present) and were jointly used for intercomparison (see detailed protocols in the electronic supplementary material, Materials and Methods). For all of these analyses, a mutation rate of 1.33 × 10⁻⁹ per site per year estimated for the Indian peafowl [29] and a generation time of four years [30] were assumed to scale demographic events in calendar times.
(e). Genetic diversity summary analysis
To summarize the most recent population dynamics (e.g. the last 100 years), genome-wide genetic diversity (π), as a function to Ne (that is, π = 4Neu, where u is the mutation rate per site per generation [31]), was measured between the museum and modern samples from southwest China in VCFtools [32] with a window size of 50 000 bp and a step size of 20 000 bp. Statistical significance was determined by paired-sample t-tests with a significance level of 0.95.
In addition, to assess the inbreeding level of the green peafowl, the length and number of runs of homozygosity (ROHs) were, respectively, calculated for modern and museum genomes from southwest China as well as for the collective modern genomes for the green peafowl, using PLINK [33] with the following parameters: ‘–homozyg-window-snp 50 –homozyg-snp 50 –homozyg-window-missing 3 –homozyg-kb 100 –homozyg-density 1000'. The inbreeding coefficient (FROH) was further calculated for separate individuals by dividing the sum length of ROHs by the genome length (i.e. 1.06 Gb). Higher FROH values indicate higher inbreeding levels.
(f). Ecological niche modelling
To reconstruct the green peafowl's distributional dynamics in response to historical climate changes, the present-day ENM for the green peafowl was constructed and then extrapolated to palaeoclimatic layers of the LIG, LGM and MH using the maximum entropy algorithm in Maxent 3.4.1 [34]. For occurrence data, a historical group of 35 records were collected from historical literatures [18,19], temporally ranging from approx. 2300 to 300 years ago. In addition, a modern group of 1325 raw occurrence records during AD 1828–2018 were collected from published sources (see details in the electronic supplementary material, Materials and Methods). Both historical and modern occurrence datasets were combined and then thinned at a five arc-minute resolution (i.e. at most one record per grid cell of the climatic layers) to avoid overrepresentations of areas with intensive surveys [35]. The final occurrence records for building ENMs were compiled into two datasets: the ‘historical-modern occurrences' dataset including both historical and modern data (in a total of 499 records) and the ‘modern-only occurrences' dataset including 464 modern records.
Originally, 19 gridded climatic variables were downloaded from WorldClim v. 1.4 [36] but only 11 and 9 variables were reserved for both occurrence datasets, respectively (electronic supplementary material, table S5) after carefully reducing auto-correlation (see details in the electronic supplementary material, Materials and Methods). The final Maxent runs were conducted with a 30% testing ratio and a minimum training presence logistic threshold and the other parameters set to default values. Model predictability was evaluated with both training and test plots of the areas under the receiver operating characteristic curves (AUCs). AUC levels theoretically range from 0.5 (complete randomness) to 1 (perfect discrimination), with 0.7 < AUC ≤ 0.8 for acceptable discrimination, 0.8 < AUC ≤ 0.9 for excellent discrimination and AUC ≥ 0.9 for outstanding discrimination [37].
(g). Human disturbance analysis
If human disturbance has driven the endangerment of the green peafowl, we would expect a negative correlation between green peafowl's Nes and human disturbance, as well as stronger human disturbance in historically extirpated regions than those in currently extant ones. To test these hypotheses, gridded data of human population estimates (e.g. population counts and total built-in area per grid cell, hereafter popc and uopp) and land use (e.g. total areas respectively for cropland and grazing land per grid cell, hereafter cropland and grazing) were characterized at a five arc-minute spatial resolution from the HYDE database 3.2 [15]. Variations of these four categories were extracted based on the ‘historical-modern occurrences' dataset of the green peafowl among 48 available time points, spreading from the onset of the Holocene (12 017 calendar years before AD 2017) to AD 1917. Three kinds of statistics were then performed: (i) the correlation between human disturbance intensities (respectively for the four categories of popc, uopp, cropland and grazing) and the green peafowl's Ne values (respectively for those from the three population genomic approaches); (ii) the comparison of human disturbance intensities (respectively for the four categories) in the green peafowl's historically extirpated distributions and currently survival ones; and (iii) the association between human disturbance intensities (respectively for the four categories) and the green peafowl's survival statuses (extirpation versus persistence). Statistical differences for the first and second tests were, respectively, determined using the Pearson's correlation coefficient and paired-sample t-test, while the contingency test for the last one, during which we divided the continuous anthropogenic variables into two categories bounded by the mean of the whole across time points for each group.
3. Results
(a). Genome assembly and resequencing
The first draft genome of a female green peafowl was assembled with 1.06 Gb in total genome size, comparable to that reported for the well-built chicken genome (Gallus gallus; GenBank assembly accession: GCA_000002315.5; 1.07 Gb). This draft genome had an average sequencing coverage of 42.30 ×, a scaffold N50 of 2.03 Mb (electronic supplementary material, table S3) and a high assembly completeness (97.30% of complete benchmarking universal single-copy orthologues; electronic supplementary material, table S4). The annotation resulted in 15 584 genes and 142 083 exons (electronic supplementary material, table S3). After careful calibration and filtration on relatedness and data quality of the resequenced individuals, the final modern genomic dataset included 22 unrelated individuals (six from southwest China, five from Thailand, one from Cambodia and the other ten with uncertain origins and probably from Vietnam) from de novo sequencing and resequencing and 1 139 469 autosomal biallelic SNPs averaging a coverage of 15.7 × (6.0 × –27.5 ×; electronic supplementary material, table S2), while that for the comparative genomic dataset was 1 076 595 SNPs from six modern samples and five museum specimens from southwest China. We made a special effort of higher coverages for the museum samples (63.5–73.2 ×; see details in the electronic supplementary material, table S2) to reduce potential sequencing biases from degraded DNA in them.
(b). Lack of population structure
The genetic clustering analysis was conducted based on 790 898 putatively unlinked and neutral loci from the totally 22 unrelated modern samples of the green peafowl. The results showed no signals of stratification among the sampled individuals, with the lowest CV error at K = 1 (electronic supplementary material, figure S1). Therefore, we pooled these samples in the subsequent demographic inference.
(c). Population dynamics
The PSMC analysis based on the autosomal sequences of the single de novo assembled genome showed early population decline from 800 to 210 ka, followed by a bounce to a peak Ne during early LGP (ca. 70 Ka), and a more marked decrease (seven-fold change) throughout the following part of LGP (ca. 70–10 Ka); however, the PSMC plot lack information for more recent history (figure 2a; electronic supplementary material, figure S2a).
Figure 2.
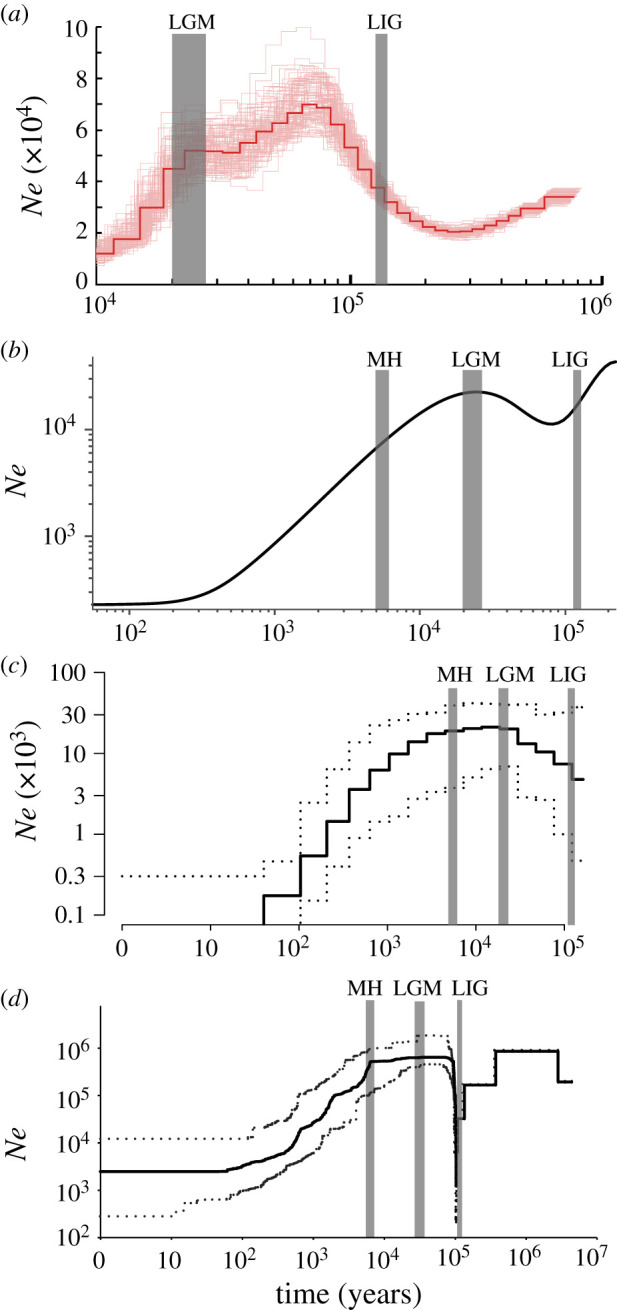
Reconstructions of population size histories for the green peafowl. (a) PSMC estimate based on the de novo assembly, with bootstrap results indicated with thin lines, and population genomic estimates from (b) SMC++, (c) PopSizeABC and (d) Stairway Plot based on 22 unrelated genomes across the last interglacial period (LIG, approx. 132–112 Ka), the last glacial maximum (LGM, approx. 26–19 Ka), the mid-Holocene (MH, 7–5 thousand years ago (Ka)) and the present day. The full line in (b) indicates the average estimated trajectory, while the dashed lines indicate the 90% credible interval. The full line in (c) indicates the median estimate while dashed lines for the 95% credible interval. An equal version aligned to the same time scales was provided as in the electronic supplementary material, figure S2. (Online version in colour.)
All three population-based demographic analyses (SMC++, PopSizeABC and Stairway Plot) congruently suggested a peak Ne for the green peafowl during the late LGP (e.g. with approx. 22 576 diploids at the LGM from the SMC++ plot), following a population expansion from around the LIG (e.g. with approx. 15 437 diploids at approx. 115 Ka from the SMC++ plot; figure 2; electronic supplementary material, figure S2). Nevertheless, the SMC++ analysis suggested population contraction from the LGM to the MH (figure 2b; electronic supplementary material, figure S2b), while results from the other two analyses (figure 2c,d; electronic supplementary material, figure S2c,d) suggested population stability during this period. In addition, all these analyses congruently revealed a drastic population decline since the MH, by over two orders of magnitude (figure 2; electronic supplementary material, figure S2), to low levels of Ne (e.g. below 250 diploids from the SMC++ plot) around 100 years ago (figure 2c,d; electronic supplementary material, figure S2c,d). In addition, all three analyses cover little signals of population trajectories within the last 100 years, with straight lines without variations, if any, during this period (figure 2c,d; electronic supplementary material, figure S2c,d).
(d). Genetic diversity summary statistics
Comparison between unrelated genomes of six modern and five museum samples from southwest China suggested a significant decrease of genetic diversity in the last 50 years (paired-sample t = 157.888, d.f. = 49 750, p = 0.000; figure 3), with an average π of 5.48 × 10⁻⁴ for the former 4.70 × 10⁻⁴ for the latter. Nevertheless, their levels of genomic inbreeding measured as FROH were significant different (independent-sample t = 0.813, d.f. = 9, p = 0.437), with an average value of 0.18 (range: 0.14–0.27) for the museum samples while 0.21 (range: 0.15–0.30) for modern samples from southwest China. For all the 22 unrelated modern green peafowl individuals, the levels of FROH were averaged at 0.17, with a range between 0.10 and 0.31 (electronic supplementary material, table S5).
Figure 3.
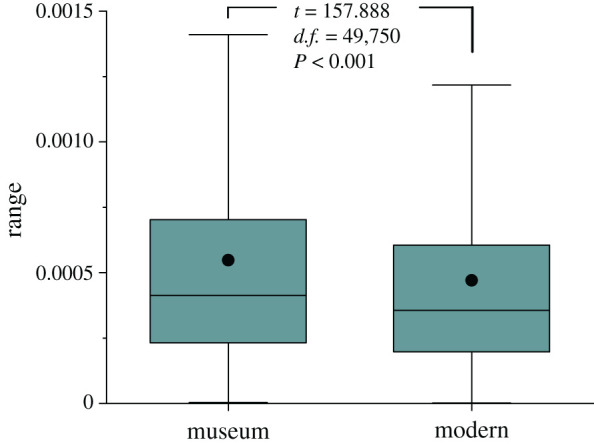
Comparison of genetic diversities between museum and modern samples. Statistically significant differences between both sets of values were determined by paired-sample t-tests with a significance level of 0.05. The boxplots comprise the 1st and 3rd quartiles (box), median (line inside the box), mean (dot) and 1.5 x interquartile range. (Online version in colour.)
(e). Range dynamics
With substantial training and test AUC values (0.836–0.885), ENMs based on ‘historical-modern occurrences' and ‘modern-only occurrences' datasets congruently predicted range expansion from the LIG to the LGM (figures 4 and 5 and electronic supplementary material, figure S3), range contraction by 36% to 52% from the LGM to the MH (figure 5) and general range stability or slight range expansion from the MH to the present day for the green peafowl (figure 5; electronic supplementary material, figure S3–6).
Figure 4.

Ecological niche models and distribution dynamics based on the ‘historical-modern occurrences' of the green peafowl. Four time points were considered, i.e. (a) the present day, (b) and (c) the mid-Holocene (MH; approx. 7–5 Ka), (d) and (e) the last glacial maximum (LGM; approx. 26–19 Ka), and (f) the last interglacial period (LIG; approx. 132–112 Ka). For MH and LGM, both general circulation models of CCSM4 and MIROC, electronic supplementary material, are considered. Areas with suitability possibilities lower than the minimum training presence logistic threshold (e.g. 0.0308) are considered unsuitable. (Online version in colour.)
Figure 5.
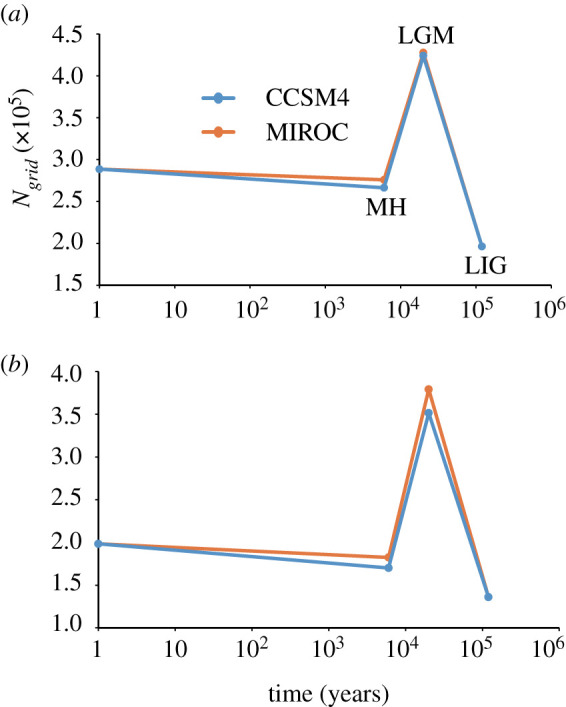
Ecological niche models and distribution dynamics based on ‘historical-modern occurrences' (a) and ‘modern occurrences' (b) (see details in the text). Four time points were considered, i.e. the present day, the mid-Holocene (MH; approx. 7–5 Ka), the last glacial maximum (LGM; approx. 26–19 Ka) and the last interglacial period (LIG; approx. 132–112 Ka). For MH and LGM, both general circulation models of CCSM4 and MIROC, electronic supplementary material, (MIROC) were considered. To avoid overprediction, the ENMs were transformed to binary (presence/absence) distributions by the minimum training presence logistic threshold. Ngrid indicates the number of grid cells at a spatial resolution of five arc-minutes. (Online version in colour.)
(f). Human disturbance
The human disturbance statistics suggested increasing population counts and intensified land use for building, cropland and grazing during the Holocene (figure 6). Intensities of these indices were negatively correlated with the green peafowl's Ne values (Pearson correlation coefficient = (−0.869)−(−0.343), n = 10–48, pPearson_Correlation less than 0.05 for all tests; see details in the electronic supplementary material, table S7), significantly associated with its currently survival statuses (extirpation or persistence; contingency coefficient = 0.707–0.720, n = 49 707 for all tests, pcontingency_coefficient<0.001 for all tests; electronic supplementary material, table S8), and consistently stronger in its extirpated regions than modern distributions throughout the Holocene (t = 5.959–13.229, d.f. = 47 for all tests, pt-test<0.001 for all test; electronic supplementary material, figure S5 and table S9).
Figure 6.
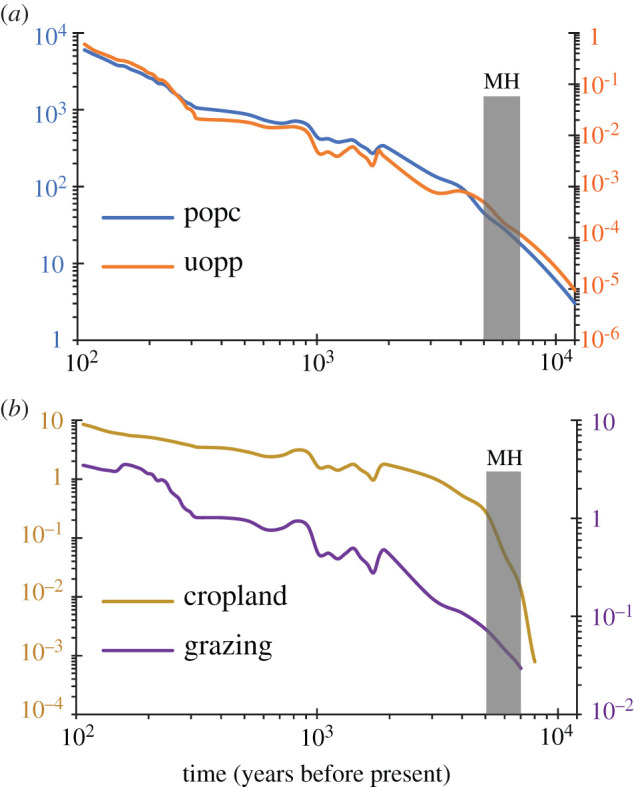
Temporal variations of human disturbance within the green peafowl's distributions. Values for four categories of human disturbance were extracted based on ‘historical-modern occurrences' (see details in the text), including (a): the popc (population counts per grid cell) and uopp (total built-up area in km2 per grid cell), and (b): cropland (total cropland area in km2 per grid cell) and grazing (total land used for grazing in km2 per grid cell). The grey-masked area indicates the mid-Holocene (MH; approx. 7–5 Ka). (Online version in colour.)
4. Discussion
In the present study, we took the endangered species—the green peafowl, as a case study to unravel potential processes under species endangerment. We assembled the first genome of this elegant bird, re-sequenced another 31 modern samples and additional six museum specimens. Based on such a comprehensive dataset, our analyses provided unprecedented details of the green peafowl's historical Ne trajectory and genetic diversity dynamics of the very recent past, which, in combination with ENMs and human disturbance statistics, facilitate our examination on whether anthropogenic or climatic factors have led to its population declination.
(a). Little genetic consequence of late Pleistocene climate change
The PSMC analysis revealed rapid population expansion followed by a dramatic population decline during the LGP (figure 2a; electronic supplementary material, figure S2a). Such a fluctuating population history broadly agrees with the PSMC-based demographic patterns of most other threatened species (e.g. [4,6,30,38,39]), plausibly suggesting a common genetic consequence of late Pleistocene climatic oscillations. However, the low resolution of PSMC's estimation towards recent population history [9] calls for cautions in interpreting the genetic legacy of past climate change that has been prevailing in genome-based demographic inferences (e.g. [4,6,30,38,39]). Thus, population genomic analyses with improved resolutions to recent population history were warranted to the endeavour.
In sharp contrast, all our three multiple-genome demographic analyses congruently suggested a relatively high level of Ne for the green peafowl during the late LGP compared with that during the preceding LIG period (figure 2b–d; electronic supplementary material, figure S2b-d). Consistently, ENM analyses predicted larger suitable habitats for the green peafowl at the LGM than at the LIG (figures 4 and 5; electronic supplementary material, figure S3). Similar positive impacts have also been uncovered in other organisms in East Asia [40]. Nevertheless, this pattern strongly contrasts with the palaeo-demographics found in most other regions. In particular, mesic-adapted organisms experienced substantial population shrinkage during glaciations and expansions during deglaciations [41]. This contrast emphasizes regional differences in the demographic effects of Pleistocene climate changes that need to be considered when deciphering the role of climates in driving biodiversity evolution at a broad geographic scale.
Past climatic fluctuations had direct effects on organisms' distributional dynamics (e.g. range contraction or shift), however, whether they also left genetic consequences (e.g. demographic decline) depends on the velocity of environmental changes [42]. For instance, slow range contractions tend to decrease the genetic diversity of populations, while instantaneous contractions might have relatively little effect [42]. In the present study, the ENM analyses predicted dramatic range contraction from the LGM to the MH (figures 4 and 5), mainly caused by land bridge submergence (e.g. the Sundaland breakup) during interglacial warming and transgression (figure 4; electronic supplementary material, figure S3). Nevertheless, these results did not necessarily indicate gradual range contractions from the LGM to the MH, given the temporally discrete nature of the available palaeoclimatic data. In fact, geological evidence suggests abrupt climatic warming [43] and fast sea-level rise across the Pleistocene–Holocene transition [44], which might have caused a rapid habitat loss in Sundaland but could have preserved high levels of genetic diversity in the remaining continental green peafowl populations. This might explain why both the PopSizeABC and Stairway Plot analyses suggested a degree of population constancy from the LGM to the MH (figure 2c,d; electronic supplementary material, figure S2c,d). Such a demographic pattern is compatible with that from the SMC++ analysis (figure 2b; electronic supplementary material, figure S2b) when considering its tendency to smooth over abrupt Ne changes [12]. These results suggest that climate-induced range change across the Pleistocene–Holocene boundary left a little signature on the green peafowl genomes.
(b). Potentially responsible drivers of human stressors
The ENM analyses congruently predicted general range stability or slight range expansion from the MH to the present day for the green peafowl (figure 5; electronic supplementary material, figure S4). However, this prediction does not agree well with the post-MH range contraction of this bird by written records in China (figure 1) [18,19]. Although range expansion might lead to complicated intraspecific structures (e.g. genetic diversity gradients and allele surfing [45]; but see [46] for an adverse scenario for birds), species-level Ne is expected to maintain constancy or increase due to novel mutation accumulations. However, all the demographic analyses based on population genomes unambiguously revealed a drastic population decline during this period, by over two orders of magnitude (figure 2; electronic supplementary material, figure S2). These discrepancies indicate the trivial role of Holocene climates in the population decline of green peafowl.
Although impacts of nonhuman biotic factors (e.g. diseases [47] and biological invasion [48]) were difficult to evaluate for lack of evidence, we argue that human stressors (e.g. human exploitation and habitat destruction) might have contributed to the post-MH range contraction and population decline of the green peafowl. Our proposition was supported by the following five findings: (i) the negative correlation between the green peafowl's historical Nes and intensity of human disturbance in the Holocene (electronic supplementary material, table S7); (ii) the significant association between the green peafowl's status (extirpation or persistence) and human disturbance (electronic supplementary material, table S8); (iii) the coherent pattern with more intensive human disturbance in its historically extirpated regions than currently survival ones throughout the Holocene (electronic supplementary material, figure S5); (iv) the written records of exploration on the green peafowl for meat and train feathers during Chinese history [18,19]; and (v) the coincidence between its southward retreat and southward expansion of humans in southern China during Chinese history [49].
The comparative analysis between the museum and modern green peafowls suggested a significant decline of genetic diversity within half a century (figure 3). This pattern is well consistent with the report of a range contraction of over half in recent decades in southwest China [50]. In addition, a range contraction of over 80% in Southeast Asia has been documented for the last 100 years [17,20,51]. Field data suggest excessive hunting and habitat destruction as the most likely threats to the extant green peafowls [17,20], probably reflecting the potentially underlying processes for its historical declination.
Taken together, multiple lines of evidence from population genomic, anthropogenic and climatic data, and historical and modern records point to a likelihood of anthropogenic effects in the population decline in the green peafowl since the MH. In fact, human forces were similarly suggested as the main driver in the rapid extinction of moas (Dinornithiformes, Aves) in New Zealand [52] and possibly in the Late Quaternary megafauna extinctions at the global scale [53].
(c). Conservation implications
The dramatic population decline would leave behind severe genetic consequences and conservation threats for green peafowl. For instance, it could enhance genetic drift and thus lead to a substantial loss of genetic diversity [54]. Indeed, the green peafowl's genomic diversity significantly decreased during the last 50 years. The effect of genetic drift can be further exaggerated by inbreeding during population reduction [55]. Accordantly, both the green peafowl's inbreeding levels estimated from the museum (range: 0.14–0.27) and modern samples (range: 0.10–0.31; electronic supplementary material, table S5) were much higher than those of non-inbred grey wolves (Canis lupus) (range: 0.01–0.09) and comparable to that of highly inbred grey wolves (range: 0.15–0.42) [56]. The increased drift and intensive inbreeding, in combination with the nature of polygamy (e.g. with males accompanied by harems of five hens) [11], might co-result in a far lower ratio (e.g. 0.017) between the green peafowl's recent Ne (e.g. below 250 individuals, figure 2b) and its consensus population size (Nc; median: 15 000 adult individuals, range: 10 000–20 000; [16]) than a theoretical value of 0.1 [57], with a similarly low value (i.e. 0.02) observed in the harp seal (Pagophilus groenlandicus) [58].
These results suggest that the green peafowl is suffering from a low level of genomic diversity and a high level of inbreeding, both of which might compromise its population health and erode its evolutionary potential to respond to environmental changes [59]. Its conservation status is especially concerning because of the intensified human disturbance that increases species extinction and biodiversity loss in Southeast Asia (e.g. [3,60]). Fortunately, this study predicted that extensive climatically suitable habitats remain in both continental Southeast Asia and Java Island for this endangered bird (figure 4; electronic supplementary material, figure S3) and suggests the possibility of population recovery through active conservation intervention (e.g. restrictions on hunting, habitat conservation and re-introductions).
5. Conclusion
Our study offers an immediately analytical framework including useful approaches and concepts in conservation genomics. Our findings, from the case study of an endangered species—the green peafowl—suggest that the popular PSMC method could not precisely characterize the species's recent demography during the LGP, for example. This highlights the strength of a multi-evidential approach based on genomic, climatic and anthropogenic data, as well as historical records to examine main drivers for species endangerment, which could be easily extended to other species and to inform drivers under the contemporary species crisis.
In line with spatial and theoretical predictions [42], our study provides an empirical case where we find little genetic consequence under rapid range contraction, e.g. under abrupt climate change during the Pleistocene–Holocene transition. This might be common across taxa distributed in regions with frequent and rapid landbridge submergence due to fast sea-level changes (e.g. the Sundaland [61]) and have implications on conservational management given a certain spatial configuration of habitats.
In addition, our analyses reveal that human stressors, rather than historical climatic change, might have played a critical role in threatening the persistence of the green peafowl. Beyond this specific observation and perhaps more fundamentally, our findings imply the long-term nature of the human role in species endangerment, agree with the hypothesis of deep-time impact of humans on the Earth's biodiversity [62,63] and challenge the recently rapid-decline paradigm of biodiversity loss [64]. All these results call for raising public awareness of the long-term genetic consequences of our human disturbance and effective policies and practices for conservation.
Supplementary Material
Acknowledgements
The authors would like to deeply thank Dr John Corder (World Pheasant Association) for kindly providing Thailand feather samples, Dr Bosco P. L. Chan (Kadoorie Farm & Botanic Garden) for the feather sample from Cambodia, Dr Niti Sukumal (King Mongkut's University of Technology Thonburi) for green peafowl occurrence records, Mr Xiaosong Zhuang for providing the green peafowl photograph and Dr Shou-Hsien Li (National Taiwan Normal University), Dr Tien-Ming Lee (Sun Yat-sen University) and two anonymous reviewers for their valuable comments and suggestions on the early manuscript.
Contributor Information
Chih-Ming Hung, Email: cmhung@gate.sinica.edu.tw.
Yang Liu, Email: liuy353@mail.sysu.edu.cn.
Xiao-Jun Yang, Email: yangxj@mail.kiz.ac.cn.
Ethics
The research protocol has been reviewed and approved by the Institutional Review Board of Kunming Institute of Zoology, Chinese Academy of Sciences (approval ID: SMKX-20180313-78).
Data accessibility
All data and scripts used in the paper are available from the Dryad Digital Repository: https://doi.org/10.5061/dryad.ffbg79ctc [65]. Genomic data have been archived in the GenBank (accession number: JACDJE000000000) and SRA databases (accession no. PRJNA644939).
Authors' contributions
F.D., X.-J.Y., Y.L. and H.-C.K. conceived the ideas; Y.L., F.W., P.-F.S. and J.W. collected samples; F.D. designed the experiments; F.D. and D.C. conducted the DNA extraction; F.D. conducted the genome assembly and annotation, SNP calling, genetic clustering and demographic reconstruction, genetic diversity and anthropogenic disturbance analyses; F.D., H.-C.K. and C.-M.H. conducted ecological niche models; G.-L.C. and Y.L. conducted the inbreeding analysis; F.D. led the writing, with substantial input from C.-M.H., Y.L. and F.-M.L., which was approved by all other authors.
Competing interests
The authors declare no competing financial interests.
Funding
This work was supported by the Strategic Priority Research Program of the Chinese Academy of Sciences (Grant No. XDA23080500), the National Natural Science Foundation of China (31872255 and 31772437) and Biodiversity Survey, Monitoring and Assessment Project of Ministry of Ecology and Environment, China (2019HB2096001006).
References
- 1.Ceballos G, Ehrlich PR, Barnosky AD, García A, Pringle RM, Palmer TM. 2015. Accelerated modern human-induced species losses: entering the sixth mass extinction. Sci. Adv. 1, e1400253. ( 10.1126/sciadv.1400253) [DOI] [PMC free article] [PubMed] [Google Scholar]
- 2.Johnson CN, Balmford A, Brook BW, Buettel JC, Galetti M, Lei GC, Wilmshurst JM. 2017. Biodiversity losses and conservation responses in the Anthropocene. Science 356, 270-275. ( 10.1126/science.aam9317) [DOI] [PubMed] [Google Scholar]
- 3.Sodhi NS, Koh LP, Brook BW, Ng PKL. 2004. Southeast Asian biodiversity: an impending disaster. Trends Ecol. Evol. 19, 654-660. ( 10.1016/j.tree.2004.09.006) [DOI] [PubMed] [Google Scholar]
- 4.Nadachowska-Brzyska K, Li C, Smeds L, Zhang GJ, Ellegre H. 2015. Temporal dynamics of avian populations during Pleistocene revealed by whole-genome sequences. Curr. Biol. 25, 1375-1380. ( 10.1016/j.cub.2015.03.047) [DOI] [PMC free article] [PubMed] [Google Scholar]
- 5.Foin TC, Riley SP, Pawley AL, Ayres DR, Carlsen TM. 1998. Improving recovery planning for threatened and endangered species. BioScience 48, 177-184. ( 10.2307/1313263) [DOI] [Google Scholar]
- 6.Hung CM, Shaner PJL, Zink RM, Lu WC, Chu TC, Huang WS, Li SH. 2014. Drastic population fluctuations explain the rapid extinction of the passenger pigeon. Proc. Natl Aacd. Sci. USA 111, 10 636-10 641. ( 10.1073/pnas.1401526111) [DOI] [PMC free article] [PubMed] [Google Scholar]
- 7.Mays H, et al. 2018. Genomic analysis of demographic history and ecological niche modeling in the endangered Sumatran rhinoceros Dicerorhinus sumatrensis. Curr. Biol. 28, 1-7. ( 10.1186/s12864-020-06957-5) [DOI] [PMC free article] [PubMed] [Google Scholar]
- 8.Feng S, et al. 2019. The genomic footprints of the fall and recovery of the crested ibis. Curr. Biol. 29, 340-349. ( 10.1016/j.cub.2018.12.008) [DOI] [PMC free article] [PubMed] [Google Scholar]
- 9.Li H, Durbin R. 2009. Fast and accurate short read alignment with Burrows-Wheeler transform. Bioinformatics 25, 1754-1760. ( 10.1093/bioinformatics/btp324) [DOI] [PMC free article] [PubMed] [Google Scholar]
- 10.Schiffels S, Durbin R. 2014. Inferring human population size and separation history from multiple genome sequences. Nat. Genet. 46, 919-925. ( 10.1038/ng.3015) [DOI] [PMC free article] [PubMed] [Google Scholar]
- 11.Sheehan S, Harris K, Song YS. 2013. Estimating variable effective population sizes from multiple genomes: a sequentially Markov conditional sampling distribution approach. Genetics 194, 647-662. ( 10.1534/genetics.112.149096) [DOI] [PMC free article] [PubMed] [Google Scholar]
- 12.Terhorst J, Kamm JA, Song YS. 2017. Robust and scalable inference of population history from hundreds of unphased whole-genomes. Nat. Genet. 49, 303-309. ( 10.1038/ng.3748) [DOI] [PMC free article] [PubMed] [Google Scholar]
- 13.Beichman AC, Huerta-Sanchez E, Lohmueller KE. 2018. Using genomic data to infer historic population dynamics of nonmondel organisms. Annu. Rev. Ecol. Evo. Syst. 49, 433-456. ( 10.1146/annurev-ecolsys-110617-062431) [DOI] [Google Scholar]
- 14.Peterson AT. 2006. Uses and requirements of ecological niche models and related distributional models. Bioinformatics 3, 59-72. ( 10.17161/bi.v3i0.29) [DOI] [Google Scholar]
- 15.Goldewijk KK, Beusen A, Doelman J, Stehfest E. 2017. Anthropogenic land use estimates for the Holocene - HYDE 3.2. Earth Syst. Sci. Data 9, 927-953. ( 10.5194/essd-9-927-2017) [DOI] [Google Scholar]
- 16.McGowan PJK, Kirwan GM. 2019. Green Peafowl (Pavo muticus). In Handbook of the birds of the world alive (eds del Hoyo J, Elliott A, Sargatal J, Christie DA, de Juana E). Barcelona, Spain: Lynx Edicions. [Google Scholar]
- 17.McGowan PJK, et al. 1998. A review of the status of the Green Peafowl Pavo muticus and recommendations for future action. Bird Conserv. Int. 8, 331-348. ( 10.1017/S0959270900002100) [DOI] [Google Scholar]
- 18.Yang L. 2013. Modern annotations on birds in compendium of materia medica. Beijing, China: Science Press. [Google Scholar]
- 19.Wen HR, He YH. 1980. Peacock in Ancient China. Fossil 3, 8-9. [Google Scholar]
- 20.Fuller AR, Garson PJ. 2000. Pheasants: status survey and conservation action plan 2000–2004. Cambridge, UK: WPA⁄BirdLife⁄SSC Pheasant Specialist Group. [Google Scholar]
- 21.Gnerrea S, et al. 2011. High-quality draft assemblies of mammalian genomes from massively parallel sequence data. Proc. Natl Aacd. Sci. USA 108, 1513-1518. ( 10.1073/pnas.1017351108) [DOI] [PMC free article] [PubMed] [Google Scholar]
- 22.Luo RB, et al. 2012. SOAPdenovo2: an empirically improved memory-efficient short-read de novo assembler. Gigascience 1, 18. ( 10.1186/s13742-015-0069-2) [DOI] [PMC free article] [PubMed] [Google Scholar]
- 23.Boetzer M, Henkel CV, Jansen HJ, Butler D, Pirovano W. 2010. Scaffolding pre-assembled contigs using SSPACE. Bioinformatics 27, 578-579. ( 10.1093/bioinformatics/btq683) [DOI] [PubMed] [Google Scholar]
- 24.Grabherr MG, Russell P, Meyer M, Mauceli E, Alföldi J, Palma FD, Lindblad-Toh K. 2010. Genome-wide synteny through highly sensitive sequence alignment: Satsuma. Bioinformatics 26, 1145-1151. ( 10.1093/bioinformatics/btq102) [DOI] [PMC free article] [PubMed] [Google Scholar]
- 25.Chikhi L, Sousa VC, Luisi P, Goossens B, Beaumont MA. 2010. The confounding effects of population structure, genetic diversity and the sampling scheme on the detection and quantification of population size changes. Genetics 186, 983-995. ( 10.1534/genetics.110.118661) [DOI] [PMC free article] [PubMed] [Google Scholar]
- 26.McQuillan R, et al. 2008. Runs of homozygosity in European populations. Am. J. Hum. Genet. 83, 359-372. [DOI] [PMC free article] [PubMed] [Google Scholar]
- 27.Boitard S, Rodríguez W, Jay F, Mona S, Austerlitz F. 2016. Inferring population size history from large samples of genome-wide molecular data- an approximate Bayesian computation approach. PLoS Genet. 12, e1005877. ( 10.1371/journal.pgen.1005877) [DOI] [PMC free article] [PubMed] [Google Scholar]
- 28.Liu XM, Fu YX. 2015. Exploring population size changes using SNP frequency spectra. Nat. Genet. 47, 555-559. ( 10.1038/ng.3254) [DOI] [PMC free article] [PubMed] [Google Scholar]
- 29.Wright AE, Harrison PW, Zimmer F, Montgomery SH, Pointer MA, Mank JE. 2015. Variation in promiscuity and sexual selection drives avian rate of Faster-Z evolution. Mol. Ecol. 24, 1218-1235. ( 10.1111/mec.13113) [DOI] [PMC free article] [PubMed] [Google Scholar]
- 30.Jaiswal SK, et al. 2018. Genome sequence of Peacock reveals the peculiar case of a glittering bird. Font. Genet. 9, 392. ( 10.1101/315457) [DOI] [PMC free article] [PubMed] [Google Scholar]
- 31.Charlesworth B. 2009. Effective population size and patterns of molecular evolution and variation. Nat. Rev. Genet. 10, 195-205. ( 10.1038/nrg2526) [DOI] [PubMed] [Google Scholar]
- 32.Danecek P, et al. 2011. The variant call format and VCFtools. Bioinformatics 27, 2156-2158. ( 10.1093/bioinformatics/btr330) [DOI] [PMC free article] [PubMed] [Google Scholar]
- 33.Purcell S, et al. 2007. PLINK: a tool set for whole-genome association and population-based linkage analyses. Am. J. Hum. Genet. 81, 559-575. ( 10.1086/519795) [DOI] [PMC free article] [PubMed] [Google Scholar]
- 34.Phillips SJ, Anderson RP, Schapire RE. 2006. Maximum entropy modeling of species geographic distributions. Ecol. Model. 190, 231-259. ( 10.1016/j.ecolmodel.2005.03.026) [DOI] [Google Scholar]
- 35.Boria RA, Olson LE, Goodman SM, Anderson RP. 2014. Spatial filtering to reduce sampling bias can improve the performance of ecological niche models. Ecol. Model. 275, 73-77. ( 10.1016/j.ecolmodel.2013.12.012) [DOI] [Google Scholar]
- 36.Hijmans RJ, Cameron SE, Parra JL, Jones PG, Jarvis A. 2005. Very high resolution interpolated climate surfaces for global land areas. Int. J. Climatol. 25, 1965-1978. ( 10.1002/joc.1276) [DOI] [Google Scholar]
- 37.Hosmer DW, Lemeshow S. 2000. Applied logistic regression edition 2. New York: NY: Wiley. [Google Scholar]
- 38.Prüfer K, et al. 2014. The complete genome sequence of a Neanderthal from the Altai Mountains. Nature 505, 43. ( 10.1038/nature12886) [DOI] [PMC free article] [PubMed] [Google Scholar]
- 39.Zhao YP, et al. 2019. Resequencing 545 ginkgo genomes across the world reveals the evolutionary history of the living fossil. Nat. Commun. 10, 1-10. ( 10.1038/s41467-019-12133-5) [DOI] [PMC free article] [PubMed] [Google Scholar]
- 40.Dong F, et al. 2017. Ice age unfrozen: severe effect of the last interglacial, not glacial, climate change on East Asian avifauna. BMC Evol. Biol. 17, 244. ( 10.1186/s12862-017-1100-2) [DOI] [PMC free article] [PubMed] [Google Scholar]
- 41.Hewitt GM. 2000. The genetic legacy of the Quaternary ice ages. Nature 405, 907-913. ( 10.1038/35016000) [DOI] [PubMed] [Google Scholar]
- 42.Arenas M, Ray N, Currat M, Excoffier L. 2012. Consequences of range contractions and range shift on molecular diversity. Mol. Biol. Evol. 29, 207-218. ( 10.1093/molbev/msr187) [DOI] [PubMed] [Google Scholar]
- 43.Severinghaus JP, Brook EJ. 1999. Abrupt climate change at the end of the last glacial period inferred from trapped air in polar ice. Science 286, 930-934. ( 10.1126/science.286.5441.930) [DOI] [PubMed] [Google Scholar]
- 44.Lambecka K, Roubya H, Purcella A, Sun YY, Sambridge M. 2014. Sea level and global ice volumes from the Last Glacial Maximum to the Holocene. Proc. Natl Aacd. Sci. USA 111, 15 296-15 303. ( 10.1073/pnas.1411762111) [DOI] [PMC free article] [PubMed] [Google Scholar]
- 45.Excoffier L, Foll M, Petit RJ. 2009. Genetic consequences of range expansions. Annu. Rev. Ecol. Evol. Syst. 40, 481-501. ( 10.1146/annurev.ecolsys.39.110707.173414) [DOI] [Google Scholar]
- 46.Song G, et al. 2013. Gene flow maintains genetic diversity and colonization potential in recently range-expanded populations of an Oriental bird, the Light-vented Bulbul (Pycnonotus sinensis, Aves: Pycnonotidae). Divers. Distrib. 19, 1248-1262. ( 10.1111/ddi.12067) [DOI] [Google Scholar]
- 47.Heard MJ, et al. 2013. The threat of disease increases as species move toward extinction. Conserv. Biol. 27, 1378-1388. ( 10.1111/cobi.12143) [DOI] [PMC free article] [PubMed] [Google Scholar]
- 48.Gurevitch J. 2004. Are invasive species a major cause of extinctions? Trends Ecol. Evol. 19, 470-474. ( 10.1016/j.tree.2004.07.005) [DOI] [PubMed] [Google Scholar]
- 49.Wen B, et al. 2004. Genetic evidence supports demic diffusion of Han culture. Nature 431, 302-305. ( 10.1038/nature02878) [DOI] [PubMed] [Google Scholar]
- 50.Kong DJ, Wu F, Shan PF, Gao JY, Yan D, Luo WX, Yang XJ. 2018. Status and distribution changes of the endangered Green Peafowl (Pavo muticus) in China over the past three decades (1990s–2017). Avian Res. 9, 18. ( 10.1186/s40657-018-0110-0) [DOI] [Google Scholar]
- 51.Sukumal N, Dowell SD, Savini T. 2020. Modelling occurrence probability of the Endangered green peafowl Pavo muticus in mainland South-east Asia: applications for landscape conservation and management. Oryx 54, 30-39. ( 10.1017/S003060531900005X) [DOI] [Google Scholar]
- 52.Holdaway N, Jacomb C. 2000. Rapid extinction of the Moas (Aves: Dinornithiformes): model, test and implications. Science 287, 2250-2254. ( 10.1126/science.287.5461.2250) [DOI] [PubMed] [Google Scholar]
- 53.Sandom C, Faurby S, Sandel B, Svenning JC. 2014. Global late Quaternary megafauna extinctions linked to humans, not climate change. Proc. R. Soc. B 281, 20133254. ( 10.1098/rspb.2013.3254) [DOI] [PMC free article] [PubMed] [Google Scholar]
- 54.Nei M, Maruyama T, Chakraborty R. 1975. The bottleneck effect and genetic variability. Evolution 29, 1-10. ( 10.2307/2407137) [DOI] [PubMed] [Google Scholar]
- 55.Lacy RC. 1997. Importance of genetic variation to the viability of mammalian populations. J. Mammal. 78, 320-335. ( 10.2307/1382885) [DOI] [Google Scholar]
- 56.Gómez-Sánchez D, et al. 2018. On the path to extinction: inbreeding and admixture in a declining grey wolf population. Mol. Ecol. 27, 3599-3612. ( 10.1111/mec.14824) [DOI] [PubMed] [Google Scholar]
- 57.Frankham R. 1995. Effective population size/adult population size ratios in wildlife: a review. Genet. Res. 66, 95-107. ( 10.1017/S0016672308009695) [DOI] [PubMed] [Google Scholar]
- 58.Peart CR, et al. 2020. Determinants of genetic variation across eco-evolutionary scales in pinnipeds. Nat. Ecol. Evol. 4, 1095-1104. ( 10.1038/s41559-020-1215-5) [DOI] [PubMed] [Google Scholar]
- 59.Keller LF, Waller DM. 2002. Inbreeding effects in wild populations. Trends Ecol. Evol. 17, 230-241. ( 10.1016/S0169-5347(02)02489-8) [DOI] [Google Scholar]
- 60.Hughes AC. 2017. Understanding the drivers of Southeast Asian biodiversity loss. Ecophere 8, e01624. ( 10.1002/ecs2.1624/abstract) [DOI] [Google Scholar]
- 61.Voris HK. 2000. Maps of Pleistocene sea levels in Southeast Asia: shorelines, river systems and time durations. J. Biogeog. 27, 1153-1167. ( 10.1046/j.1365-2699.2000.00489.x) [DOI] [Google Scholar]
- 62.ArchaeoGLOBE Project. 2019. Archaeological assessment reveals Earth's early transformation through land use. Science 365, 897-902. ( 10.1126/science.aax1192) [DOI] [PubMed] [Google Scholar]
- 63.Boivin NL, et al. 2016. Ecological consequences of human niche construction: examining long-term anthropogenic shaping of global species distributions. Proc. Natl Aacd. Sci. USA 113, 6388-6396. ( 10.1073/pnas.1525200113) [DOI] [PMC free article] [PubMed] [Google Scholar]
- 64.Li HP, et al. 2016. Large numbers of vertebrates began rapid population decline in the late 19th century. Proc. Natl Aacd. Sci. USA 113, 14 079-14 084. ( 10.1073/pnas.1616804113) [DOI] [PMC free article] [PubMed] [Google Scholar]
- 65.Dong F, et al. 2021. Data from: Population genomic, climatic and anthropogenic evidence suggest the role of human forces in endangerment of green peafowl (Pavo muticus). Dryad Digital Repository. ( 10.5061/dryad.ffbg79ctc) [DOI] [PMC free article] [PubMed]
Associated Data
This section collects any data citations, data availability statements, or supplementary materials included in this article.
Data Citations
- Dong F, et al. 2021. Data from: Population genomic, climatic and anthropogenic evidence suggest the role of human forces in endangerment of green peafowl (Pavo muticus). Dryad Digital Repository. ( 10.5061/dryad.ffbg79ctc) [DOI] [PMC free article] [PubMed]
Supplementary Materials
Data Availability Statement
All data and scripts used in the paper are available from the Dryad Digital Repository: https://doi.org/10.5061/dryad.ffbg79ctc [65]. Genomic data have been archived in the GenBank (accession number: JACDJE000000000) and SRA databases (accession no. PRJNA644939).