



Abstract
Background
The diagnosis, treatment, and prognosis of pediatric diseases rely on the accurate establishment of the reference interval (RI). This study aimed to establish pediatric RIs for liver function tests and evaluated the correlation of the analytes.
Methods
Pediatric population (aged 1–<18 years) was prospectively recruited in Jilin Province, China. Analytes detected by Ortho VITORS 5600 automatic biochemical analyzer. All strata were divided using the regression tree and Harris and Boyd's method. The dynamic changes of RI were evaluated by the lambda‐mu‐sigma method.
Results
Reference individuals were comprised of 6,322 children and adolescents. Age and sex differences were present in all analytes except serum total protein. The serum albumin, total protein, γ‐glutamyl transferase, total bilirubin, and unconjugated bilirubin levels increased with age while serum aspartate aminotransferase was opposite. The serum alanine aminotransferase level reached a trough at the age of 5 and later steadily in males but slowly decreased in females. The serum alkaline phosphatase level dropped rapidly after reaching a peak at 9 years old in females and 12 years old in males. RIs were divided into 11 partitions at most and 5 partitions at least. The strongest correlation between analytes was total bilirubin and unconjugated bilirubin (r = 0.788), followed by total bilirubin and albumin (r = 0.511).
Conclusions
Analytes show unique dynamic changes in pediatric population. The correlations among liver function tests can inform future studies of particular variables. Age‐ and sex‐special pediatric RIs should be established to help an accurate diagnosis of disease.
Keywords: adolescent, alkaline phosphatase, children, liver function, reference interval
The diagnosis, treatment, and prognosis of pediatric diseases rely on the accurate establishment of the reference interval. Age or sex differences are showed in biochemical analytes, especially in puberty. ALP presents the most complicated reference interval division and dynamic changes.

1. INTRODUCTION
The concept of the reference interval (RI) was first proposed in the 1960 s. 1 Nowadays, the EP28‐A3c document, issued by the Clinical and Laboratory Standards Institute (CLSI), interprets the RI as the interval between, and including, two reference limits. 2 Clinicians rely on reliable and appropriate RI to assess patient's health, interpret test results, analyze test information, and provide treatment evidence. As a note, its erroneous assessment will make a bad judgment on the patient's condition, delay the timing of treatment, and cause irreparable consequences. At present, many clinical laboratories adopt the RI from diagnostic test manufacturers, medical literature, or national industry standards. 3 In practice, RI is affected by the regions, ethnicities, economic conditions, living conditions, and eating habits, as well as sex, age, and nutritional status. So, the laboratory should establish RI suitable for the local population.
The liver is a large and complex organ that plays a central role in carbohydrate, protein, and fat metabolism. Liver function tests can reflect the degree of damage to human liver parenchyma, fibrosis, synthesis status, and coagulation function. 4 Besides, these analytes have a suggestive role in the early stage of hepatobiliary diseases and are commonly used in clinical health assessment. With these, clinicians can more accurately implement diagnosis, treatment, and prognosis. Currently, only adult RIs are regulated by the National Health Commission in China. 5 However, the clinical interpretation of pediatric RI is executed in the context of age‐ and sex‐specific dynamics. Children and adolescents differ greatly from adults in terms of growth, development, and eating habits, so adult RIs are no longer applicable to the pediatric population. Although there is no need to partition between adult and pediatric RIs for certain analytes, most clinical laboratory tests still need to be specifically divided by age and sex. 6 Therefore, specific RIs for children and adolescents need to be established.
Establishing pediatric RI is a precarious, costly, and time‐consuming process, as sampling from especially young children is furthermore technically difficult and associated with ethical considerations. 7 Although RI transference, proposed by CLSI, 2 affirms the possibility that laboratories can transfer previously RI elsewhere to new analytical methods or new locations, the practicality of the RI after transference is questionable due to the differences in conditions and methodologies.
The purpose of this study was to establish age‐ and sex‐specific RIs for liver function tests in children and adolescents based on the methods and guidelines proposed by the International Federation of Clinical Chemistry and Laboratory Medicine, CLSI, and the Chinese National Health Committee. 5 Healthy children and adolescents in Jilin Province were recruited as reference individuals. Statistical methods were adopted as the basis for dividing the RIs. Also, this study will evaluate the correlation between analytes.
2. MATERIALS AND METHODS
2.1. Reference population
To obtain samples from healthy children and adolescents, the recruitment of study participants, aged 1–<18 years old, carries through in randomly selected physical examination centers, schools, and community centers from August 2017 to November 2018. Reference individuals were enrolled from 5 communities, 12 schools, and 9 hospitals in 5 cities (Changchun, Jilin, Yanbian, Songyuan, and Baishan), Jilin Province, China. Since the intercept point of RI was not clear, the sample size of each sex must be greater than 120 every year of age and the reference individuals were evenly distributed for sex and age.
2.2. Exclusion criteria
Participants in this study required completion of a short questionnaire, written informed consent, and blood collection. In particular, all responses to these were voluntary. The exclusion criteria, described in detail in previous publications, 8 were as follows:
① Presence of acute or chronic diseases which require medical intervention; ② Weight and height more than 10% of the average at the same‐sex; ③ Use of medications in the past 2 weeks; ④ Surgery or donated blood in the past 4 months; ⑤ Known carrier state for hepatitis B virus, hepatitis C virus, or human immunodeficiency virus; ⑥ Serum creatinine >120 μmol/l; ⑦ Serum creatine kinase >500.0 U/l; ⑧ Serum uric acid >475.0 μmol/l; ⑨ Serum albumin <35.0 g/l; ⑩ Fasting plasma glucose >7.0 mmol/l; ⑪ C‐reactive protein >12.0 mg/l; ⑫ White blood cell count <3.0 × 10⁹/l or >12.0 × 10⁹/l; ⑬ Hemoglobin <120 g/l (male) or <110 g/l (female).
2.3. Sample collection and handling
Serum samples were collected from all participants after obtaining parental permission. Participants must maintain a normal diet and avoid strenuous exercise 3 days before blood sample collection. After overnight fasting for more than 8 h (3–6 h under 3 years old), blood was taken between 7:30 and 9:30 am by professional nurses, according to standard operating procedures. The participants were situated in the sitting position before blood sampling. Venous blood (4 ml) was collected in vacuum tubes (Vacutainer® SST, BD) by using aseptic methods and immediately left at room temperature for <30 min until clotted. All collected blood samples were centrifuged (1,200 g, 10 min) and separated within 30 min, and then stored and transported in cold chain trucks at 2–8°C (samples of Changchun must be sent to the First Hospital of Jilin University within 2 h, while samples outside Changchun were taken 8 h) until testing. Of note is that any samples with hemolysis, lipidemia, or jaundice were excluded from further analysis.
2.4. Laboratory test
Measurements of biochemical analytes were run with Ortho VITORS 5600 (Ortho‐Clinical Diagnostic), a dry versatile chemistry system, according to the manufacturer's instructions. All laboratory procedures were performed by trained laboratory staff. Reagents, calibrators, and controls were supplied by the manufacturer of the instrument. The analytical performances are presented in Table 1. The First Hospital of Jilin University was accredited by the China National Accreditation Service for Conformity Assessment as satisfying the requirements of ISO15189 in 2012.
TABLE 1.
Analytical performance of chemistry assays on the Ortho VITROS 5600 Integrated System
| Analyte | SI unit | Bias of accuracy, % | Measuring range | Precision | Accreditation criteria | ||||
|---|---|---|---|---|---|---|---|---|---|
| Low level, % | High level, % | ||||||||
| Within‐day | Between‐day | Within‐day | Between‐day | Bias | Total error | ||||
| Alb | g/l | −0.55 | 10.0–60.0 | 0.6 | 1.79 | 0.8 | 1.2 | 2.0 | 6.0 |
| TP | g/l | −0.12 | 20.0–110.0 | 1.1 | 1.66 | 1.82 | 2.13 | 2.0 | 5.0 |
| ALT | U/l | −0.8 | 6–1,000 | 4.08 | 4.24 | 1.25 | 1.67 | 6.0 | 16.0 |
| AST | U/l | 4.86 | 9.0–653 | 1.4 | 1.42 | 1.4 | 1.52 | 5 | 15 |
| GGT | U/l | 4.86 | 9.0–653 | 1.4 | 1.42 | 1.4 | 1.52 | 5 | 15 |
| ALP | U/l | 1.74 | 20–1,500 | 3.68 | 2.71 | 3.96 | 2.98 | 10.0 | 18.0 |
| TBIL | μmol/l | −1.19 | 1.7–461.7 | 2 | 2.29 | 2.41 | 3.24 | 5.0 | 15.0 |
| Bu | μmol/l | −0.91 | 0–462 | 1.89 | 1.72 | 2.24 | 3.44 | 5 | 15 |
2.5. Ethical consideration
Ethical approval for the study was given by the Ethics Committee of the First Hospital of Jilin University (No. 2016–306). Apart from this, local ethics approval was obtained at each center and each guardian gave consent before enrollment.
2.6. Statistical methods
Outlying values were identified and removed using Dixon's method. If extreme values of one or more attributes were found in one individual, all test results of that individual should be eliminated. For each analyte, the one‐sample Kolmogorov‐Smirnov method was used to test for Gaussian distribution and when appropriate, transformed skewed value by the Box‐Cox method. Age and sex partitions were determined by the regression tree algorithm and then statistically evaluated with Harris and Boyd's test to determine whether each group is sufficiently different statistically to warrant its grouping. 9 In brief, the RI can be divided only when the above conditions are met at the same time. The RIs in this study were calculated using the nonparametric rank method as per the EP28‐A3c guidelines from CLSI. 2 Moreover, the lambda‐mu‐sigma (LMS) method, which visually presented the centile values as continuous lines as a function of age, was used to describe the dynamic changes of biochemical indicators. Spearman method was used to analyze the correlation among sex, age, BMI, albumin (ALB), total protein (TP), alanine aminotransferase (ALT), aspartate aminotransferase (AST), γ‐Glutamyl transferase (GGT), alkaline phosphatase (ALP), total bilirubin (TBIL), and unconjugated bilirubin (Bu).
Statistical analysis was performed with MedCalc software (Medcalc Software Ltd, Ostend). Continuous centile curves for analyte levels over age were calculated using LMS chartmaker Light 2.54 (Medical Research Council, Cambridge). 10 All graphics were carried out by GraphPad Prism 7.0 software (GraphPad Software, San Diego).
3. RESULTS
3.1. Baseline characteristics
A total of 9,746 participants, 1–<18 years of age, were screened for enrollment into this study. Of these, 3,424 were excluded from analysis because the questionnaire surveys (3,249) or laboratory tests (175) do not meet the inclusion criteria. Out of these, 6,322 reference individuals were enrolled in the study, who finally come from 5 cities in Jilin Province. Among these participants, 49.3% (3,119/6,322) were males and the male to female ratio is 1:1.03. The flowchart is shown in Figure 1.
FIGURE 1.
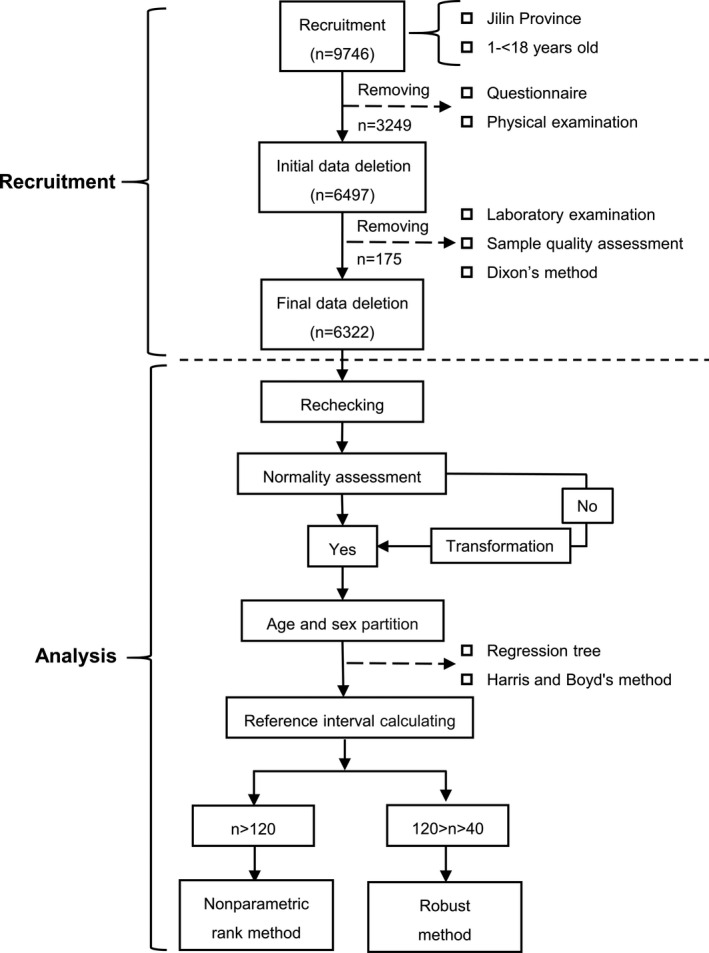
Protocol for establishment of pediatric reference intervals
3.2. RIs partition
After strict screening and normal converting, all data were Gaussian distribution. Except for serum TP, which showed only age differences, all analytes show sex and age differences. In particular, most sex differences in analytes were manifested in the senior age group and serum AST and GGT were the earliest, at the age of 10. In addition, higher values in males were observed in serum ALT, ALB, TBIL, and Bu after sex division (cutoff points were 11, 14, 15, and 15 years, respectively). Serum ALP, with a significant difference between males and females after the age of 11, showed the most complicated RI division. Based on age and sex, serum TP, ALT, GGT, TBIL, and Bu were divided into 5 partitions and serum ALB, AST, and ALP were 6, 8, and 11 partitions, respectively. The percentiles of serum ALB, TP, ALT, AST, GGT, ALP, TBIL, and Bu are presented in Table 2, and the suggested RI is shown in Figure 2.
TABLE 2.
Percentiles distribution of liver function tests
| Age (year) | Sex | n | BMI (cm/kg2) | ALB | TP | ALT | AST | GGT | ALP | TBIL | Bu | ||||||||||||||||
|---|---|---|---|---|---|---|---|---|---|---|---|---|---|---|---|---|---|---|---|---|---|---|---|---|---|---|---|
| P2.5 | P50 | P97.5 | P2.5 | P50 | P97.5 | P2.5 | P50 | P97.5 | P2.5 | P50 | P97.5 | P2.5 | P50 | P97.5 | P2.5 | P50 | P97.5 | P2.5 | P50 | P97.5 | P2.5 | P50 | P97.5 | ||||
| 1–<2 | M | 128 | 15.7 | 38.9 | 43.2 | 48.8 | 56.2 | 64.0 | 72.9 | 11.9 | 34.9 | 45.9 | 29.2 | 42.1 | 54.8 | 10.0 | 10.0 | 14.3 | 156.4 | 231.0 | 329.0 | 4.87 | 9.87 | 14.23 | 0.00 | 2.02 | 7.75 |
| F | 135 | 15.7 | 37.9 | 43.0 | 49.2 | 55.2 | 63.9 | 73.1 | 11.3 | 32.8 | 44.1 | 27.5 | 41.4 | 57.2 | 10.0 | 10.0 | 14.1 | 119.8 | 212.0 | 351.4 | 5.25 | 10.01 | 14.20 | 0.00 | 3.65 | 8.34 | |
| 2–<3 | M | 231 | 15.8 | 40.3 | 44.2 | 49.8 | 59.0 | 66.3 | 74.8 | 13.1 | 23.5 | 36.2 | 24.9 | 33.2 | 44.9 | 10.0 | 10.0 | 13.9 | 136.6 | 200.0 | 302.2 | 2.68 | 7.26 | 13.63 | 0.00 | 2.96 | 8.70 |
| F | 237 | 15.7 | 39.6 | 44.3 | 50.2 | 60.3 | 66.3 | 75.1 | 12.6 | 23.2 | 34.4 | 24.4 | 32.9 | 44.7 | 10.0 | 10.0 | 14.9 | 144.8 | 210.0 | 307.1 | 2.70 | 7.07 | 13.60 | 0.00 | 2.57 | 9.42 | |
| 3–<4 | M | 191 | 15.7 | 40.3 | 44.5 | 50.8 | 59.7 | 66.9 | 75.4 | 12.6 | 22.1 | 36.6 | 24.9 | 30.9 | 41.8 | 10.0 | 10.0 | 14.1 | 138.2 | 207.0 | 315.2 | 3.04 | 6.72 | 13.43 | 0.00 | 2.82 | 9.61 |
| F | 193 | 15.6 | 40.8 | 45.1 | 49.2 | 60.6 | 68.1 | 75.3 | 12.8 | 21.9 | 32.6 | 24.2 | 31.3 | 40.9 | 10.0 | 10.0 | 15.5 | 136.3 | 198.0 | 305.6 | 2.52 | 7.24 | 12.74 | 0.00 | 3.37 | 9.11 | |
| 4–<5 | M | 123 | 15.7 | 40.9 | 45.0 | 50.7 | 59.8 | 68.1 | 75.7 | 11.8 | 21.3 | 39.0 | 22.0 | 29.4 | 39.7 | 10.0 | 10.8 | 14.9 | 134.9 | 195.0 | 299.1 | 2.72 | 7.76 | 14.29 | 0.00 | 3.66 | 9.42 |
| F | 124 | 15.6 | 41.0 | 45.5 | 51.0 | 57.4 | 68.1 | 75.3 | 12.9 | 22.0 | 32.9 | 21.6 | 29.9 | 40.6 | 10.0 | 10.0 | 15.4 | 136.8 | 199.5 | 284.0 | 3.35 | 7.43 | 14.86 | 0.00 | 3.54 | 9.84 | |
| 5–<6 | M | 297 | 15.4 | 41.0 | 45.5 | 50.8 | 61.5 | 69.5 | 76.9 | 11.8 | 21.9 | 37.2 | 21.6 | 30.1 | 40.3 | 10.0 | 10.8 | 16.4 | 140.3 | 211.0 | 320.0 | 3.35 | 8.00 | 15.71 | 0.00 | 3.66 | 9.88 |
| F | 317 | 15.3 | 41.1 | 45.3 | 50.7 | 61.4 | 69.0 | 78.2 | 11.5 | 21.8 | 35.8 | 23.1 | 29.5 | 39.9 | 10.0 | 10.5 | 15.3 | 142.9 | 216.0 | 298.2 | 3.81 | 8.43 | 15.47 | 0.00 | 3.74 | 10.69 | |
| 6–<7 | M | 122 | 15.8 | 40.6 | 45.7 | 51.4 | 62.4 | 70.3 | 76.9 | 11.6 | 22.6 | 40.5 | 20.3 | 28.3 | 39.3 | 10.0 | 11.1 | 16.3 | 134.2 | 202.0 | 298.5 | 4.03 | 9.63 | 18.54 | 0.00 | 2.73 | 13.58 |
| F | 121 | 15.7 | 40.8 | 46.3 | 50.3 | 58.9 | 70.8 | 78.6 | 11.3 | 23.2 | 40.4 | 19.9 | 27.4 | 39.9 | 10.0 | 11.1 | 16.8 | 134.1 | 205.0 | 353.3 | 4.79 | 9.61 | 18.67 | 0.00 | 3.76 | 11.22 | |
| 7–<8 | M | 123 | 15.5 | 38.3 | 45.0 | 49.8 | 57.9 | 70.3 | 78.0 | 11.7 | 23.4 | 42.6 | 19.2 | 27.6 | 39.1 | 10.0 | 11.8 | 18.1 | 135.2 | 207.0 | 295.5 | 5.95 | 11.19 | 23.24 | 0.00 | 3.84 | 11.58 |
| F | 120 | 15.5 | 39.9 | 45.4 | 50.2 | 62.6 | 70.6 | 78.0 | 15.4 | 25.0 | 41.9 | 20.1 | 27.3 | 40.5 | 10.0 | 11.8 | 17.8 | 138.2 | 211.5 | 396.7 | 4.64 | 12.06 | 21.95 | 0.00 | 4.27 | 14.43 | |
| 8–<9 | M | 162 | 16.2 | 39.9 | 44.9 | 50.9 | 63.3 | 71.6 | 80.5 | 16.4 | 29.1 | 42.1 | 19.8 | 26.3 | 37.2 | 10.0 | 12.1 | 17.6 | 146.1 | 232.5 | 353.9 | 6.23 | 14.47 | 22.70 | 0.00 | 6.71 | 14.32 |
| F | 121 | 16.1 | 41.1 | 45.5 | 51.5 | 63.5 | 72.1 | 81.8 | 14.8 | 27.1 | 40.9 | 19.1 | 25.5 | 36.1 | 10.0 | 12.1 | 17.9 | 145.1 | 241.0 | 368.4 | 6.22 | 14.74 | 24.67 | 0.00 | 7.52 | 16.13 | |
| 9–<10 | M | 224 | 16.4 | 40.4 | 45.8 | 50.7 | 64.8 | 72.6 | 81.9 | 12.4 | 23.9 | 44.4 | 19.4 | 25.1 | 34.4 | 10.0 | 13.3 | 22.7 | 136.5 | 230.5 | 395.6 | 6.80 | 12.95 | 23.53 | 0.00 | 7.02 | 15.00 |
| F | 222 | 16.2 | 39.8 | 45.4 | 51.2 | 61.3 | 71.8 | 81.0 | 12.8 | 23.6 | 44.7 | 17.8 | 24.3 | 34.8 | 10.0 | 12.4 | 21.1 | 141.3 | 262.5 | 434.2 | 7.71 | 14.25 | 25.32 | 0.00 | 7.55 | 14.82 | |
| 10–<11 | M | 207 | 17.6 | 41.9 | 46.6 | 51.9 | 64.5 | 73.3 | 82.6 | 14.6 | 23.7 | 44.0 | 18.4 | 24.0 | 35.3 | 10.0 | 14.6 | 25.8 | 154.2 | 257.0 | 423.0 | 6.47 | 11.79 | 27.50 | 0.00 | 6.95 | 14.82 |
| F | 191 | 17.4 | 41.4 | 45.9 | 50.9 | 62.3 | 72.7 | 81.7 | 12.7 | 20.7 | 40.7 | 15.3 | 21.7 | 30.5 | 10.0 | 12.9 | 22.7 | 118.4 | 258.0 | 426.4 | 7.40 | 14.36 | 25.08 | 0.00 | 8.76 | 17.43 | |
| 11–<12 | M | 192 | 18.0 | 41.0 | 47.5 | 52.0 | 64.2 | 74.2 | 81.2 | 12.9 | 22.6 | 44.8 | 16.7 | 23.1 | 36.1 | 10.0 | 14.8 | 23.4 | 179.3 | 303.5 | 430.1 | 6.88 | 14.37 | 26.61 | 0.00 | 8.30 | 16.22 |
| F | 244 | 18.2 | 41.4 | 47.1 | 52.4 | 65.1 | 75.4 | 83.1 | 11.0 | 19.6 | 38.4 | 15.2 | 20.2 | 27.5 | 10.0 | 12.6 | 24.5 | 98.4 | 212.5 | 411.3 | 7.45 | 14.19 | 27.09 | 0.00 | 8.31 | 16.50 | |
| 12–<13 | M | 362 | 18.9 | 42.3 | 47.6 | 53.2 | 65.7 | 75.0 | 82.7 | 12.2 | 23.1 | 44.1 | 16.6 | 22.2 | 31.8 | 10.0 | 15.1 | 25.5 | 138.0 | 299.5 | 429.8 | 7.97 | 15.89 | 31.89 | 0.09 | 8.63 | 17.29 |
| F | 353 | 18.6 | 42.0 | 47.3 | 52.9 | 67.2 | 75.4 | 83.7 | 11.6 | 20.3 | 38.7 | 14.1 | 19.0 | 27.2 | 10.0 | 12.3 | 20.5 | 72.9 | 156.0 | 339.2 | 7.68 | 14.75 | 28.27 | 0.00 | 8.39 | 15.56 | |
| 13–<14 | M | 250 | 19.1 | 42.5 | 48.3 | 53.8 | 65.4 | 75.8 | 83.3 | 11.9 | 24.1 | 44.6 | 15.3 | 21.6 | 31.3 | 10.0 | 16.1 | 25.9 | 117.1 | 252.0 | 425.2 | 8.23 | 16.96 | 32.11 | 0.09 | 10.03 | 18.67 |
| F | 257 | 19.4 | 41.6 | 47.2 | 53.2 | 65.7 | 76.6 | 84.6 | 11.7 | 20.9 | 38.8 | 13.7 | 18.9 | 25.8 | 10.0 | 12.2 | 22.5 | 72.0 | 126.0 | 261.1 | 7.68 | 14.74 | 28.59 | 0.00 | 8.81 | 17.68 | |
| 14–<15 | M | 122 | 19.7 | 43.2 | 47.5 | 52.7 | 65.3 | 74.3 | 83.6 | 15.8 | 23.6 | 45.1 | 15.7 | 21.7 | 35.3 | 10.4 | 17.2 | 27.8 | 79.3 | 215.5 | 423.5 | 8.99 | 16.66 | 34.10 | 0.63 | 10.30 | 17.64 |
| F | 124 | 20.3 | 40.4 | 45.3 | 52.8 | 64.0 | 76.4 | 83.4 | 11.8 | 20.7 | 43.6 | 14.3 | 18.7 | 26.4 | 10.0 | 14.2 | 25.0 | 51.3 | 108.5 | 226.4 | 8.30 | 16.63 | 27.43 | 1.04 | 10.26 | 16.72 | |
| 15–<16 | M | 132 | 20.5 | 42.8 | 47.7 | 51.9 | 64.6 | 74.5 | 84.7 | 15.3 | 25.9 | 44.7 | 13.9 | 21.1 | 32.0 | 10.0 | 17.0 | 26.7 | 62.0 | 150.5 | 324.0 | 10.49 | 19.16 | 35.02 | 0.00 | 11.19 | 17.60 |
| F | 198 | 20.1 | 39.9 | 45.9 | 52.1 | 66.1 | 75.3 | 83.8 | 11.6 | 21.0 | 44.9 | 13.1 | 18.9 | 27.8 | 10.0 | 12.9 | 22.9 | 53.0 | 92.5 | 177.0 | 8.33 | 15.42 | 27.21 | 2.06 | 8.68 | 15.57 | |
| 16–<17 | M | 124 | 20.7 | 42.9 | 48.5 | 53.0 | 65.7 | 74.9 | 81.7 | 17.9 | 27.2 | 45.4 | 14.6 | 21.8 | 35.0 | 10.1 | 16.5 | 27.5 | 63.3 | 114.0 | 334.5 | 9.92 | 22.23 | 35.26 | 0.10 | 12.54 | 18.61 |
| F | 123 | 20.0 | 41.8 | 46.6 | 52.1 | 66.7 | 75.0 | 82.0 | 12.4 | 21.9 | 43.5 | 13.1 | 18.4 | 27.1 | 10.0 | 12.0 | 23.8 | 49.0 | 77.0 | 119.7 | 8.12 | 15.18 | 27.79 | 0.00 | 9.68 | 17.05 | |
| 17–<18 | M | 129 | 20.9 | 43.9 | 50 | 54.8 | 69.0 | 74.2 | 80.7 | 11.4 | 21.4 | 43.5 | 15.0 | 19.9 | 31.5 | 10.6 | 16.9 | 27.9 | 41.5 | 66.0 | 103.3 | 6.74 | 17.29 | 32.62 | 0.00 | 8.32 | 16.53 |
| F | 123 | 20.5 | 42.6 | 48.5 | 52.9 | 65.5 | 75.3 | 81.8 | 10.6 | 15.9 | 42.4 | 12.9 | 17.6 | 25.2 | 10.0 | 12.9 | 21.2 | 39.1 | 66.0 | 89.0 | 6.02 | 13.32 | 27.83 | 0.00 | 6.65 | 15.92 | |
FIGURE 2.

Age‐ and sex‐specific reference interval of liver function tests in the healthy pediatric population
3.3. Trend analysis
The trends of all analytes were interpreted from the P50 curves in Figure 3. Many analytes exhibited unique dynamic processes in the first few years of life. The levels of serum ALB, TP, ALT, and AST showed markedly different trends under 2 years old, compared with the next age segment. The levels of serum ALT and AST were highest at 1 year old, while serum ALB, TP, GGT, and Bu were the opposite, with the lowest concentration at 1 year old. The levels of serum TP rapidly rose and then slightly decrease after reaching a peak at the age of 13. Although reaching a trough at the age of 5, the levels of serum ALT later kept steady in males but slowly decreased in females. The levels of serum AST decreased progressively with age throughout the study. Conversely, the levels of serum GGT increased with age. The gaps in serum GGT between sex were more significant after the age of 10, while a more obvious upward trend was shown in male. The progressively upward tendency with age was also found in the levels of serum ALB, TBIL, and Bu. The trends of serum TBIL and Bu showed a strong consistency, both increased steadily before the age of 7. However, the levels of serum ALP presented great variation. Although decreasing progressively in the 1–<4 years subgroup, the levels of serum ALP later increased steadily. Subsequently, the peak reached at the age of 12 in males; however, the levels of serum ALP reached a peak at an earlier age of 9 years in females.
FIGURE 3.

Age‐ and sex‐specific continuous percentile curve of A, ALB; B, TP; C, ALT; D, AST; E, GGT; F, ALP; G, TBIL; H, Bu
3.4. Correlation analysis
All indicators were significantly associated with sex (p < 0.05), with the exception of serum TBIL and Bu (r = −0.021, p = 0.102; r = 0.013, p = 0.294). As noted, negative correlations (all p < 0.05) were presented between the age and serum AST, ALP, and ALT. In contrast, there were positive correlations between age and serum ALB, TP, GGT, TBIL, and Bu. Significant correlations were shown among BMI and each indicator, of which the most prominent was serum AST (r = −0.592, p < 0.05). Additionally, significant correlation was presented among the indicators of liver function (p < 0.05). Except for serum TBIL and Bu (r = 0.788) and serum TP and ALB (r = 0.511), the strongest correlation was shown between serum TP and TBIL (r = 0.437). The correlation among each indicator is specified in Figure 4.
FIGURE 4.

Spearman correlation heat map among 11 variables in the healthy pediatric population aged 1–<18 years. The strength of the correlation between two variables is represented by the color of the square at the intersection of those variables
4. DISCUSSION
4.1. Strengths
The establishment of pediatric RI is often restricted by sample acquisition due to ethical sample size, blood collection techniques, volume, etc. Even for the Canadian Laboratory Initiative on Pediatric Reference Intervals (CALIPER) project, it also uses leftover samples from outpatient clinics to ensure a large sample size. 11 The current study was a large population‐based study, with more than 120 persons in each subgroup. In addition, the division of RIs was performed by a special statistical procedure, which has been reported in previous research. 12 Undeniably, this study made an important contribution to the evaluation of pediatrics RIs.
4.2. Trend and partition of RI
Serum ALB and TP followed a similar trend, with concentrations increasing in the pediatric range. RIs for serum ALB were described according to sex, particularly in individuals aged over 14, and this was similar to the CALIPER study. 11 The slight decline of serum ALB in adolescent female could be attributed to net losses that occur from menstruation, and this sex difference has been confirmed to disappear after menopause. 13 , 14 For serum TP, the rising speed has been slowed down after 13 years old, then the concentration gradually stabilizes, even approaching adult levels. This is also confirmed by others. 15 , 16 Although the upper reference limits (URLs) of serum ALB and TP in this study were lower than the research on CALIPER's dry chemistry platform, the differences were smaller than the wet chemistry platform. 17 , 18 , 19 It can be considered that the system difference was one of the factors affecting RI.
Similar levels of serum ALT and AST between sex were observed in the younger age group, and those were similar to other. 20 However, higher levels of serum ALT, AST, and GGT in adolescent males were observed in the current study, and those were found in other studies. 21 , 22 In particular, the serum ALT concentrations fell continuously during early adolescence, whereas this was found in all depicted percentiles in females, the percentiles in males remained stable, even slightly increased. 23 , 24 The reason for sex differences of serum ALT, AST, and GGT during adolescence may be partly related to the changes of liver size, muscle mass, and fat‐muscle distribution with age, and the difference of sex hormones, especially during puberty. 25 , 26 , 27 In this regard, it is well known that serum concentrations of estradiol are low in preadolescent girls and increase at menarche, in contrast, after menopause, serum concentrations decline to levels below or similar to that in males. 28 The URLs of serum ALT, AST, and GGT were significantly lower than adults. Unlike our research, the CALIPER study partitioned RIs for ALT at 0–<1, 1–<13, and 13–<19 years of age, and the higher lower reference limit (LRL) was shown on the Ortho VITORS 5600 platform. 29 Comparing other studies on the wet chemistry platform, 19 , 29 LRL was not far from the current study. Even so, all the above‐mentioned studies recognized that there were differences between sex in late adolescence, which were of higher value than other periods. Given the low detection limit in the current analysis of serum GGT (10 U/l), we think the URL is more meaningful for comparison. Serum GGT was proposed in four age groups, and all URLs were higher than the CALIPER study but lower than the wet chemistry platform. 18
Serum ALP displayed variation with age and sex paralleling times of growth and was higher during rapid growth. The peak time in female (9 years old) was earlier than male (12 years old), and a higher value was observed in male. Consistent with these, Jakob Zierk et al. found that after reaching a local minimum at about 4 years of age, serum ALP showed age‐ and sex‐specific trends, and the peak time for male and female was 13–15 and 10–12 years old, respectively. 30 Likewise, such difference has also been captured by other studies. 15 , 22 Compared with our previous studies, 8 serum ALP and phosphate showed similar trends during adolescence. The earlier growth peak in females, mimicking the sex‐related delay in skeletal growth, also be found in other bone markers. 31 In fact, the main reason for the difference is probably related to sex steroids, which are critical for bone maturation and attainment and maintenance of normal bone mineral density. 27 Serum ALP showed higher values and more complicated partition of RI during childhood and adolescence, compared with adults. The sex cutoff point for serum ALP in the current study was earlier than the CALIPER study (13 years old). The same delay of peak times between sex also be reflected in Western countries. 29 , 30 Nevertheless, this has not been discovered by some Chinese researchers. 18 , 22 We deduced this difference may be caused by race, eating habits, living habits, climate, geography, and others.
The concentrations of serum TBIL were higher than the adult, and the higher median levels observed in males were found after 12 years. The TBIL trend was similar to other study. 32 Even in the same detection system 33 or the same race, 17 there were also differences in URL. For Bu, theoretically, the test results on the dry chemical system were higher than the wet chemical system. 34 This may be caused by the difference in the classification and detection principle of bilirubin components (mainly bilirubin δ). 35 Regrettably, most studies do not include unconjugated bilirubin. One of the reasons is that there are few studies detected in dry chemistry system. Besides, the unconjugated bilirubin is often calculated by formulas in the wet chemistry platform. Hence, only unilateral rather than bilateral RIs were calculated in the current study, which was different from other study. 36
4.3. Correlation
The final sex partition of RI in ALB, TBIL, and Bu do not completely match Spearman's analysis results. Although sex differences in ALB were shown by Spearman, the further analysis concluded that clinical differences were not significant, so sex groups were combined. Complex trends with age were shown in TBIL and Bu. The overall analysis between sex without considering other factors may be the main reason for the difference in Spearman. In terms of age and trend analysis, the partitions of RIs in all analytes were consistent with Spearman's result. BMI was previously confirmed as an independent predictor of elevated ALT. 25 In contrast, a lower correlation coefficient (r = −0.022) between BMI and ALT was present in the current study. Under disease conditions rather than health conditions, it may show a higher correlation coefficient. However, ALT concentration was highly correlated with AST and GGT (r = 0.300, r = 0.110, respectively), compared with other analytes. ALP concentration was weakly correlated with other analytes, except for AST (r = 0.284). All of the above trends showed certain similarities with the study of Jacob George et al 37 The strong correlation between serum TBIL and Bu (r = 0.788) and serum TP and ALB (r = 0.511) was consistent with previous views, 38 because serum TP was the composite of the ALB and globulin fractions 16 and similar explanations also apply to the relationship between TBIL and Bu.
4.4. Limitations
The limitations of this study are as follows: ① Reference individuals under 1‐year‐old were not included in the study; ② Besides age and sex, no further studies have been conducted on other factors, such as climate, season, and diet.
5. CONCLUSION
Many analytes showed age or sex differences, especially in puberty. ALP presented complex partition of RI (11 groups). The levels of serum ALB, TP, GGT, TBIL, DBIL, and Bu increased with age, while serum ALT, ALP, and ALP showed complicated trends. In this study, the dry chemical system was used to establish age and sex‐specific RIs for liver function tests. It will complement the establishment of pediatric RIs on different platforms and lay the foundation for further research. Besides, the potential correlation between liver function tests can reveal the intrinsic links and contribute to the joint diagnosis of the disease, which is worthy of further research.
CONFLICT OF INTEREST
The authors stated that there are no conflicts of interest regarding the publication of this article.
ACKNOWLEDGEMENTS
We would like to thank for all the participants and their families. This work was supported by grants from Jilin Science and Technology Development Program (Grant nos. 20170623092TC‐09, 20190304110YY, 20200404171YY) and the First Hospital Translational Funding for Scientific &Technological Achievements (Grant no. JDYYZH‐1902002).
Funding information
This work was supported by grants from Jilin Science and Technology Development Program (Grant nos. 20170623092TC‐09, 20190304110YY, 20200404171YY) and the First Hospital Translational Funding for Scientific & Technological Achievements (Grant no. JDYYZH‐1902002).
DATA AVAILABILITY STATEMENT
All data generated or analyzed during this study are included in this published article.
REFERENCES
- 1. Grasbeck R. Establishment and use of normal values. Scand J Clin Invest. 1969;110:1‐15. [Google Scholar]
- 2. CLSI . Establishing and Verifying Reference Intervals in the Clinical Laboratory; Approved Guideline‐Third Edition. CLSI document EP28‐A3c. Wayne, PA: Clinical and Laboratory Standards Institute;2008. [Google Scholar]
- 3. Rustad P, Felding P, Franzson L, et al. The Nordic reference interval project 2000: recommended reference intervals for 25 common biochemical properties. Scand J Clin Lab Invest. 2004;64(4):271‐284. [DOI] [PubMed] [Google Scholar]
- 4. Hilsted L, Rustad P, Aksglaede L, Sorensen K, Juul A. Recommended Nordic paediatric reference intervals for 21 common biochemical properties. Scand J Clin Lab Invest. 2013;73(1):1‐9. [DOI] [PubMed] [Google Scholar]
- 5. Chinese National Health Committee . Reference intervals for common clinical biochemistry tests. WS/T 404–2012. National Health Committee of the People’s Republic of China. http://www.nhc.gov.cn/wjw/s9492/wsbz_4.shtml. Accessed Mar 2, 2020.
- 6. Alnor AB, Vinholt PJ. Application of adult reference intervals in children. Eur J Pediatr. 2020;179(3):483‐491. [DOI] [PubMed] [Google Scholar]
- 7. Tahmasebi H, Higgins V, Fung AWS, Truong D, White‐Al Habeeb NMA, Adeli K. Pediatric reference intervals for biochemical markers: gaps and challenges, recent national initiatives and future perspectives. EJIFCC. 2017;28(1):43‐63. [PMC free article] [PubMed] [Google Scholar]
- 8. Zhu XT, Wang KJ, Zhou Q, Guo WJ, Jia YN, Xu JC. Age‐ and sex‐specific pediatric reference intervals of serum electrolytes in Jilin Province of China using the a priori approach. Am J Clin Pathol. 2020;154(5):708‐720. [DOI] [PMC free article] [PubMed] [Google Scholar]
- 9. Harris EK, Boyd JC. On dividing reference data into subgroups to produce separate reference ranges. Clin Chem. 1990;36(2):265‐270. [PubMed] [Google Scholar]
- 10. Cole TJ, Green PJ. Smoothing reference centile curves: the LMS method and penalized likelihood. Stat Med. 1992;11(10):1305‐1319. [DOI] [PubMed] [Google Scholar]
- 11. Colantonio DA, Kyriakopoulou L, Chan MK, et al. Closing the gaps in pediatric laboratory reference intervals: a CALIPER database of 40 biochemical markers in a healthy and multiethnic population of children. Clin Chem. 2012;58(5):854‐868. [DOI] [PubMed] [Google Scholar]
- 12. Peng XX, Lv YQ, Feng GS, et al. Algorithm on age partitioning for estimation of reference intervals using clinical laboratory database exemplified with plasma creatinine. Clin Chem Lab Med. 2018;56(9):1514‐1523. [DOI] [PubMed] [Google Scholar]
- 13. Adeli K, Higgins V, Nieuwesteeg M, et al. Biochemical marker reference values across pediatric, adult, and geriatric ages: establishment of robust pediatric and adult reference intervals on the basis of the Canadian health measures survey. Clin Chem. 2015;61(8):1049‐1062. [DOI] [PubMed] [Google Scholar]
- 14. Kim I, Yetley EA, Calvo MS. Variations in iron‐status measures during the menstrual cycle. Am J Clin Nutr. 1993;58(5):705‐709. [DOI] [PubMed] [Google Scholar]
- 15. Loh TP, Antoniou G, Baghurst P, Metz MP. Development of paediatric biochemistry centile charts as a complement to laboratory reference intervals. Pathology. 2014;46(4):336‐343. [DOI] [PubMed] [Google Scholar]
- 16. Loh TP, Metz MP. Trends and physiology of common serum biochemistries in children aged 0–18 years. Pathology. 2015;47(5):452‐461. [DOI] [PubMed] [Google Scholar]
- 17. Liu J, Dai Y, Lee Y, et al. Pediatric reference intervals of liver and renal function tests from birth to adolescence in Chinese children as performed on the Olympus AU5400. Clin Chim Acta. 2019;490:142‐146. [DOI] [PubMed] [Google Scholar]
- 18. Li X, Wang D, Yang C, et al. Establishment of age‐ and gender‐specific pediatric reference intervals for liver function tests in healthy Han children. World J Pediatr. 2018;14(2):151‐159. [DOI] [PMC free article] [PubMed] [Google Scholar]
- 19. Cho SM, Lee SG, Kim HS, Kim JH. Establishing pediatric reference intervals for 13 biochemical analytes derived from normal subjects in a pediatric endocrinology clinic in Korea. Clin Biochem. 2014;47(18):268‐271. [DOI] [PubMed] [Google Scholar]
- 20. Stirnadel‐Farrant HA, Galwey N, Bains C, Yancey C, Hunt CM. Children's liver chemistries vary with age and gender and require customized pediatric reference ranges. Regul Toxicol Pharmacol. 2015;73(1):349‐355. [DOI] [PubMed] [Google Scholar]
- 21. Dosoo DK, Asante KP, Kayan K, et al. Biochemical and hematologic parameters for children in the middle belt of Ghana. Am J Trop Med Hyg. 2014;90(4):767‐773. [DOI] [PMC free article] [PubMed] [Google Scholar]
- 22. Chang Y, Li H, Ren H, Xu H, Hu P. Misclassification of chronic hepatitis B natural history phase: insight from new ALT, AST, AKP, and GGT reference intervals in Chinese children. Clin Chim Acta. 2019;489:61‐67. [DOI] [PubMed] [Google Scholar]
- 23. Bussler S, Vogel M, Pietzner D, et al. New pediatric percentiles of liver enzyme serum levels (alanine aminotransferase, aspartate aminotransferase, gamma‐glutamyltransferase): effects of age, sex, body mass index, and pubertal stage. Hepatology. 2018;68(4):1319‐1330. [DOI] [PubMed] [Google Scholar]
- 24. Zierk J, Arzideh F, Rechenauer T, et al. Age‐ and sex‐specific dynamics in 22 hematologic and biochemical analytes from birth to adolescence. Clin Chem. 2015;61(7):964‐973. [DOI] [PubMed] [Google Scholar]
- 25. Poustchi H, George J, Esmaili S, et al. Gender differences in healthy ranges for serum alanine aminotransferase levels in adolescence. PLoS One. 2011;6(6):e21178. [DOI] [PMC free article] [PubMed] [Google Scholar]
- 26. Safak AA, Simsek E, Bahcebasi T. Sonographic assessment of the normal limits and percentile curves of liver, spleen, and kidney dimensions in healthy school‐aged children. J Ultrasound Med. 2005;24(10):1359‐1364. [DOI] [PubMed] [Google Scholar]
- 27. Loomba‐Albrecht LA, Styne DM. Effect of puberty on body composition. Curr Opin Endocrinol Diabetes Obes. 2009;16(1):10‐15. [DOI] [PubMed] [Google Scholar]
- 28. Mendelsohn ME, Karas RH. The protective effects of estrogen on the cardiovascular system. New Engl J Med. 1999;340(23):1801‐1811. [DOI] [PubMed] [Google Scholar]
- 29. Adeli K, Higgins V, Trajcevski K, White‐Al HN. The Canadian laboratory initiative on pediatric reference intervals: a CALIPER white paper. Crit Rev Clin Lab Sci. 2017;54(6):358‐413. [DOI] [PubMed] [Google Scholar]
- 30. Zierk J, Arzideh F, Haeckel R, et al. Pediatric reference intervals for alkaline phosphatase. Clin Chem Lab Med. 2017;55(1):102‐110. [DOI] [PubMed] [Google Scholar]
- 31. Gajewska J, Ambroszkiewicz J, Laskowska‐Klita T. Some bone turnover markers in serum of healthy children and adolescents in relation to age and gender. Wiad Lek. 2005;58(9–10):476‐480. [PubMed] [Google Scholar]
- 32. Chan MK, Seiden‐Long I, Aytekin M, et al. Canadian laboratory initiative on pediatric reference interval database (CALIPER): pediatric reference intervals for an integrated clinical chemistry and immunoassay analyzer, Abbott ARCHITECT ci8200. Clin Biochem. 2009;42(9):885‐891. [DOI] [PubMed] [Google Scholar]
- 33. Blasutig IM, Jung B, Kulasingam V, et al. Analytical evaluation of the VITROS 5600 integrated system in a pediatric setting and determination of pediatric reference intervals. Clin Biochem. 2010;43(13–14):1039‐1044. [DOI] [PubMed] [Google Scholar]
- 34. Lo SF, Doumas BT, Ashwood ER. Performance of bilirubin determinations in US laboratories–revisited. Clin Chem. 2004;50(1):190‐194. [DOI] [PubMed] [Google Scholar]
- 35. Thurlow V, Bailey IR, Griffiths W. Conjugated bilirubin measurements in Gilbert's syndrome: method dependence. Ann Clin Biochem. 2005;42(Pt 1):67‐69. [DOI] [PubMed] [Google Scholar]
- 36. Fulgoni VL 3rd, Agarwal S, Kellogg MD, Lieberman HR. Establishing pediatric and adult RBC reference intervals with NHANES data using piecewise regression. Am J Clin Pathol. 2019;151(2):128‐142. [DOI] [PMC free article] [PubMed] [Google Scholar]
- 37. George J, Denney‐Wilson E, Okely AD, Hardy LL, Aitken R. The population distributions, upper normal limits and correlations between liver tests among Australian adolescents. J Paediatr Child Health. 2008;44(10):579‐585. [DOI] [PubMed] [Google Scholar]
- 38. England K, Thorne C, Pembrey L, Tovo PA, Newell ML. Age‐ and sex‐related reference ranges of alanine aminotransferase levels in children: European paediatric HCV network. J Pediatr Gastroenterol Nutr. 2009;49(1):71‐77. [DOI] [PubMed] [Google Scholar]
Associated Data
This section collects any data citations, data availability statements, or supplementary materials included in this article.
Data Availability Statement
All data generated or analyzed during this study are included in this published article.