Abstract
Background
To find new diagnostic markers for idiopathic membranous nephropathy (IMN) and also conduct preliminary explorations into the possible pathogenesis of IMN by comparing the expression of microRNA‐451a (miR‐451a), miR‐106a, miR‐19b, miR‐17, and phosphatase and tensin homolog (PTEN) protein in the serum of patients with IMN and healthy controls.
Methods
The expression levels of miR‐451a, miR‐106a, miR‐19b, and miR‐17 in the serum of patients in the IMN group (n = 55, age: 50.2 ± 12.1 years) and the control group (n = 58, age 47.4 ± 13.1 years) were measured by quantitative real‐time polymerase chain reaction (qRT‐PCR), and the concentration of serum PTEN protein was determined by enzyme‐linked immunosorbent assay (ELISA).
Results
Compared with the control group, the expression of miR‐106a, miR‐19b, and miR‐17 was decreased significantly in the IMN group, whereas PTEN protein concentration was increased significantly in the IMN group. The areas under the receiver operating characteristic curve (AUC) of serum miR‐106a, miR‐19b, miR‐17, and PTEN were 0.66 (95% confidence interval [CI], 0.56–0.76), 0.81 (95% CI, 0.73–0.89), 0.69 (95% CI, 0.59–0.79), and 0.86 (95% CI, 0.79–0.93), respectively. The level of serum PTEN protein was negatively correlated with the expression of miR‐106a and miR‐19b. PTEN concentration was positively correlated with serum urea (Urea), creatinine (Crea), cystatin C (Cysc), 24 h urine total protein (24 h‐UP) and negatively correlated with albumin (Alb) and estimated glomerular filtration rate (eGFR).
Conclusions
MiR‐106a, miR‐19b, miR‐17, and PTEN are involved in the pathogenesis of IMN and may become new biomarkers for the diagnosis of IMN.
Keywords: idiopathic membranous nephropathy, microRNA‐106a, microRNA‐17, microRNA‐19b, microRNA‐451a, phosphatase and tensin homolog protein
The concentration of serum PTEN protein was significantly increased in IMN as compared with controls. Compared with miR‐106a, miR‐19b, and miR‐17, the diagnostic performance of PTEN was the highest in IMN. Serum PTEN was positively correlated with Urea, Crea, Cysc, and 24h‐UP, and negatively correlated with Alb and eGFR. Serum PTEN was involved in the pathogenesis of IMN, and may become a new biomarker for the diagnosis of IMN.

1. INTRODUCTION
In recent years, with the incidence of membranous nephropathy (MN) gradually increasing, MN is now the main cause of nephrotic syndrome in adults after IgA nephropathy (IgAN). 1 The main clinical features of MN are extensive proteinuria and a gradual decline in renal function. 2 Depending on the etiology, MN can be divided into idiopathic membranous nephropathy (IMN) and secondary membranous nephropathy (SMN). The pathogenesis of IMN is still unclear.
The onset of IMN is usually insidious, and renal impairment often develops within 5–10 years. Early diagnosis and timely treatment play a crucial role in preventing or delaying renal failure. Renal biopsy is the gold standard for diagnosis of IMN. However, since it is an invasive procedure, there are certain limitations in the application of IMN, including clinical contraindications, such as solitary kidney, small kidney, mental illness, severe hypertension. The discovery of phospholipase A2 receptor antibody (anti‐PLA2R) in the serum is a milestone in the noninvasive diagnosis of IMN. However, the diagnostic sensitivity of anti‐PLA2R in IMN varies among different diagnostic centers, ranging from 82% 3 to 51%. 4 Therefore, it is still of great practical significance to find safe, rapid, and effective noninvasive indicators for diagnosing IMN.
MicroRNA (miRNA) is an endogenous non‐coding small RNA, consisting of 22–23 ribonucleotides. Its main function is to inhibit or promote important biological processes in the body, such as cell differentiation, proliferation, and apoptosis, by regulating gene expression. 5 Studies suggest that miRNAs are involved in the pathogenesis of several kidney diseases. 6 , 7 , 8 , 9 , 10 , 11 , 12 Increasing evidence suggests that miRNAs play important roles in the pathogenesis and progression of IMN. Studies have found that compared with healthy controls, miR‐217 13 in renal podocytes, and miR‐82, miR‐98, miR‐89, miR‐84, miR‐152, and miR‐15 14 in peripheral blood lymphocytes of patients with IMN were significantly differently expressed. Phosphatase and tensin homolog (PTEN) protein is a classic pro‐apoptotic protein, 15 , 16 , 17 which can promote cell apoptosis an promote apoptosis of many kinds of cellsan promote apoptosis of many kinds of cells. 18 , 19 , 20 Studies have confirmed that the PTEN/AKT pathway is associated with glomerular injury through action on podocytes. 21 , 22 B. Xiao et al. 22 found that compared with healthy controls, the expression of miR‐451, miR‐106a, miR‐19b, and miR‐17 in the patients with idiopathic focal segmental glomerulosclerosis (FSGS) was significantly down‐regulated, thereby suggesting that these miRNAs play an important role in the pathogenesis of idiopathic FSGS.
Like idiopathic FSGS, IMN is a typical podocyte disease. We hypothesize that miR‐451a, miR‐106a, miR‐19b, miR‐17, and PTEN may be involved in the pathogenesis of IMN. Therefore, in this study, we detected and compared the expression of serum miR‐451a, miR‐106a, miR‐19b, miR‐17, and PTEN in IMN and control groups in order to find new markers for the diagnosis of IMN; we analyzed the correlations between the different miRNAs and PTEN protein, between PTEN protein and serum albumin (Alb), urea (Urea), creatinine (Crea), cystatin C (Cysc), and estimated glomerular filtration rate (eGFR), 24‐h urine total protein (24 h‐UP), as a preliminary means to explore the possible pathogenesis of IMN.
2. MATERIALS AND METHODS
2.1. Subjects
Our study was comprised of 2 groups, the IMN and control groups. Between May 2017 and October 2018, 55 patients were diagnosed initially as IMN by renal biopsy at the Department of Nephrology of Shengjing Hospital of China Medical University; these patients were included in the IMN group. A total of 58 healthy individuals who visited the physical examination center were included in the control group. Patients in the IMN group did not have IgA nephropathy, diabetic nephropathy, lupus nephritis, allergic purpuric nephritis, FSGS, antineutrophil cytoplasmic antibody (ANCA)‐associated vasculitis, severe heart and brain disease, liver or hematopoietic disease, pregnancy, cancer, or other autoimmune diseases.
Fasting venous blood (2 ml) was drawn from patients in the IMN group at admission. The blood samples were centrifuged at 1200 g for 10 min, and the serum was separated and stored in a −70°C deep freezer. The leftover serum from healthy individuals after physical examination was collected and stored in a −70°C freezer. All samples were collected and tested centrally in one laboratory. This study was approved by the ethics committee (approval number: 2019PS143K) of Shengjing Hospital of China Medical University.
2.2. Clinical data collection
We collected the clinical and laboratory data, including age, gender, serum Alb, Urea, Crea, Cysc, eGFR (estimated using CKD‐EPI formula based on creatinine and cystatin C, 2012), and 24 h‐UP from IMN patients at admission and healthy controls.
2.3. Methods
2.3.1. Detection of miR‐451a, miR‐106a, miR‐19b, and miR‐17
Total RNA extraction and cDNA synthesis
Total RNA was extracted by using miRNeasy Serum/Plasma Kit (Qiagen, Valencia, CA, USA). MiRNA First Strand cDNA Synthesis (Tailing Reaction) (Sangon Biotech, Shanghai, China) was used to reverse transcribe the extracted miRNA into cDNA. All operations were carried out according to the kit instructions.
Quantification of miRNA by quantitative real‐time polymerase chain reaction (qRT‐PCR)
To evaluate the expression of miR‐451a, miR‐106a, miR‐19b, and miR‐17 in the serum, qRT‐PCR was carried out using 2 × SG Fast qPCR Master Mix Low Rox and ABI 7500 Real‐Time PCR System (Applied Biosystems, Foster city, CA, USA). U6 was used as an internal reference. The primers of miR‐451a, miR‐106a, miR‐19b, miR‐17, U6 R, and U6 F were designed and synthesized by Sangon Biotech; the sequences are shown in Table 1. The reaction was carried out in three steps: 95°C for 3 min, 1 cycle; followed by 95°C for 3 s, 60°C for 30 s, 40 cycles. The relative expressions of miR‐451a, miR‐106a, miR‐19b, and miR‐17 were calculated by the 2−ΔΔct method. 23
TABLE 1.
Primer sequences of miR‐451a, miR‐106a, miR‐19b, miR‐17, U6 R, and U6 F
| miRNA | Primer sequences |
|---|---|
| miR‐451a | 5′‐AAACCGTTACCATTACTGAGTT‐3′ |
| miR‐106a | 5′‐AAAAGTGCTTACAGTGCAGGTAG‐3′ |
| miR‐19b | 5′‐TGTGCAAATCCATGCAAAACTGA‐3′ |
| miR‐17 | 5′‐CAAAGTGCTTACAGTGCAGGTAG‐3′ |
| U6 R | 5′‐AACGCTTCACGAATTTGCGT‐3′ |
| U6 F | 5′‐CTCGCTTCGGCAGCACA‐3′ |
2.3.2. Detection of serum PTEN protein
Enzyme‐linked immunosorbent assay (ELISA) was used to detect serum PTEN by TECAN automated enzyme immunoassay analyzer (TECAN Corporation, Switzerland). The PTEN kit was purchased from Wuhan Cloud Cloning Technology Co., Ltd., Hubei province, China. The entire operation was conducted according to the kit instructions.
2.4. Statistical analysis
Quantitative data that followed a normal distribution are expressed as mean ± standard deviation ( ± S) and were analyzed using the t test. Qualitative data are expressed as percentages and were analyzed using the χ 2 test. Correlation analyses were conducted using GraphPad Prism 7.0 (GRAPHPAD Corporation, USA). The diagnostic performance of differential biomarkers in IMN was evaluated by receiver operating characteristic curve (ROC) analysis, and statistical graphs were made using GraphPad Prism 7.0. The areas under the ROC (AUC) and the correlation analysis were compared using the Z test. All statistical analyses were performed using SPSS 17.0 (IBM Corporation, USA). p < 0.05 was considered statistically significant.
3. RESULTS
3.1. Clinical data of the IMN and control groups
Compared with the control group, serum Alb and eGFR were significantly reduced, and Urea and Cysc were significantly increased in the IMN group (Table 2). There were no statistically significant differences in serum Crea, age, and gender between the two groups (Table 2).
TABLE 2.
Clinical data of patients in the IMN and control groups
| IMN group | Control group | p value | |
|---|---|---|---|
| N | 55 | 58 | – |
| Age a | 50.2 ± 12.1 | 47.4 ± 13.1 | 0.244 |
| Gender (M: F) b | 27: 28 | 29: 29 | 0.923 |
| Alb (g/L) a | 24.8 ± 5.2 | 46.2 ± 2.5 | <0.0001 |
| Urea (mmol/L) a | 6.9 ± 2.9 | 4.9 ± 1.1 | <0.0001 |
| Crea (μmol/l) a | 68.7 ± 15.9 | 68.9 ± 12.6 | 0.957 |
| Cysc (mg/L) a | 1.28 ± 0.38 | 0.80 ± 0.11 | <0.0001 |
| eGFR (ml/min/1.73 m2) a | 77.36 ± 19.92 | 104.09 ± 14.21 | <0.0001 |
| 24 h‐UP (mg/24 h) | 5.0 ± 3.3 | – | – |
“N” represents the number of patients in each group. Age, Alb, Urea, Crea, Cysc, eGFR, and 24 h‐UP followed a normal distribution and were expressed as mean ± standard deviation.
p < 0.05 was considered statistically significant.
Comparisons made by t test.
Comparisons made by χ 2 test.
3.2. The expression of serum miR‐106a, miR‐19b, and miR‐17 in IMN patients was significantly lower than that in healthy controls, and miR‐19b had the highest diagnostic performance
Compared with the control group, the relative expressions of miR‐106a (IMN group: 0.83 ± 0.67, control group: 1.19 ± 0.74, p = 0.0077, Figure 1A), miR‐19b (IMN group: 0.53 ± 0.53, control group: 1.12 ± 0.65, p < 0.0001, Figure 1B), and miR‐17 (IMN group: 0.78 ± 0.56, control group: 1.17 ± 0.61, p = 0.0006, Figure 1C) were significantly reduced in the IMN group. However, serum miR‐451a expression was not significantly different between the two groups (IMN group: 1.19 ± 1.11, control group: 1.16 ± 0.71, p = 0.84, Figure 1D).
FIGURE 1.
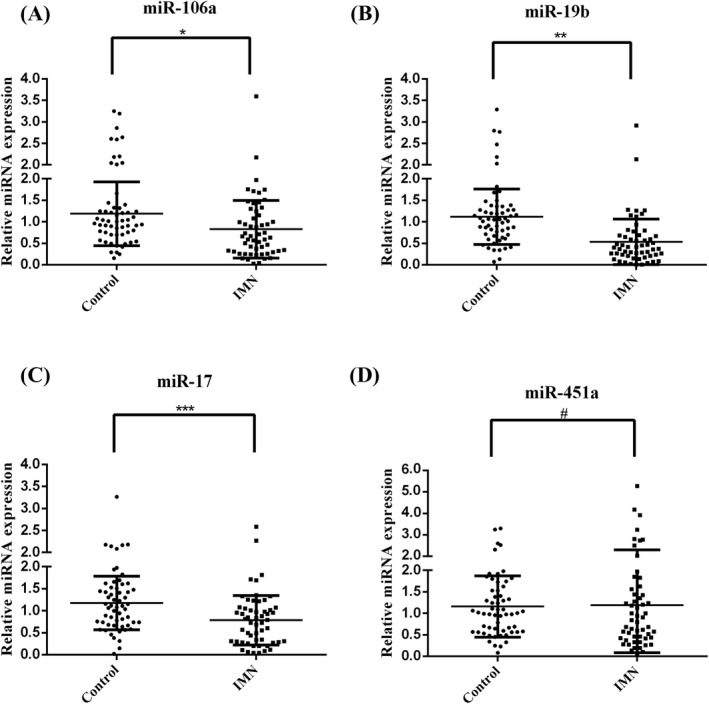
The expression of serum miR‐106a, miR‐19b, miR‐17, and miR‐451a in the IMN and control groups. The relative expression of miR‐106a, miR‐19b, miR‐17, and miR‐451a showed a normal distribution, which were expressed as the mean ± standard deviation. Differences between the two groups were tested by t test. p < 0.05 was considered statistically significant. (A) serum miR‐106a, *p = 0.0077, the IMN group (0.83 ± 0.67) vs. control group (1.19 ± 0.74). (B) serum miR‐19b, **p < 0.0001, the IMN group (0.53 ± 0.53) vs. control group (1.12 ± 0.65). (C) serum miR‐17, ***p = 0.0006, the IMN group (0.78 ± 0.56) vs. control group (1.17 ± 0.61). (D) serum miR‐451a, # p = 0.84, the IMN group (1.19 ± 1.11) vs. control group (1.16 ± 0.71)
Furthermore, we evaluated the diagnostic performance of miR‐106a, miR‐19b, and miR‐17 in IMN by ROC analysis. The AUC of miR‐106a (Figure 2A), miR‐19b (Figure 2B), and miR‐17 (Figure 2C) were 0.66 (95% confidence interval [CI], 0.56–0.76), 0.81 (95% CI, 0.73–0.89), and 0.69 (95% CI, 0.59–0.79), respectively. And the cumulative AUC for miR‐106a, miR‐19b, miR‐17 was 0.81(95% CI, 0.73–0.90). The Z test was then used to compare the differences between AUCs of the 3 indicators used to diagnose IMN; the results showed that the AUC of miR‐19b was statistically significantly higher than that of miR‐106a and miR‐17; however, the difference between miR‐106a and miR‐17 was not statistically significant. Specifically, the AUC difference between miR‐19b and miR‐106a was 0.15 (Z = 3.598, p = 0.0003), between miR‐19b and miR‐17 it was 0.12 (Z = 2.474, p = 0.0133), and between miR‐106a and miR‐17 it was –0.03 (Z = 0.672, p = 0.5014). This indicates that miR‐106a, miR‐19b, and miR‐17, especially miR‐19b, may be potential serological diagnostic markers in IMN.
FIGURE 2.
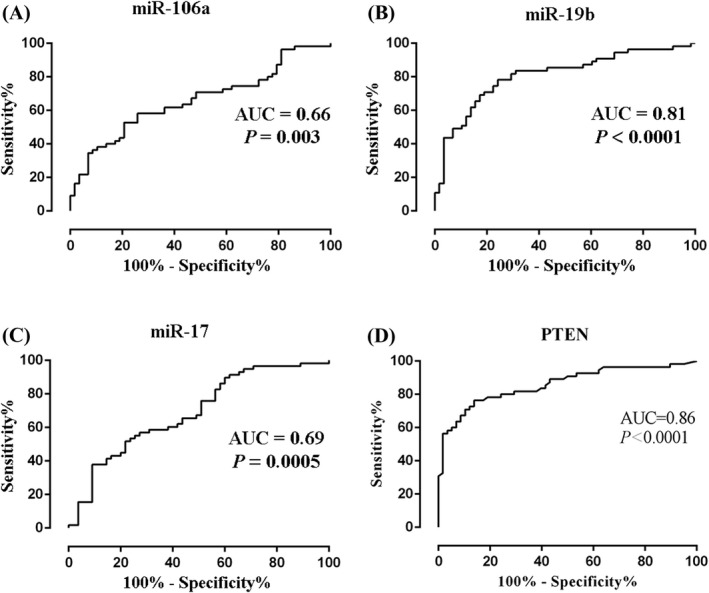
The diagnostic performance of miR‐106a, miR‐19b miR‐17, and PTEN in IMN. (A) serum miR‐106a, AUC 0.66 (95% CI, 0.56–0.76). (B) serum miR‐19b, AUC 0.81 (95% CI, 0.73–0.89). (C) serum miR‐17, AUC 0.69 (95% CI, 0.59–0.79). (D) serum PTEN, AUC 0.86 (95% CI, 0.79–0.93)
3.3. The concentration of serum PTEN in IMN patients was significantly higher than that in the control group, and it had a high diagnostic performance in IMN
Compared with the control group, the concentration of serum PTEN was significantly increased in the IMN group (IMN group: 2.93 ± 1.30 ng/ml, control group: 1.48 ± 0.62 ng/ml, p < 0.0001, Figure 3). Furthermore, we evaluated the diagnostic performance of serum PTEN in IMN by ROC analysis; the AUC of PTEN (Figure 2D) was 0.86 (95% CI, 0.79–0.93). This indicates that serum PTEN is a potential diagnostic marker of IMN.
FIGURE 3.
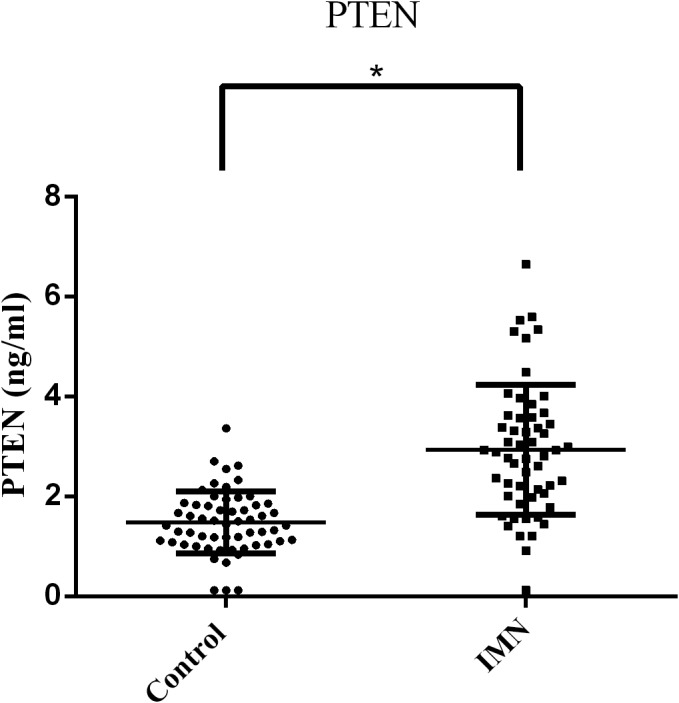
The concentration of serum PTEN in the IMN and control groups. The concentration of PTEN in the IMN and control groups showed a normal distribution, which was expressed as the mean ± standard deviation. The difference between the two groups was tested by t test. p < 0.05 was considered statistically significant. *p < 0.0001, the IMN group (2.93 ± 1.30 ng/ml) vs. control group (1.48 ± 0.62 ng/ml)
3.4. The level of serum PTEN was negatively correlated with the expression of miR‐106a and miR‐19b
In addition, we analyzed the correlation between the serum PTEN and miR‐106a, miR‐19b, miR‐17, respectively. The results showed that the concentration of serum PTEN was negatively correlated with the expression of miR‐106a (r = −0.2196, p = 0.0194, Figure 4A) and miR‐19b (r = −0.3693, p < 0.0001, Figure 4B). There was no correlation between PTEN and miR‐17 (r = −0.1419, p = 0.1339, Figure 4C).
FIGURE 4.
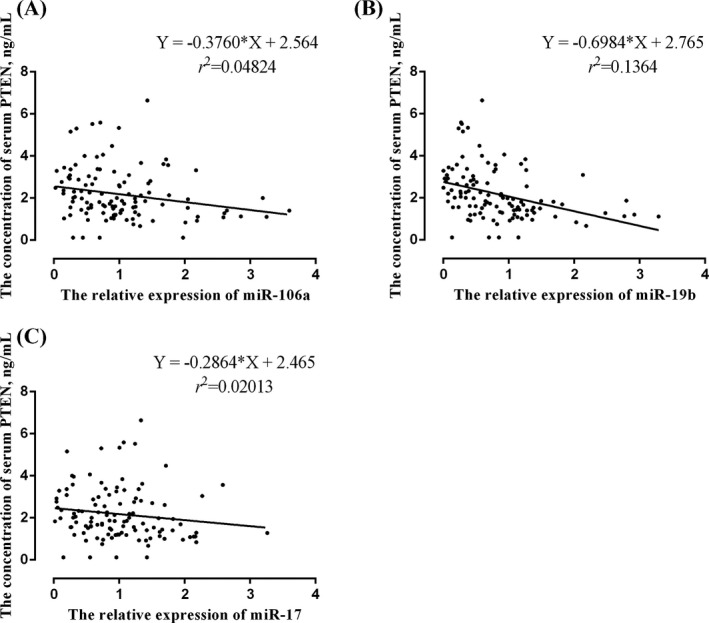
Correlation analysis between serum PTEN and miR‐106a, miR‐19b, and miR‐17. (A) miR‐106a and PTEN: the equation of regression was Y = −0.3760X + 2.564, r = −0.2196, p = 0.0194. (B) miR‐19b and PTEN: the equation of regression was Y = −0.6984X + 2.765, r = −0.3693, p < 0.0001. (C) miR‐17 and PTEN: the equation of regression was Y = −0.2864X + 2.465, r = −0.1419, p = 0.1339
3.5. The concentration of serum PTEN was positively correlated with serum Urea, Crea, Cysc, and 24 h‐UP, and negatively correlated with Alb and eGFR
We also analyzed the correlation between serum PTEN and Alb, Urea, Crea, Cysc, eGFR, 24 h‐UP, respectively. The results showed that serum Urea, Crea, Cysc, and 24 h‐UP were positively correlated with PTEN; the correlation coefficients were Urea (r = 0.4405, p < 0.0001, Figure 5A), Crea (r = 0.3091, p = 0.0009, Figure 5B), Cysc (r = 0.7007, p < 0.0001, Figure 5C), and 24 h‐UP (r = 0.4093, p = 0.0019, Figure 5D). Serum Alb and eGFR were negatively correlated with PTEN; the correlation coefficients were Alb (r = −0.6375, p < 0.0001, Figure 5E), eGFR (r = −0.6354, p < 0.0001, Figure 5F).
FIGURE 5.
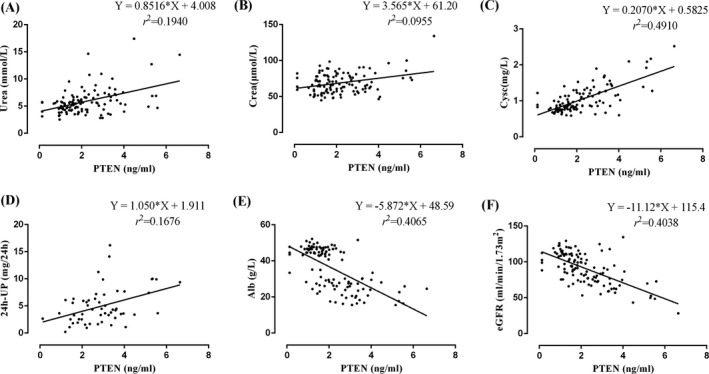
Correlation analysis between serum PTEN and serum Urea, Crea, Cysc, 24 h‐UP, Alb, and eGFR. (A) PTEN and Urea: the equation of regression was Y = 0.8516X + 4.008, r = 0.4405, p < 0.0001. (B) PTEN and Crea: the equation of regression was Y = 3.565X + 61.20, r = 0.3091, p = 0.0009. (C) PTEN and Cysc: the equation of regression was Y = 0.2070X + 0.5825, r = 0.7007, p < 0.0001. (D) PTEN and 24 h‐UP: the equation of regression was Y = 1.050X + 1.911, r = 0.4093, p = 0.0019. (E) PTEN and Alb: the equation of regression was Y = −5.872X + 48.59, r = −0.6375, p < 0.0001. f. PTEN and eGFR: the equation of regression was Y = −11.12X + 115.4, r = −0.6354, p < 0.0001
4. DISCUSSION
In this study, we found compared with the healthy control group, the relative expressions of serum miR‐106a, miR‐19b, and miR‐17 were significantly decreased in the IMN group, whereas the concentration of PTEN protein was significantly increased. And the diagnostic performance of miR‐106a, miR‐19b, miR‐17, and PTEN in the IMN was 0.66, 0.81, 0.69, and 0.86, respectively.
IMN belongs to glomerular diseases. The injury and apoptosis of podocytes play an important role in the occurrence and development of glomerular diseases, such as MN, 13 IgAN, 24 and FSGS. 25 As important regulators of pro‐apoptotic gene expression, miR‐106a, miR‐19b, and miR‐17 play a crucial role in cell proliferation and apoptosis. PTEN protein inhibits the development of tumor cells by antagonizing the activity of phosphorylated enzymes, and the expression of PTEN gene is regulated by miRNAs. K. Brinkmann et al. found that missing miR17‐92 clusters resulted in the loss of hematopoietic stem cells. 26 In a study on chronic myeloid leukemia, G. Guo et al. confirmed that miR‐106a, miR‐106b, and miR‐17 could inhibit the expression of PTEN gene and promote the proliferation of leukemic cells. 27 J. Yuan et al. found that abnormally elevated levels of miR‐19b and miR‐20a in the serum of multiple myeloma patients can inhibit apoptosis of multiple myeloma cells by targeting PTEN, thereby inducing tumorigenesis. 28 MiR‐19b promotes cell survival and inhibits cell apoptosis by targeting PTEN via regulation of the PI3K/AKT pathway, thus having significant neuronal protective effects. 29 Therefore, our results suggested that miR‐106a, miR‐19b, miR‐17, and PTEN were involved in the pathogenesis of IMN, and maybe new biomarkers for the diagnosis of IMN, especially miR‐19b and PTEN.
Filtration is the main function of glomeruli, and the injury and apoptosis of podocyte is one of the main causes of the decreased glomerular filtration function. Serum Cysc and eGFR (CKD‐EPI Cr‐Cysc, 2012) are the more sensitive indexes used to evaluate GFR and could detect early renal damage; 24 h‐UP and serum Alb reflect changes in glomerular filtration function through protein loss. Serum Urea and Crea have low molecular weight and can pass freely through the glomerular filtration membrane; however, they are affected by exogenous intake, tubular reabsorption and excretion, and powerful reserve function of the kidney; they increase only when the GFR drops below 50% of normal. Therefore, serum Urea and Crea are the least sensitive and specific indicators in reflecting glomerular filtration function.
In order to explore the possible pathogenetic roles of miR‐106a, miR‐19b, miR‐17, and PTEN in IMN, the correlations between PTEN protein and miR‐106a, miR‐19b, miR‐17; between serum PTEN and Alb, Urea, Crea, Cysc, eGFR, 24 h‐UP were analyzed in the current paper. The results showed that PTEN was negatively correlated with miR‐106a, and miR‐19b, serum Urea, Crea, Cysc, and 24 h‐UP were positively correlated with PTEN, serum Alb and eGFR were negatively correlated with PTEN. As measured by the correlation coefficient, the correlation between serum Cysc and PTEN was the strongest, followed by that between serum Alb, eGFR, and PTEN. These results suggest that early decrease in glomerular filtration function maybe related to PTEN, miR‐106a, and miR‐19b. MiR‐106a and miR‐19b maybe the upstream molecules of PTEN, which are involved in the pathogenesis of IMN through regulation of the expression of PTEN gene, whereas the pathogenetic role of miR‐17 in IMN is independent of PTEN.
In summary, in this study we propose new noninvasive biomarkers for diagnosis of IMN and speculate on the possible pathogenetic mechanisms in IMN; this will provide a theoretical basis for an in‐depth exploration of the pathogenesis of IMN. However, our study has some limitations. Further experiments are needed to explore the specific pathways by which miR‐106a, miR‐19b, and PTEN promote apoptosis of podocytes, as well as the role of miR‐17 in the pathogenesis of IMN. Moreover, as there was no disease control group in this study, the differential diagnostic value of miR‐106a, miR‐19b, miR‐17, and PTEN in IMN remains to be elucidated.
CONFLICT OF INTEREST
There is no conflict of interest in this work.
AUTHOR CONTRIBUTIONS
Lina Wu, Yong Liu, and Xiaosong Qin conceived and designed the experiments; Lina Wu, Xinpeng Zhang, and Xiaoying Li performed the experiments; Xinpeng Zhang and Lin Luo analyzed the data; Lina Wu and Xiaosong Qin contributed reagents/materials/analysis tools; Lina Wu and Xinpeng Zhang drafted and finalized the manuscript.
Funding information
This study was funded by “the National Science and Technology Major Project of China (2018ZX10302205),” “Liaoning Province Natural Science Foundation Project (20180550523) and Project (2019ZD0764),” “Liaoning Province Central Government's special project to guide local scientific and technological development (2019JH6/10400009),” “Major Special Project of Construction Program of China Medical University in 2018 (112/3110118034),” and “345 talent project” of Shengjing Hospital of China Medical University. The funders had no role in study design, data collection, and analysis, decision to publish, or preparation of the manuscript.
DATA AVAILABILITY STATEMENT
The data that support the findings of this study are available from the corresponding author upon reasonable request.
REFERENCES
- 1. Pan X, Xu J, Ren H, et al. Changing spectrum of biopsy‐proven primary glomerular diseases over the past 15 years: a single‐center study in China. Contrib Nephrol. 2013;181:22‐30. [DOI] [PubMed] [Google Scholar]
- 2. Ronco P, Debiec H. Pathophysiological advances in membranous nephropathy: time for a shift in patient's care. Lancet. 2015;385:1983‐1992. [DOI] [PubMed] [Google Scholar]
- 3. Qin W, Beck LH Jr, Zeng C, et al. Anti‐phospholipase A2 receptor antibody in membranous nephropathy. J Am Soc Nephrol. 2011;22:1137‐1143. [DOI] [PMC free article] [PubMed] [Google Scholar]
- 4. Liu Y, Li X, Ma C, et al. Serum anti‐PLA2R antibody as a diagnostic biomarker of idiopathic membranous nephropathy: the optimal cut‐off value for Chinese patients. Clin Chim Acta. 2018;476:9‐14. [DOI] [PubMed] [Google Scholar]
- 5. Bartel DP. MicroRNAs: genomics, biogenesis, mechanism, and function. Cell. 2004;116:281‐297. [DOI] [PubMed] [Google Scholar]
- 6. Yao T, Zha D, Gao P, et al. MiR‐874 alleviates renal injury and inflammatory response in diabetic nephropathy through targeting toll‐like receptor‐4. J Cell Physiol. 2018;234:871‐879. [DOI] [PubMed] [Google Scholar]
- 7. Wu J, Liu J, Ding Y, et al. MiR‐455‐3p suppresses renal fibrosis through repression of ROCK2 expression in diabetic nephropathy. Biochem Biophys Res Commun. 2018;503:977‐983. [DOI] [PubMed] [Google Scholar]
- 8. Zhang Y, Zhao S, Wu D, et al. MicroRNA‐22 promotes renal tubulointerstitial fibrosis by targeting PTEN and suppressing autophagy in diabetic nephropathy. J Diabetes Res. 2018;2018:4728645. [DOI] [PMC free article] [PubMed] [Google Scholar]
- 9. Qian X, Tan J, Liu L, et al. MicroRNA‐134‐5p promotes high glucose‐induced podocyte apoptosis by targeting bcl‐2. Am J Transl Res. 2018;10:989‐997. [PMC free article] [PubMed] [Google Scholar]
- 10. Wu J, Zhang H, Wang W, et al. Plasma microRNA signature of patients with IgA nephropathy. Gene. 2018;649:80‐86. [DOI] [PubMed] [Google Scholar]
- 11. Li C, Shi J, Zhao Y. MiR‐320 promotes B cell proliferation and the production of aberrant glycosylated IgA1 in IgA nephropathy. J Cell Biochem. 2018;119:4607‐4614. [DOI] [PubMed] [Google Scholar]
- 12. Min QH, Chen XM, Zou YQ, et al. Differential expression of urinary exosomal microRNAs in IgA nephropathy. J Clin Lab Anal. 2018;32:e22226. [DOI] [PMC free article] [PubMed] [Google Scholar]
- 13. Li J, Liu B, Xue H, et al. miR‐217 is a useful diagnostic biomarker and regulates human podocyte cells apoptosis via targeting TNFSF11 in membranous nephropathy. Biomed Res Int. 2017;2017:2168767. [DOI] [PMC free article] [PubMed] [Google Scholar]
- 14. Chen W, Lin X, Huang J, et al. Integrated profiling of microRNA expression in membranous nephropathy using high‐throughput sequencing technology. Int J Mol Med. 2014;33:25‐34. [DOI] [PMC free article] [PubMed] [Google Scholar]
- 15. Shi DY, Liu HL, Stern JS, et al. Alpha‐lipoic acid induces apoptosis in hepatoma cells via the PTEN/Akt pathway. FEBS Lett. 2008;582:1667‐1671. [DOI] [PubMed] [Google Scholar]
- 16. Yao H, Shang Z, Wang P, et al. Protection of luteolin‐7‐O‐glucoside against doxorubicin‐induced injury through PTEN/Akt and ERK pathway in H9c2 cells. Cardiovasc Toxicol. 2016;16:101‐110. [DOI] [PubMed] [Google Scholar]
- 17. Liu K, Liu S, Zhang W, et al. miR‐494 promotes cell proliferation, migration and invasion, and increased sorafenib resistance in hepatocellular carcinoma by targeting PTEN. Oncol Rep. 2015;34:1003‐1010. [DOI] [PubMed] [Google Scholar]
- 18. Zheng P, Chen L, Yuan X, et al. Exosomal transfer of tumor‐associated macrophage‐derived miR‐21 confers cisplatin resistance in gastric cancer cells. J Exp Clin Cancer Res. 2017;36:53. [DOI] [PMC free article] [PubMed] [Google Scholar]
- 19. Ye L, Wang Y, Nie L, et al. MiR‐130 exerts tumor suppressive function on the tumorigenesis of human non‐small cell lung cancer by targeting PTEN. Am J Transl Res. 2017;9:1856‐1865. [PMC free article] [PubMed] [Google Scholar]
- 20. Sui J, Yang X, Qi W, et al. Long non‐coding RNA Linc‐USP16 functions as a tumour suppressor in hepatocellular carcinoma by regulating PTEN expression. Cell Physiol Biochem. 2017;44:1188‐1198. [DOI] [PubMed] [Google Scholar]
- 21. Li H, Zhu X, Zhang J, et al. MicroRNA‐25 inhibits high glucose‐induced apoptosis in renal tubular epithelial cells via PTEN/AKT pathway. Biomed Pharmacother. 2017;96:471‐479. [DOI] [PubMed] [Google Scholar]
- 22. Xiao B, Wang LN, Li W, et al. Plasma microRNA panel is a novel biomarker for focal segmental glomerulosclerosis and associated with podocyte apoptosis. Cell Death Dis. 2018;9:533. [DOI] [PMC free article] [PubMed] [Google Scholar]
- 23. Livak KJ, Schmittgen TD. Analysis of relative gene expression data using real‐time quantitative PCR and the 2(‐Delta Delta C(T)) Method. Methods. 2001;25:402‐408. [DOI] [PubMed] [Google Scholar]
- 24. Trimarchi H, Canzonieri R, Schiel A, et al. In IgA nephropathy, glomerulosclerosis is associated with increased urinary CD80 excretion and urokinase‐type plasminogen activator receptor‐positive podocyturia. Nephron Extra. 2017;7:52‐61. [DOI] [PMC free article] [PubMed] [Google Scholar]
- 25. Campbell KN, Tumlin JA. Protecting podocytes: a key target for therapy of focal segmental glomerulosclerosis. Am J Nephrol. 2018;47(Suppl 1):14‐29. [DOI] [PMC free article] [PubMed] [Google Scholar]
- 26. Brinkmann K, Ng AP, de Graaf CA, et al. miR17~92 restrains pro‐apoptotic BIM to ensure survival of haematopoietic stem and progenitor cells. Cell Death Differ. 2020;27:1475‐1488. [DOI] [PMC free article] [PubMed] [Google Scholar]
- 27. Guo G, Kang Q, Zhu X, et al. A long noncoding RNA critically regulates Bcr‐Abl‐mediated cellular transformation by acting as a competitive endogenous RNA. Oncogene. 2015;34:1768‐1779. [DOI] [PubMed] [Google Scholar]
- 28. Yuan J, Su Z, Gu W, et al. MiR‐19b and miR‐20a suppress apoptosis, promote proliferation and induce tumorigenicity of multiple myeloma cells by targeting PTEN. Cancer Biomark. 2019;24:279‐289. [DOI] [PubMed] [Google Scholar]
- 29. Liu WG, Han LL, Xiang R. Protection of miR‐19b in hypoxia/reoxygenation‐ induced injury by targeting PTEN. J Cell Physiol. 2019;234:16226‐16237. [DOI] [PubMed] [Google Scholar]
Associated Data
This section collects any data citations, data availability statements, or supplementary materials included in this article.
Data Availability Statement
The data that support the findings of this study are available from the corresponding author upon reasonable request.


