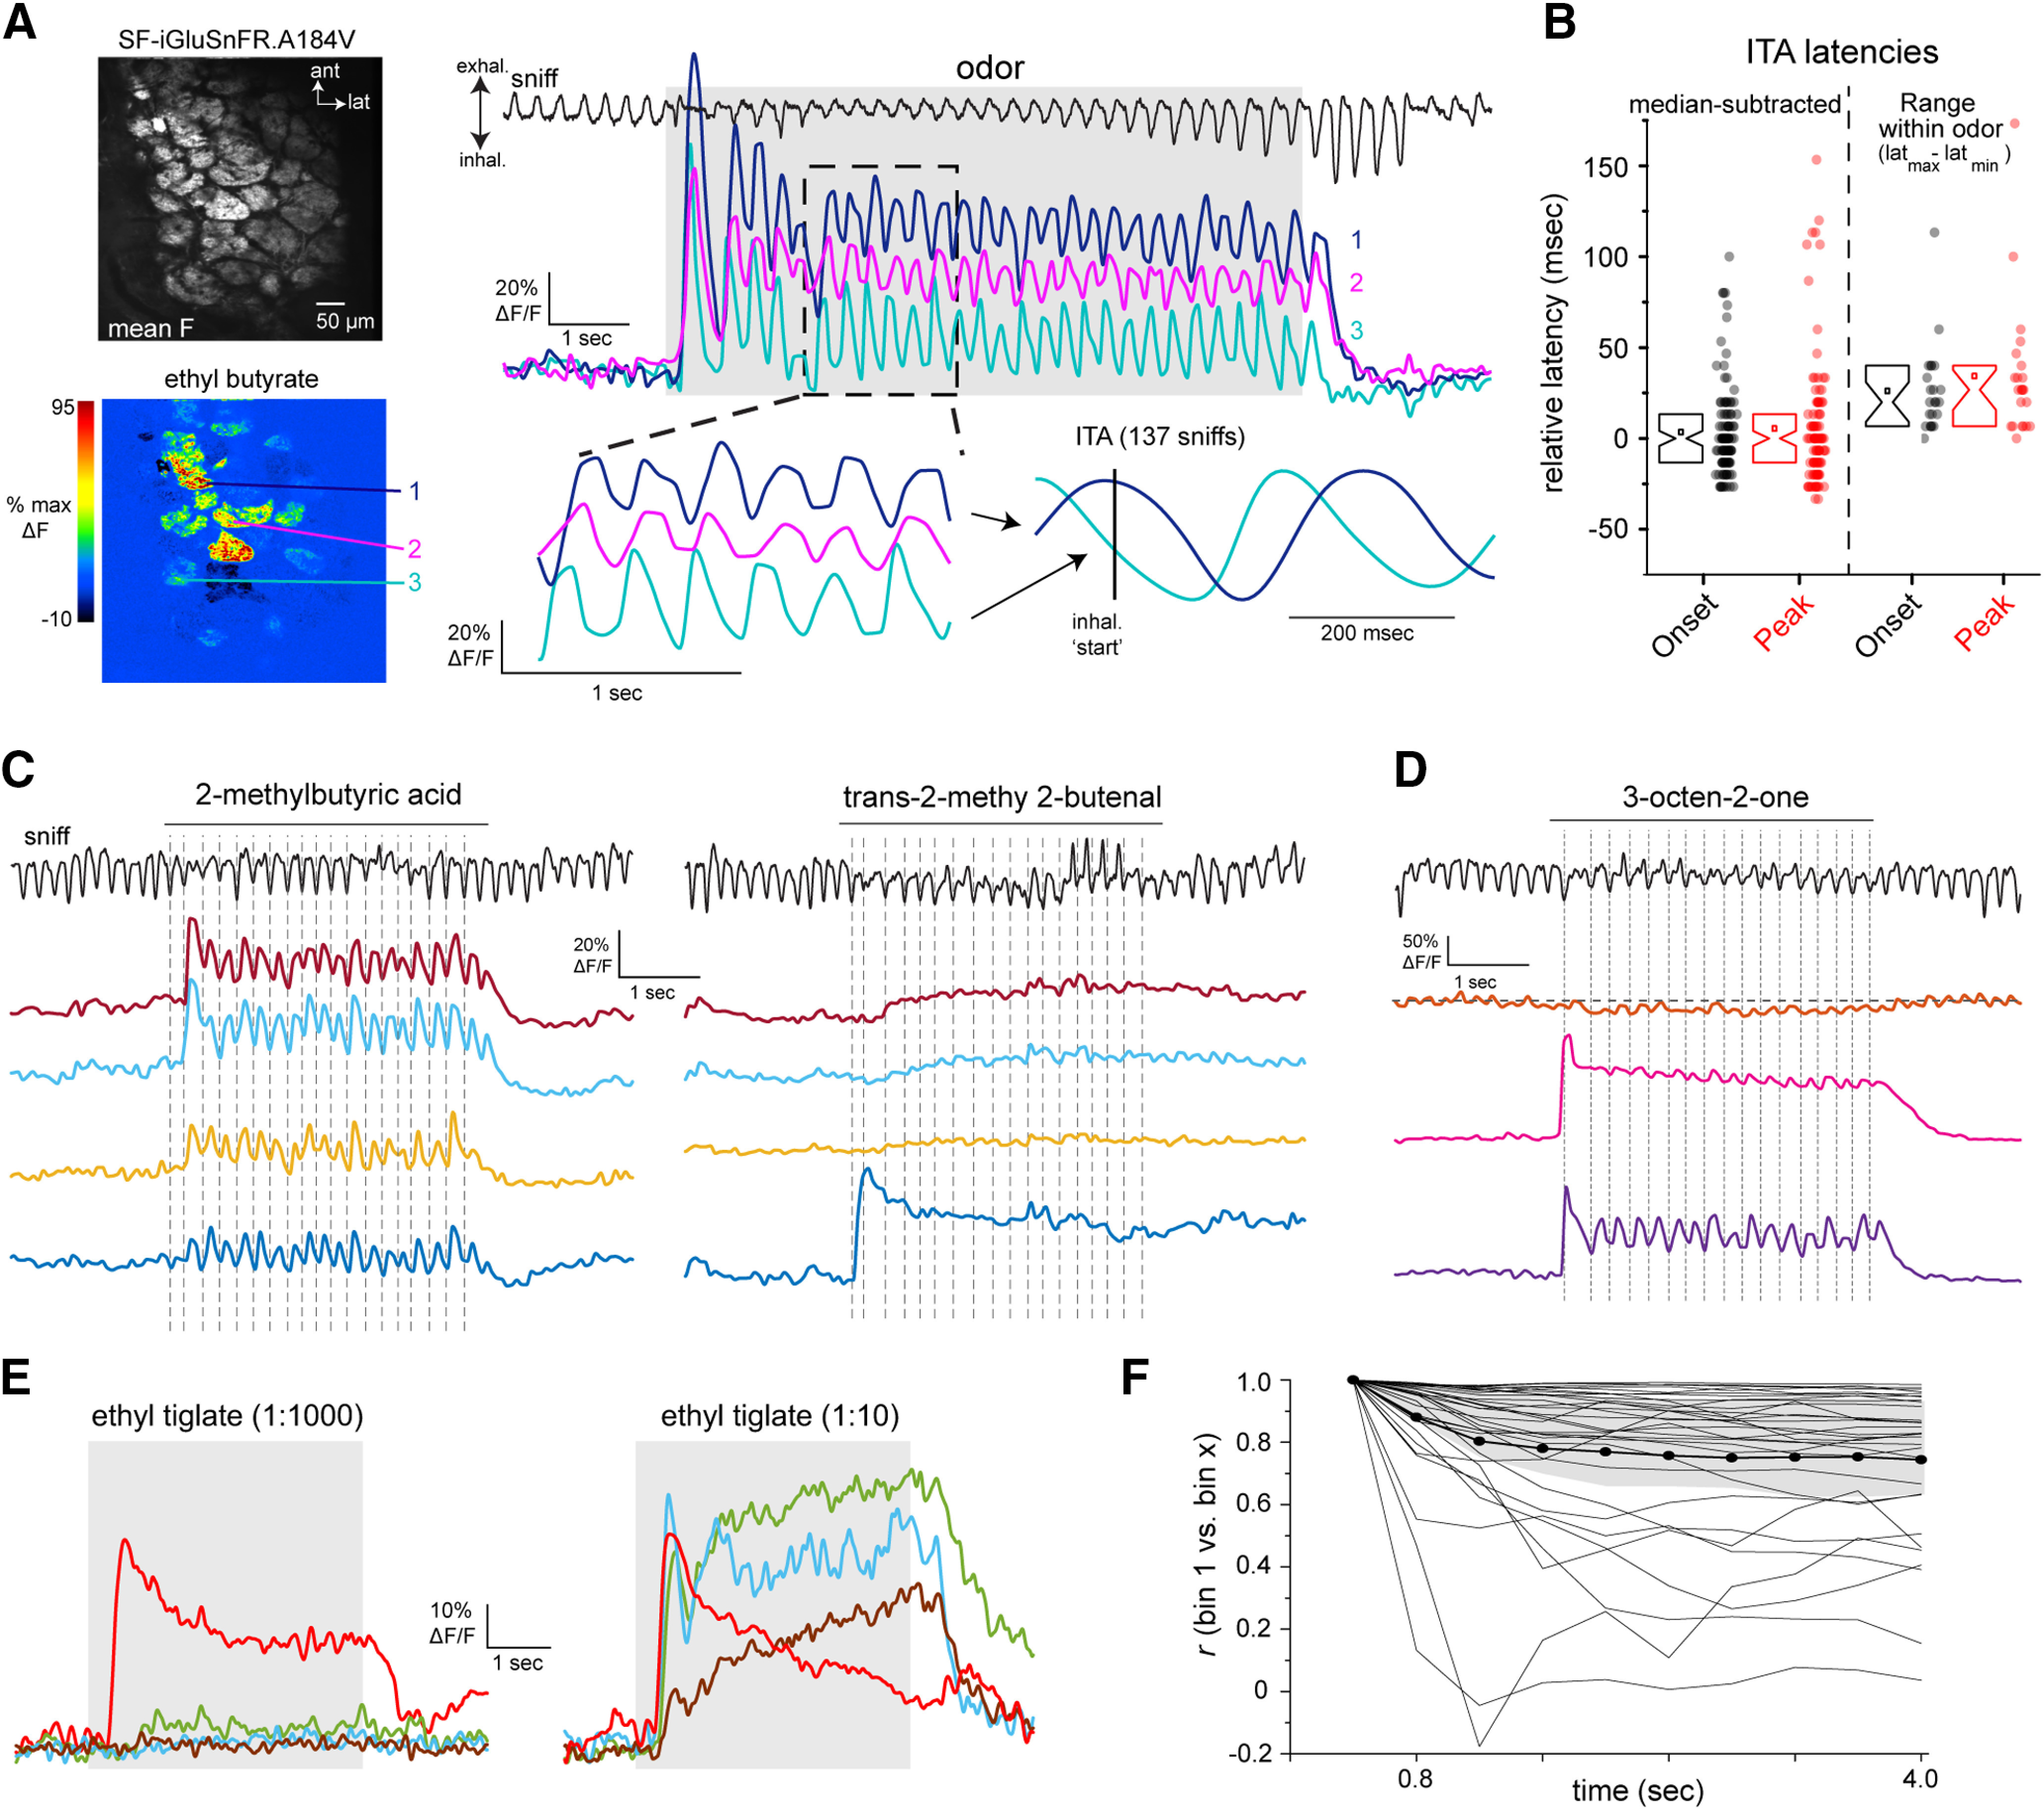
Figure 5.

Diversity of glutamate dynamics imaged from MT cells in the awake mouse. A, Top, Mean SF-iGluSnFR.A184V fluorescence. Bottom, ΔF response map (ethyl butyrate) from the dorsal OB of an awake, head-fixed mouse. Right, Glutamate signals from three glomeruli (shown in A) during a single presentation of odorant (ethyl butyrate). Top trace shows respiration/sniffing as measured with an external flow sensor, with inhalation oriented downward. Lower left, snippet of signals from each glomerulus, illustrating temporal lag between different glomeruli and consistency of dynamics with each sniff. Signals are unfiltered. Lower right shows ITA waveforms for each glomerulus, generated across 137 sniffs over six presentations of ethyl butyrate. Vertical line indicates time of inhalation onset. B, Left, Range of ITA onset (black) and peak (red) latencies, relative to median values, compiled across 108 glomerulus-odorant pairs (14 odorants, seven fields of view). Notch: median, box edges: 25th and 75th percentiles, square: mean values. Right, Spread of latency values seen across multiple responsive glomeruli imaged in the same field of view for the same odorant (defined as the difference between maximum (latmax) and minimum (latmin) latencies), for 17 unique odorant presentations. C, SF-iGluSnFR.A184V signals imaged from four glomeruli from the same FOV showing responses to each of two odorants, showing distinct temporal response patterns across glomeruli and odorants. Traces are unfiltered and from a single presentation. Top trace shows respiration/sniffing for each trial; vertical dotted lines indicate inhalation peak for reference. D, SF-iGluSnFR.A184V signals imaged from three glomeruli, taken from a separate field of view in the same mouse, showing distinct response patterns to a third odorant (3-octen-2-one). Note weak suppressive response in one glomerulus (top trace). E, Increasing odorant concentration elicits changes in glutamate signal dynamics in awake mice. Traces show averaged responses (eight presentations) from four glomeruli in the same field of view to a low (1:1000 dilution) versus high (1:10) concentration of ethyl tiglate. Note that the response in the most sensitive glomerulus shows increased adaptation at the higher concentration, while other glomeruli show facilitating responses. F, Changes in glutamate response patterns over the course of odorant presentation, calculated as described for Figure 3, in four awake mice, 33 odorant-FOVs (two mice, SF-iGluSnFR.A184V; two mice, SF-iGluSnFR.A184S). Plots of individual odorant responses are shown in gray, thick black line shows mean, shaded region is quartiles (25th and 75th percentiles). Note high variability in degree of decorrelation over time.
