

Abstract
Genomic structural variation is an important source of genetic and phenotypic diversity, playing a critical role in evolution. The recent availability of a high-quality reference genome for the eastern oyster, Crassostrea virginica, and whole-genome sequence data of samples from across the species range in the USA, provides an opportunity to explore structural variation across the genome of this species. Our analysis shows significantly greater individual-level duplications of regions across the genome than that of most model vertebrate species. Duplications are widespread across all ten chromosomes with variation in frequency per chromosome. The eastern oyster shows a large interindividual variation in duplications as well as particular chromosomal regions with a higher density of duplications. A high percentage of duplications seen in C. virginica lie completely within genes and exons, suggesting the potential for impacts on gene function. These results support the hypothesis that structural changes may play a significant role in standing genetic variation in C. virginica, and potentially have a role in their adaptive and evolutionary success. Altogether, these results suggest that copy number variation plays an important role in the genomic variation of C. virginica.
This article is part of the Theo Murphy meeting issue ‘Molluscan genomics: broad insights and future directions for a neglected phylum’.
Keywords: Crassostrea virginica, CNV, copy number variation, structural variation, duplications, genome
1. Introduction
Various processes contribute to the evolution of genomes, including substitutions, insertions, deletions, transpositions, translocations, inversions, lateral gene transfer, and gene and genome duplications [1–4]. Although all of these processes have been recognized as a significant force in adaptation and evolution [4,5], technological advances in high throughput methods for genotyping single nucleotide polymorphisms (SNPs) initially pushed the primary focus of many genome-scale projects to characterizing this form of variation [6]. However, with the increasing availability of whole-genome assemblies and whole-genome sequencing, the importance of structural variants (SVs), which have been recognized since the 1930s [7,8] as a flexible and fast evolutionary mechanism for generating genetic diversity [9], has been reemphasized [10]. Additionally, it is now feasible to thoroughly examine SVs across the genome for multiple individuals in a species and consider how they vary [11,12].
Copy number variants (CNVs), defined as regions of genomes within a species that vary in quantity among individuals, are one type of SV of interest. Extra copies of genes (duplications) can result in greater gene expression or provide the raw material for sub- or neofunctionalization [13]. Duplications can be tandem or segmental and are formed via mechanisms that include unequal crossing over, transposon-mediated duplication or retroduplication [14,15]. Studies in model species, including humans, have highlighted potential functional effects of CNVs [16–20], including effects on immunity, diet-related adaptation, neurodegenerative diseases, cancers [21] and drug efficacy (reviewed in [22,23]). Population-wide studies have revealed marked variation in copy number among populations, indicating that CNVs can be impacted by population-specific selection pressures [16]. In agriculturally important species (e.g. maize and cattle), breed-specific CNVs can affect complex traits and may be valuable in informing future breeding strategies [24,25]. Studies in non-model organisms, including plants, fish and mammals, have found high levels of standing variation in CNVs [26–30]. This variation has been found to support adaptability in highly fluctuating and changing environments, adaptation to new environments [28–30], and has contributed to speciation and evolutionary diversification [26]. These studies highlight the importance of CNVs for gene function and evolution.
The eastern oyster, Crassostrea virginica, is native to the Atlantic coast of North America, where it experiences wide variation in environmental factors such as salinity, temperature, dissolved oxygen, pollutants, pathogens and microbial load [31–34]. This species has undergone lineage-specific expansion and diversification of multiple gene families, particularly those involved in responses to environmental stress and infectious agents, potentially owing to these challenging and variable environments [35–37]. In C. virginica, tandem duplication is the predominant evolutionary process responsible for this expansion and is an ongoing process [36,38]. In particular, gene duplications leading to the expansion of gene families related to immunity may provide an evolutionary advantage, for example in pathogen recognition through increased diversity of recognition receptors [38]. This exposure to the environmental variation that could select for different variants, along with the fact that oysters are known to be highly polymorphic [39,40], suggests that the additional copies of particular genes in individuals could function as a significant component of standing variation in this species that may have led to gene family diversity.
In order to understand the link between variation and adaptation, we first need a better understanding of variation. Owing to the recognized importance of expanded gene families in oysters, we focus our analysis on duplications rather than other forms of structural variation. We find extensive genome-wide duplications in C. virginica, with inbred individuals showing fewer duplications. The highest percentage of duplications in the genome lie within genes, suggesting the potential for impacts on gene function. Perhaps surprisingly, the pattern of sharing across individuals does not follow the geographic distribution of sampling locations. This variation establishes duplications as an important element of genetic diversity in this species. This work provides the essential foundation for understanding the links between duplications, gene family expansion and phenotypic variation in this widespread and commercially important species.
2. Methods
(a). Sampling
In total, 60 individuals of C. virginica from 9 geographical locations, with a maximum of 6 individuals per sampling location (n = 3–6), were sampled along the eastern coast of the United States (figure 1 and electronic supplementary material, table S1a). Samples included wild individuals from the nine locations (LM, HC, CS, SM, HI, SL, CL, CLP and HC-VA) plus individuals from two highly inbred families, HG and NG (produced by sister–brother mating of progeny derived from meiotic gynogenesis and self-fertilization, respectively). HG and NG are derived from two inbred sublines of the NEH strain, which has been selectively bred for increased growth and survival in the Delaware Bay (Rutgers University, New Jersey, USA) since the 1960s [41]. The NG abbreviation is used for family NEH Hermaphrodite in this paper.
Figure 1.
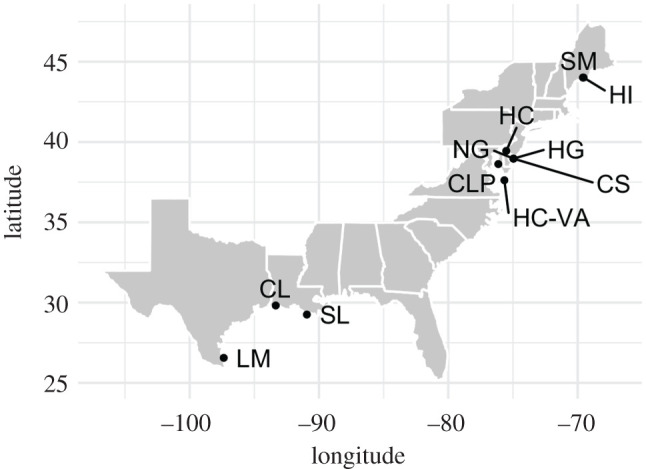
Map showing nine geographical locations where samples of the eastern oyster (Crassostrea virginica) were collected for sequencing. These locations include Hummock Cove (HC-VA), Chlora's Point (CLP), Cape shore (CS), Cape shore inbred samples (HG, NG), Hope creek (HC), Calcasieu Lake (CL), Sister Lake (SL), Hog Island (HI), Sherman Marsh (SM) and Laguna Madre (LM). Sample size was 6 for all sampling locations except for HG and LM, which had 3 and 5 samples, respectively. Sites CL, LM and SL (n = 17) have a higher average temperature compared with HC-VA, CLP, CS and HC (n = 24), allowing for comparison of CNVs between groups. Details regarding sampling metadata are provided in electronic supplementary material, tables S1a and S1b.
(b). Genome sequencing
Paired-end Illumina reads were obtained from the whole-genome sequencing of all the individuals. We used a modified version of dDocent [42] for quality control, trimming and mapping to the reference genome. Adapters were removed and reads were quality trimmed with Trimmomatic [43]. Reads were mapped to the reference genome (NCBI assembly Bioproject PRJNA376014, GCA_002022765.4 C_virginica-3.0; the genome size for this species is estimated to be 685 Mb with the assembly containing one contig per chromosome with an N50 = 1.97 Mb) using BWA [44] with a reduction in the mismatch parameter (-b 3), and the Gap opening parameter (-O 5) and duplicates marked with Picard [45] using the MarkDuplicatesWithMateCigar option. Mappings were then filtered using samtools [46], removing mappings with PHRED quality scores less than 10, marked as secondary or duplicated, or having soft or hard clippings greater than 80 bp. Details for this analysis can be found in the associated repository (https://github.com/tejashree1modak/Cvir-cnv/tree/master/WGS-BAMs).
(c). Duplication discovery
CNVs were called for each individual separately using the software DELLY (v. 0.7.8) [47], which uses a paired-end, long-range mate pairs and split-read approach to identify CNVs in genomic datasets. DELLY is a popular tool used in a large number of research studies with high accuracy in CNV detection for a variety of organisms including human [48], birds [49], butterflies [50] and plants [51,52]. BAM files for each of the samples, and the reference genome of C. virginica as obtained from NCBI (assembly GCF_002022765.2_C_virginica-3.0), were used as input. The reference genome was sequenced using PacBio long-read technology, which provided an advantage in CNV detection [53]. CNVs were called using ‘germline SV calling’ with default parameters using filtered BAM files as input. Our analysis focuses only on duplications, defined as genome segments with an increase of copy number relative to the reference genome. In this paper, we refer to each copied region as a ‘duplication’ and the quantity with which it varies among individuals as the number of copies. In some cases, multiple duplications overlapped a single region of the genome; these were treated as separate duplications. DELLY was also used to infer copy number genotypes and evaluate the occurrence of each duplication in all samples. All duplications were treated as dominant loci and genotypes were scored as present or absent in each sample.
(d). Data processing
As a part of the CNV calls for each individual sample as compared to the reference genome, DELLY identified the chromosomal location, length, the individual's genotype and copy number for each duplication. These data were processed using custom R scripts [54,55] as outlined below (available at https://github.com/tejashree1modak/Cvir-cnv).
(i). Filtration
Because our analysis focused on duplications alone, only duplication calls identified by DELLY were analysed further. We removed obvious false positives by applying three filtration criteria to the duplications identified in the previous step. First, low-quality duplications were filtered out based on mapping quality and the number of paired-ends that supported the call. DELLY flags call as low quality if they do not meet the criteria of ≥3 paired-ends supporting the variant and mean mapping quality of ≥20 (Filter 1). Second, duplications shared by all sampling locations and more than 90% of samples were discarded, as these were viewed as fixed duplications or likely to represent either genome assembly errors or genuine deletions in the reference genome (Filter 2) [50]. Third, duplications with high repeat coverage were filtered out to eliminate false positives and errors in duplication identification owing to high repeat content [56,57]. The overlap between repeat regions as identified in the reference genome (as part of genome annotation on NCBI, available at https://ftp.ncbi.nlm.nih.gov/genomes/all/GCA/002/022/765/GCA_002022765.4_C_virginica-3.0/ using Repeat masker [58] and duplications were obtained using BEDTools v. 2.26 [59]. Duplications with more than 10% repeat coverage were removed from the dataset (Filter 3). All the downstream analysis as outlined in §§4b–d were performed on duplications that passed these three filtration criteria.
(ii). Characterization
We compared (i) the frequency of duplications and (ii) the variation in the number of additional copies, along the complete length of all chromosomes and across all samples. In order to estimate the frequency of duplications in this species, the following analyses were conducted. The percentage genome coverage of duplications was calculated as a proportion of the total length of merged duplications to genome length. Data for duplication lengths were compared across all individuals as well as per sampling location to understand their distribution. Individual genotypes for each duplication were also compared with the estimated frequency of homozygosity or heterozygosity for duplications across samples. To allow for comparison of duplications at the chromosomal level, sampling location level and individual level, a CNV ‘map’ was made by using the chromosomal locations and the number of copies of all identified duplications in all samples across all ten chromosomes.
To assess the influence of environmental factors, we compared duplications among locations with different temperatures. Temperature data were obtained from the National Data Buoy Center (https://www.ndbc.noaa.gov/) and the closest buoy to the collection location was used to gather site-specific temperature data. Details of the specific stations/buoy and the URLs used for obtaining this data are listed in electronic supplementary material (table S1b). We obtained data for seven of the nine locations with wild individuals. HG and NG were excluded because they are highly inbred families and not wild individuals. One year of recorded data was used to calculate the minimum, maximum and average temperatures for each location. Temperature data for all seven locations showed similar maximum temperatures (27.2–32°C), but based on the average temperature recorded, locations were divided into two temperature groups. The high-temperature group is found in Texas and Louisiana and consists of samples from CL, LM and SL (n = 17), with an average temperature of 21.42–23.95°C. The low-temperature group is found in Delaware Bay and consists of samples from HC-VA, CLP, CS and HC (n = 24), with an average temperature of 15.21–14.43°C.
We first examined each group for unique duplications compared with all other samples. To determine whether the number of unique duplications in each sample was greater than would be expected from a random sample of this size, we randomly sampled 17 individuals 100 times and calculated the number of unique duplications in each group relative to all other samples. Second, we examined the frequency of duplications found in both groups to identify those found in particularly high frequency in one group, as this could indicate selection. We looked for duplications found in more than 90% of individuals in one group and less than 10% in the other.
(iii). Overlap with genomic features
To assess the possible impact of duplications on gene function, overlap between duplications and various genomic features including genes, exons, introns and intergenic regions were obtained using BEDTools v. 2.26 [59]. Genomic features were pulled from the reference genome annotation file from NCBI (GCF_002022765.2_C_virginica-3.0_genomic.gff.gz) using custom bash scripts. The proportion of duplications that completely overlap with each of the above genomic features was obtained.
(iv). Annotation and functional mapping
To assess if duplications are more prevalent in particular functional categories, a GO enrichment analysis was performed on genes overlapping duplications. Gene annotations were taken from the reference genome annotation (GCF_002022765.2_C_virginica-3.0_genomic.gff.gz) and duplications were annotated based on the intersect with annotated genes using BEDTools v. 2.26 [59]. Gene ontology (GO) terms and Kyoto Encyclopedia of Genes and Genomes (KEGG) IDs for duplications were obtained from the reference genome using Interproscan (v. 5.27-66.0) installed with the Panther member database analysis package (v. 12.0). KEGG annotations were added to these annotations using Blast2GO (v. 5.0). GO enrichment analysis among genes that overlap duplications was performed in topGO using algorithm = ‘classic’ and statistic = ‘fisher’, as implemented in the software [60]. Terms with p-value = 0.05 were considered significantly enriched. Based on the recommendation from topGO, p-values of tested groups were not adjusted for multiple comparisons. Genes overlapping duplications that were annotated by KEGG were sorted to obtain the top ten most common functions as described by KEGG annotation.
3. Results
(a). Extensive duplications are present in the eastern oyster genome
Quality trimming resulted in 21.4–81.7 million read pairs per sample with 5–18X coverage, with an average coverage of 8.3X and a mapping rate of 93.30–99.41%. Across all 60 samples and 9 geographic locations, we identified 19 315 duplications. Filters 1, 2 and 3 identified 6815, 288 and 1641 duplications to be removed, respectively. Thus, we removed 8716 unique duplications, resulting in 10 599 duplications that were used in the downstream analysis (outlined in Methods §§4b–d).
After merging overlapping duplications from the final tally of 10 599, duplications affected 112.8 Mb (16.5%) of the C. virginica genome. The size distribution of all duplications followed a negative exponential (electronic supplementary material, figure S1), with the median length of 863 bp and mean length of 16 206 bp. The minimum length of duplication was 161 bp and the maximum length was 1 489 626 bp. 35% of duplications were less than 1000 bp. Comparison across samples from different sampling locations showed a similar mean length and spread of duplication lengths. We identified 3245 long segmental duplications (LSDs; duplications greater than 1 kb) with a minimum length of 1001 bp and a maximum length of 1 489 626 bp. The median length of LSDs was 5483 bp and the mean length was 34 208 bp.
Because the final coverage varied among individuals, we examined whether the observation of duplications was impacted by coverage using a Pearson correlation test in R. We found that the number of duplications we identified was not affected by coverage (p = 0.81).
(b). Variation in duplications among populations
Most sampling locations have a similar proportion (49–55%) of the total duplications identified, although the inbred families HG and NG had just 15% and 30%, respectively. A total of 5954 (56%) duplications are present in more than three sampling locations. Despite our small sample sizes from many sampling locations (n = 3–6), 696 (6.5%) duplications were shared among all locations and an additional 659 (6.2%) were shared by all locations except the inbred families (HG, NG). These represent the minimum shared among locations and this percentage would probably increase with larger sample sizes. Heterozygosity in duplications was more common across sampling locations than homozygosity (electronic supplementary material, figure S2).
We identified 1459 and 1322 unique duplications in high- and low-temperature groups, respectively. To determine whether these values were higher than would be expected from this relatively small sample size, we randomly resampled our full dataset 100 times and compared the number of unique duplications in our dataset to our random samples. In our random resampling, 95% of the sample sets had fewer than 836 unique duplications, or significantly less than our observed values for unique duplications in each temperature group.
We found 513 duplications in more than 90% of high-temperature samples and 325 duplications in more than 90% of low-temperature samples. However, no duplications were found in less than 10% of samples in either group. Of the high-frequency duplications in the high-temperature samples, just one was found in less than 54% of the low-temperature samples; similarly, of the high-frequency duplications in the low-temperature samples, just one was found in less than 30% of high-temperature samples. Neither of these duplications was annotated. Consequently, no duplications appeared to be high frequency in one group and low in the other.
(c). Variation in duplication frequency across the genome
Duplications are present and widespread on all chromosomes, with chromosome 5 having the highest frequency (ANOVA, p < 0.001) when normalized by chromosome length (figures 2 and 3). The frequency of duplications varies across chromosomes (ranging from 1.568 × 10−05 on chromosome 6 to 4.08 × 10−05 on chromosome 5), with the inbred individuals showing a lower than average frequency per chromosome (figure 2). Interestingly, progeny derived from an individual oyster through gynogenesis (HG) showed lower variation for most duplications than the progeny derived from self-fertilization of an oyster from a different line (NG). The pattern of duplications along the length of the chromosome varied among chromosomes, with duplication ‘hotspots’ widespread along their length (electronic supplementary material, figure S3a–j). Comparison of duplications across all samples did not show a specific trend per sampling location but highlighted loci with high variation across the sixty individual samples (figure S3a and electronic supplementary material, figure S3b–j).
Figure 2.
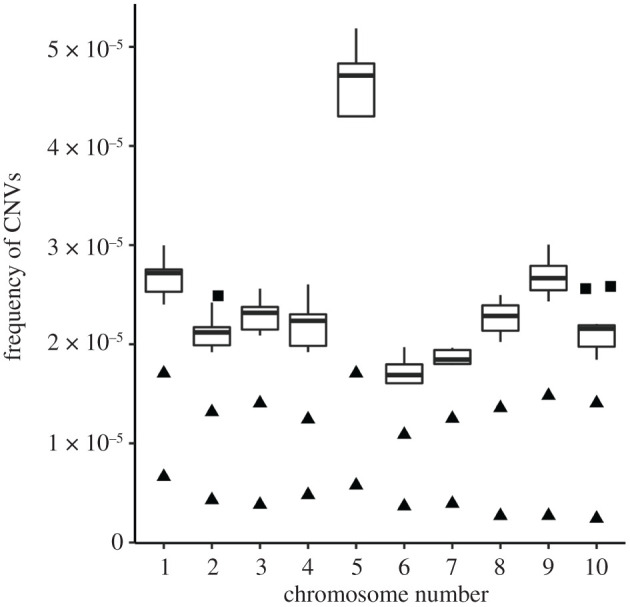
Genome-wide distribution of duplications. The plot shows variation in the frequency of duplications per chromosome normalized by chromosome length across all sampling locations. Outliers are shown as squares or triangles, defined as sampling locations that were less than 1.5 times interquartile range (IQR) from the 25th percentile and more than 1.5 times IQR from the 75th percentile. Frequency of duplications was the least in inbred individuals (HG and NG) for all chromosomes (shown as solid triangles).
Figure 3.

Duplications vary widely across chromosomes and among individuals, with some regions tending towards higher or lower copies, and inbred individuals showing generally fewer copies. Variation profiles for chromosomes 1 across 60 samples from nine sampling locations. The chromosomal position is shown from left to right (on X-axis) and each sample is shown as a row (on Y-axis). Each point denotes the presence or absence of a duplication at a particular locus on the chromosome and log of its copy number. Yellow to dark blue denote the presence of duplication with increasing copy number. The vertical red line in the middle of the figure denotes the midpoint of the chromosome that is close to the centromere. Variation profiles for chromosomes 2 to 10 are shown in electronic supplementary material (figure S3b–j).
(d). Functional implications of duplications
To evaluate the potential functional impact of duplications, we calculated the percentage of duplications that lie completely within genomic features. Duplications that partially overlapped a genomic feature were not included in the calculation. A total of 535 (5.05%) duplications lie completely within exons, 2306 duplications (21.8%) overlap introns completely, and 4270 (40.3%) duplications lie completely within 2815 genes (7.2% of the total genome). By contrast, 3105 (29.3%) duplications overlap intergenic regions completely. However, the density of duplications did not appear to be related to the density of exons (electronic supplementary material, figure S4).
(i). Functional mapping
63.45% of duplications that overlapped genes were annotated to a GO term. GO enrichment analysis showed 26 biological processes that were significantly enriched, mainly belonging to metabolism, signalling and immune processes, 17 metabolic functions and 2 cellular components (electronic supplementary material, table S2; p″0.05). GO enrichment analysis showed a broad effect of duplications on functions involved in metabolism, environmental processing and immune processes. Overrepresented categories included ‘biological regulation’, ‘response to stimulus’, ‘signal transduction’ and ‘immune system process'.
10.8% of duplications that overlapped genes were annotated to a KEGG ID. The top ten most common KEGG annotations for genes that overlap duplications were dominated by functions involved in metabolism and regulation of enzyme activity (electronic supplementary material, table S3). Phosphatases were the most common annotation, accounting for four of the top five, and peptidases were the second most common annotation for genes overlapping duplications. Among the peptidases, metalloendopeptidases were most common, followed by cysteine and serine endopeptidases. Among the 1459 and 1322 unique duplications in high- and low-temperature groups, 11.9% (174) and 10.6% (141) annotated to a KEGG ID, respectively. The top ten most common KEGG annotations for genes that overlap duplications, and GO enrichment results for these two groups, were identical to the annotations for all duplications, as described above (electronic supplementary material, tables S4 and S5).
4. Discussion
Genome-wide mapping of CNVs in C. virginica provides the essential foundation to link genomic variation with gene family expansion and phenotypic variation in this species. Living all along the Atlantic coast of North America, C. virginica are subject to gradients in temperature, salinity, dissolved oxygen, microbial load and water quality. Maintaining the extensive standing variation that we observed may support the survival of C. virginica as a sessile species living in heterogeneous conditions. Notably, we did not observe strong geographic or habitat correlations with particular duplications. This lack of differentiation may suggest limited population structure in this species, indicating that even though we sampled few individuals at each location, our sampling of the larger wild population was reasonable and further sampling would have limited impact on our larger conclusion of extensive numbers of, and variation in, duplications.
(a). Duplications are extensive and widespread in C. virginica
Duplications, even in our limited sample of C. virginica, accounted for a larger percentage of the genome (16.5%) than in several known species (human (3.7–4.8%), cattle (2.1%), zebrafish (14.6%) and killifish (3.61%)) with well-documented duplications [19,28,61–63]. The genome-wide distribution of duplications is similar to most species in that they are widely distributed throughout the genome [16,19,62], but also contrasts with others in which CNVs are concentrated on specific regions of the chromosomes [64,65]. Although the duplications in C. virginica are genome-wide, they showed some ‘hotspots’ on chromosomes that possess a high number of duplications. Species-specific genomic architecture can influence opportunities for formation and subsequent preservation of CNVs, leading to higher frequency ‘hotspots’ in some genes [17]. Prior work has suggested that CNV hotspots may be linked to repetitive elements [17,66]. Because high repeat content often leads to false positives and errors in duplication identification [56,57], we filtered out duplications with high repeat coverage to avoid this source of error. While this decision means that we cannot substantiate links between repetitive elements and CNV hotspots, distinguishing between CNVs and false positives in these regions would be difficult. Results presented here pave the way for future work to understand links between the presence of CNV hotspots, species-specific mechanisms generating CNVs and subsequent changes in the genome structure.
The extensive nature of duplications in C. virginica suggests two related possibilities: (i) that relaxation of purifying selection in this species allows a high degree of genetic variation without removal of extraneous duplicates in cases where they have little impact and/or (ii) that maintaining additional variation (e.g. owing to additional copies) allows for standing variation on which positive selection can act. Duplications are an ideal raw material for adaptation because they have the potential to bring about significant changes to the genome via increased expression, or sub- or neofunctionalization [16]. The presence of C. virginica in highly varied environments in which selective pressures such as pathogen diversity and environmental stress differ widely suggests that this species may benefit from the capacity for local adaptation or maintaining significant phenotypic plasticity [67,68]. However, the expansion of genomes indicating a lack of purifying selection has been documented in sessile organisms [69–71].
While ‘high-temperature’ and ‘low-temperature’ samples appeared to have more unique duplications than expected by chance, because the two groups are likely at least partly isolated it is difficult to distinguish between selection for particular duplications and simple population differentiation owing to mutation and drift. However, the lack of particular duplications at high frequency in one temperature group, and at low frequency in the other, does not suggest selection in one environment over the other. This result further supports the hypothesis of a relaxation of purifying selection and general maintenance of standing variation.
(b). Interindividual differences in duplications
This study shows that duplications not only occur at high frequencies but are also highly differentiated in numbers among individuals in C. virginica. This level of interindividual variation may enable local and/or future adaptation in oysters, as adaptation can be faster given high levels of pre-existing standing variation that offers immediately available genetic flexibility [72]. Specifically, this variation may provide resilience for established colonies by allowing them to sustain environmental fluctuations such as changing biotic (e.g. pathogen load) and abiotic (e.g. pollutants) factors. Involvement of interindividual copy number variation in immune response and defense genes has been supported by previous observations in oysters [73] as well as plants [74,75]. This information is the foundation for understanding diversity in this species such that specific links between CNVs and their implications in traits important for local adaptation can be further studied [76].
By contrast, we observed reduced standing variation in inbred samples, NG and HG [18,77]. Although these are highly specialized inbred individuals (gynogens and self-fertilized) that do not conform to the general oyster breeding practices, it suggests that this particular form of inbreeding reduces diversity. However, it is also possible that these individuals show limited duplications compared with the reference because they are closely related to the oyster sequenced for reference (with HG being nephews/nieces of the sequenced individual, all derived from one grandparent) [78]. This observation highlights the importance of estimating the level of genomic variation informed by CNVs in oyster lines used in aquaculture and restoration projects. By examining this variation, we provide a foundation for future studies to explore the links between reduced diversity and robustness of oyster lines. CNV diversity has proved important to studying effects of inbreeding and population decline [79], estimating diversity in highly inbred strains of animal models in biomedical research [80], and monitoring wild, captive or endangered populations [81].
(c). Functional implications
The high percentage of duplications seen in C. virginica lying completely within genes and exons contrasts with other species (e.g. Atlantic killifish and human) for which the highest percent of duplications overlapped with intergenic regions [28,61]. This result highlights that the functional implications of duplications may be different in oysters as compared with some other species. Although few studies report the proportion of duplication overlap with all genomic features, the overlap of duplications with genes, and as such their impact on gene function, has been documented in several species [19,29,65,77]. Such duplications can lead to sub- or neofunctionalization of extra gene copies [82]. The high percentage of duplications present in gene-rich regions of the oyster genome may suggest that they evolve under relaxed purifying selection or balancing selection, thus allowing them to preserve duplications in these regions [83]. The wealth of duplications in gene- and exon-rich regions shows their potential to influence gene diversity and functions in oysters [16,61]. It has been shown in C. virginica that exon duplication in alternative oxidase created a novel alternative splicing variant that is adaptive to stress [84].
The presence of the highest proportion of duplications in genes also supports the role of duplications in formation and expansion of gene families in C. virginica. Oysters have multiple expanded gene families, especially related to immune and stress-related functions [35,36,38]. Gene duplications leading to immune gene family expansion may provide an evolutionary advantage, for example in pathogen recognition through increased diversity of recognition receptors [38]. Tandem duplication has been demonstrated as a predominant evolutionary process responsible for this ongoing massive expansion in C. virginica [38]. This extensive interindividual and genome-wide copy number variation provides a window into the ongoing process of duplication accumulation leading to potential expansion and diversification of gene families. The participation of duplications in providing diversity in immune and stress response genes through expanded gene families may be central to the oyster's adaptation to these highly stressful and widely fluctuating environments [68,85].
Our analysis also highlights the potential impact of duplications on a variety of functions including metabolism, environmental processing and immune processes. A high proportion of genes overlapping duplications belong to phosphatases, a broad category of enzymes that perform functions involved in modulating protein activities and metabolism in a cell, often in response to external stimuli [86,87]. Duplications also overlap genes with functions critical for successful tolerance of environmental variation. These genes include carboxylesterases, involved in functions important for detoxification, and metallo-, cysteine and serine endopeptidases, an important part of the mucosal host immunity [88–90].
Genes involved in immunity and environmental processing have been observed to be enriched in CNVs [19,26,28,61,91] and a high number of duplicated genes belong to categories that are enzymes [4]. Duplications in genes involved in immune function and environmental processing in oysters could indicate that these gene categories are under relaxed selection and can better tolerate copy number fluctuations compared to other functions, or that polymorphism is maintained by balancing selection, which is considered to be a major force in shaping genetic diversity in oysters [92]. In humans, location-specific adaptive forces have been proposed to maintain duplications in genes enriched for crucial immune functions involved in immune-related disorders [93]. These forces could be responsible for the extensive duplications seen in oysters and variation among individuals possibly contributing to the massive expansion of immune gene families. Phylogenetic analysis of immune gene families of GIMAP (GTPase of the immune-associated proteins) and IFI44 (interferon-inducible 44) identified as uniquely expanded in bivalves supports the hypothesis of a lineage-specific expansion through gene duplication [35,36].
The presence of so many duplications, including some with high copy number, raises the question of the phenotypic impacts this variation may have on individuals, as increased copy number is known to be linked to gene expression [21,22]. This work serves to identify potential candidate genes affected by duplications that may be validated and characterized in detail using targeted methods to test functional impacts. We note that our analysis is based on the reference genome quality and our annotation results are limited by the availability of annotation information from the genes that were mapped to GO terms or to the KEGG database. Although the assembly quality for C. virginica is very good, even recent updates to the already high-quality human reference genome reduced the number of SVs that were falsely estimated [94].
A majority of the unique duplications identified in the high- and low-temperature groups also overlap with genes listed above. This result supports the hypothesis that the differentiation of these groups is more likely owing to mutation and drift with limited gene flow rather than selection for particular duplications. Because the temperature range of high and low groups overlapped substantially this is not surprising. However, more precise sampling and sequencing of individuals based on other differing environmental parameters could still demonstrate location-specific effects.
(d). Application to aquaculture
Aquaculture is one of the fastest-growing food production sectors, with C. virginica as a major commercial product on the Atlantic Coast of North America [95]. As a filter-feeder, this species is also recognized for the important ecosystem services it provides [96,97]. Because the growth of the aquaculture industry is threatened by disease and environmental change, it is important to consider how genomic variation can be exploited for breeding purposes, particularly disease resistance [74,75]. The variation observed here in C. virginica can serve as an important resource for the discovery of candidate genes and markers for developing lines with important traits crucial for aquaculture, such as disease resistance or increased growth [24,98,99]. On the other hand, the limited duplications seen in inbred individuals compared with those in the wild suggests that caution may be necessary to avoid losing genetic diversity in commercial breeding programs while selecting for relevant traits [100].
5. Conclusion
Our observation of genome-wide duplications in C. virginica, and the contrast with other species, demonstrates the value of surveying diversity in this species and identifies new avenues for further exploration of the links between CNV diversity and local adaptation. This study represents the first deep analysis of duplications in the eastern oyster at the genomic level. Extensive genome-wide duplications with high interindividual copy number variation support the hypothesis that structural changes play a significant role in standing genetic variation in C. virginica, and potentially have a role in their adaptive and evolutionary success. The enrichment of genes performing important metabolic and immune functions in duplications provides insight into how duplications may contribute to gene family expansion and their functional impact in oysters, and suggests candidate duplications that may be targeted for further characterization to understand specific impacts. Overall, this work provides a foundation to move forward both toward an understanding of variation leading to changes in genome structure, and toward accumulating sufficient information to link this variation to phenotype and local adaptation.
Acknowledgements
We thank Wes Warren for providing advice on filtration of false positives during the analyses, and Maren Wellenreuther and two anonymous reviewers for their helpful comments. We also thank Maurine Neiman and Angus Davison for the opportunity to present our work in the themed issue.
Data accessibility
A repository with the complete bioinformatic workflow described in the paper can be accessed at https://github.com/tejashree1modak/Cvir-cnv.
Authors' contributions
T.H.M. designed methodology, performed the analyses and wrote the manuscript. R.L. performed part of the analyses. J.B.P. performed bioinformatic processing to produce sample BAM files. K.M.J. performed GO and KEGG annotation of the reference genome. E.M.R. and D.P. processed samples for DNA extraction and WGS. X.G. generated inbred samples. M.G.-C. secured financial support and coordinated sample collection. R.S.S. conceived, designed and acquired funding for the study, helped draft and critically revised the manuscript and supervised the project. All authors read, provided comments and approved the final manuscript.
Competing interests
We declare we have no competing interests.
Funding
This work is supported by the USDA National Institute of Food and Agriculture, Hatch project accession no. 1017848.
References
- 1.Brookes AJ. 1999. The essence of SNPs. Gene 234, 177-186. ( 10.1016/S0378-1119(99)00219-X) [DOI] [PubMed] [Google Scholar]
- 2.Feulner PGD, De-Kayne R. 2017. Genome evolution, structural rearrangements and speciation. J. Evol. Biol. 30, 1488-1490. ( 10.1111/jeb.13101) [DOI] [PubMed] [Google Scholar]
- 3.Dagan T, Artzy-Randrup Y, Martin W. 2008. Modular networks and cumulative impact of lateral transfer in prokaryote genome evolution. Proc. Natl Acad. Sci. USA 105, 10 039-10 044. ( 10.1073/pnas.0800679105) [DOI] [PMC free article] [PubMed] [Google Scholar]
- 4.Taylor J, Raes J. 2004. Duplication and divergence: the evolution of new genes and old ideas. Annu. Rev. Genet. 38, 615-643. ( 10.1146/annurev.genet.38.072902.092831) [DOI] [PubMed] [Google Scholar]
- 5.Wang Y, Wang X, Tang H, Tan X, Ficklin SP, Paterson AH. 2011. Modes of gene duplication contribute differently to genetic novelty and redundancy, but show parallels across divergent angiosperms. PLoS ONE 6, e28150. ( 10.1371/journal.pone.0028150) [DOI] [PMC free article] [PubMed] [Google Scholar]
- 6.Wellenreuther M, Mérot C, Berdan E, Bernatchez L. 2019. Going beyond SNPs: the role of structural genomic variants in adaptive evolution and species diversification. Mol. Ecol. 28, 1203-1209. ( 10.1111/mec.15066) [DOI] [PubMed] [Google Scholar]
- 7.McClintock B. 1931. Cytological observations of deficiencies involving known genes, translocations and an inversion in Zea mays. Agric. Exp. Station Res. Bull. 163, 1-30. See https://mdh.contentdm.oclc.org/digital/collection/agexptstn/id/61443/rec/1. [Google Scholar]
- 8.McClintock B. 1950. The origin and behavior of mutable loci in maize. Proc. Natl Acad. Sci. USA 36, 344-355. ( 10.1073/pnas.36.6.344) [DOI] [PMC free article] [PubMed] [Google Scholar]
- 9.Ohno S. 1970. Evolution by gene duplication. Berlin, Germany: Springer. [Google Scholar]
- 10.Mérot C, Oomen RA, Tigano A, Wellenreuther M. 2020. A roadmap for understanding the evolutionary significance of structural genomic variation. Trends Ecol. Evol. 35, 561-572. ( 10.1016/j.tree.2020.03.002) [DOI] [PubMed] [Google Scholar]
- 11.Catanach A, Crowhurst R, Deng C, David C, Bernatchez L, Wellenreuther M. 2019. The genomic pool of standing structural variation outnumbers single nucleotide polymorphism by threefold in the marine teleost Chrysophrys auratus. Mol. Ecol. 28, 1210-1223. ( 10.1111/mec.15051) [DOI] [PubMed] [Google Scholar]
- 12.Flagel LE, Willis JH, Vision TJ. 2014. The standing pool of genomic structural variation in a natural population of Mimulus guttatus. Genome Biol. Evol. 6, 53-64. ( 10.1093/gbe/evt199) [DOI] [PMC free article] [PubMed] [Google Scholar]
- 13.Rastogi S, Liberles DA. 2005. Subfunctionalization of duplicated genes as a transition state to neofunctionalization. BMC Evol. Biol. 5, 28. ( 10.1186/1471-2148-5-28) [DOI] [PMC free article] [PubMed] [Google Scholar]
- 14.Hastings PJ, Lupski JR, Rosenberg SM, Ira G. 2009. Mechanisms of change in gene copy number. Nat. Rev. Genet. 10, nrg2593. ( 10.1038/nrg2593) [DOI] [PMC free article] [PubMed] [Google Scholar]
- 15.Magadum S, Banerjee U, Murugan P, Gangapur D, Ravikesavan R. 2013. Gene duplication as a major force in evolution. J. Genet. 92, 155-161. ( 10.1007/s12041-013-0212-8) [DOI] [PubMed] [Google Scholar]
- 16.Redon R, et al. 2006. Global variation in copy number in the human genome. Nature 444, 444-454. ( 10.1038/nature05329) [DOI] [PMC free article] [PubMed] [Google Scholar]
- 17.Perry GH, et al. 2006. Hotspots for copy number variation in chimpanzees and humans. Proc. Natl Acad. Sci. USA 103, 8006-8011. ( 10.1073/pnas.0602318103) [DOI] [PMC free article] [PubMed] [Google Scholar]
- 18.Egan C, Sridhar S, Wigler M, Hall I. 2007. Recurrent DNA copy number variation in the laboratory mouse. Nat. Genet. 39, 1384-1389. ( 10.1038/ng.2007.19) [DOI] [PubMed] [Google Scholar]
- 19.Brown KH, et al. 2012. Extensive genetic diversity and substructuring among zebrafish strains revealed through copy number variant analysis. Proc. Natl Acad. Sci. USA 109, 529-534. ( 10.1073/pnas.1112163109) [DOI] [PMC free article] [PubMed] [Google Scholar]
- 20.Frédéric JJ, Evans BJ. 2006. Multiple mechanisms promote the retained expression of gene duplicates in the tetraploid frog Xenopus laevis. PLoS Genet. 2, e56. ( 10.1371/journal.pgen.0020056) [DOI] [PMC free article] [PubMed] [Google Scholar]
- 21.Gamazon ER, Stranger BE. 2015. The impact of human copy number variation on gene expression. Brief Funct. Genomics 14, 352-357. ( 10.1093/bfgp/elv017) [DOI] [PMC free article] [PubMed] [Google Scholar]
- 22.He Y, Hoskins JM, McLeod HL. 2011. Copy number variants in pharmacogenetic genes. Trends Mol. Med. 17, 244-251. ( 10.1016/j.molmed.2011.01.007) [DOI] [PMC free article] [PubMed] [Google Scholar]
- 23.Relling MV, Evans WE. 2015. Pharmacogenomics in the clinic. Nature. 526, 343-350. ( 10.1038/nature15817) [DOI] [PMC free article] [PubMed] [Google Scholar]
- 24.Bickhart DM, et al. 2016. Diversity and population – genetic properties of copy number variations and multicopy genes in cattle. DNA Res. 23, 253-262. ( 10.1093/dnares/dsw013) [DOI] [PMC free article] [PubMed] [Google Scholar]
- 25.Kono T, Brohammer A, Suzanne M, Hirsch C. 2018. Tandem duplicate genes in maize are abundant and date to two distinct periods of time. G3 Genes Genomes Genetics 8, 3049-3058. ( 10.1534/g3.118.200580) [DOI] [PMC free article] [PubMed] [Google Scholar]
- 26.Faber-Hammond JJ, Bezault E, Lunt DH, Joyce DA, Renn SCP. 2019. The genomic substrate for adaptive radiation: copy number variation across 12 tribes of African cichlid species. Genome Biol. Evol. 11, 2856-2874. ( 10.1093/gbe/evz185) [DOI] [PMC free article] [PubMed] [Google Scholar]
- 27.Tollis M, Robbins J, Webb AE. 2019. Return to the sea, get huge, beat cancer: an analysis of cetacean genomes including an assembly for the humpback whale (Megaptera novaeangliae). Mol. Biol. 36, 1746-1763. ( 10.1093/molbev/msz099) [DOI] [PMC free article] [PubMed] [Google Scholar]
- 28.Reid NM, et al. 2017. The landscape of extreme genomic variation in the highly adaptable Atlantic killifish. Genome Biol. Evol. 9, 659-676. ( 10.1093/gbe/evx023) [DOI] [PMC free article] [PubMed] [Google Scholar]
- 29.Chain FJJJ, et al. 2014. Extensive copy-number variation of young genes across stickleback populations. PLoS Genet. 10, e1004830. ( 10.1371/journal.pgen.1004830) [DOI] [PMC free article] [PubMed] [Google Scholar]
- 30.Prunier J, Caron S, Lamothe M, Blais S, Bousquet J, Isabel N, Mackay J. 2017. Gene copy number variations in adaptive evolution: the genomic distribution of gene copy number variations revealed by genetic mapping and their adaptive role in an undomesticated species, white spruce (Picea glauca). Mol. Ecol. 26, 5989-6001. ( 10.1111/mec.14337) [DOI] [PubMed] [Google Scholar]
- 31.Chapman RW, et al. 2011. The transcriptomic responses of the eastern oyster, Crassostrea virginica, to environmental conditions. Mol. Ecol. 20, 1431-1449. ( 10.1111/j.1365-294X.2011.05018.x) [DOI] [PubMed] [Google Scholar]
- 32.Pollack JB, Kim H-C, Morgan EK, Montagna PA. 2011. Role of flood disturbance in natural oyster (Crassostrea virginica) population maintenance in an estuary in South Texas, USA. Estuar. Coast. 34, 187-197. ( 10.1007/s12237-010-9338-6) [DOI] [Google Scholar]
- 33.La Peyre MK, Eberline BS, Soniat TM, La Peyre JF. 2013. Differences in extreme low salinity timing and duration differentially affect eastern oyster (Crassostrea virginica) size class growth and mortality in Breton Sound, LA. Estuar. Coast Shelf Sci. 135, 146-157. ( 10.1016/j.ecss.2013.10.001) [DOI] [Google Scholar]
- 34.Breitburg DL, Hondorp D, Audemard C, Carnegie RB, Burrell RB, Trice M, Clark V. 2015. Landscape-level variation in disease susceptibility related to shallow-water hypoxia. PLoS ONE 10, e0116223. ( 10.1371/journal.pone.0116223) [DOI] [PMC free article] [PubMed] [Google Scholar]
- 35.Zhang L, Li L, Guo X, Litman GW, Dishaw LJ, Zhang G. 2015. Massive expansion and functional divergence of innate immune genes in a protostome. Sci. Rep. 5, srep08693. ( 10.1038/srep08693) [DOI] [PMC free article] [PubMed] [Google Scholar]
- 36.McDowell IC, Modak TH, Lane CE, Gomez-Chiarri M. 2016. Multi-species protein similarity clustering reveals novel expanded immune gene families in the eastern oyster Crassostrea virginica. Fish Shellfish Immunol. 53, 13-23. ( 10.1016/j.fsi.2016.03.157) [DOI] [PubMed] [Google Scholar]
- 37.Gerdol M, et al. 2020. Massive gene presence/absence variation in the mussel genome as an adaptive strategy: first evidence of a pan-genome in Metazoa. bioRxiv2019, 781377. [cited 2020 Apr 27]. ( 10.1101/781377) [DOI]
- 38.Gerdol M, Greco S, Pallavicini A. 2019. Extensive tandem duplication events drive the expansion of the C1q-domain-containing gene family in Bivalves. Mar. Drugs 17, 583. ( 10.3390/md17100583) [DOI] [PMC free article] [PubMed] [Google Scholar]
- 39.Zhang L, Guo X. 2010. Development and validation of single nucleotide polymorphism markers in the eastern oyster Crassostrea virginica Gmelin by mining ESTs and resequencing. Aquaculture 302, 124-129. ( 10.1016/j.aquaculture.2010.02.012) [DOI] [Google Scholar]
- 40.Hedgecock D, Gaffney PM, Goulletquer P, Guo X, Reece K, Warr GW. 2005. The case for sequencing the pacific oyster genome. J. Shellfish Res. 24, 429-441. ( 10.2983/0730-8000(2005)24[429:TCFSTP]2.0.CO;2) [DOI] [Google Scholar]
- 41.Ford SE, Haskin HH. 1987. Infection and mortality patterns in strains of oysters Crassostrea virginica selected for resistance to the parasite Haplosporidium nelsoni (MSX). J. Parasitol. 73, 368-376. ( 10.2307/3282092) [DOI] [PubMed] [Google Scholar]
- 42.Puritz JB, Hollenbeck CM, Gold JR. 2014. dDocent: a RADseq, variant-calling pipeline designed for population genomics of non-model organisms. PeerJ 2, e431. ( 10.7717/peerj.431) [DOI] [PMC free article] [PubMed] [Google Scholar]
- 43.Bolger AM, Lohse M, Usadel B. 2014. Trimmomatic: a flexible trimmer for Illumina sequence data. Bioinformatics 30, 2114-2120. ( 10.1093/bioinformatics/btu170) [DOI] [PMC free article] [PubMed] [Google Scholar]
- 44.Li H, Durbin R. 2010. Fast and accurate long-read alignment with Burrows–Wheeler transform. Bioinformatics 26, 589-595. ( 10.1093/bioinformatics/btp698) [DOI] [PMC free article] [PubMed] [Google Scholar]
- 45.Picard Toolkit [Internet]. 2019 Available from: http://broadinstitute.github.io/picard/.
- 46.Li H, Handsaker B, Wysoker A, Fennell T, Ruan J, Homer N, Marth G, Abecasis G, Durbin R. 2009. 1000 Genome Project Data Processing Subgroup, The Sequence Alignment/Map format and SAMtools. Bioinformatics 25, 2078-2079. ( 10.1093/bioinformatics/btp352) [DOI] [PMC free article] [PubMed] [Google Scholar]
- 47.Rausch T, Zichner T, Schlattl A, Stütz AM, Benes V, Korbel JO. 2012. DELLY: structural variant discovery by integrated paired-end and split-read analysis. Bioinformatics 28, i333-i339. ( 10.1093/bioinformatics/bts378) [DOI] [PMC free article] [PubMed] [Google Scholar]
- 48.Sudmant PH, et al. 2015. An integrated map of structural variation in 2504 human genomes. Nature 526, 75-81. ( 10.1038/nature15394) [DOI] [PMC free article] [PubMed] [Google Scholar]
- 49.Weissensteiner MH, et al. 2020. Discovery and population genomics of structural variation in a songbird genus. Nat. Commun. 11, 3403. ( 10.1038/s41467-020-17195-4) [DOI] [PMC free article] [PubMed] [Google Scholar]
- 50.Pinharanda A, Martin SH, Barker SL, Davey JW, Jiggins CD. 2017. The comparative landscape of duplications in Heliconius melpomene and Heliconius cydno. Heredity 118, 78-87. ( 10.1038/hdy.2016.107) [DOI] [PMC free article] [PubMed] [Google Scholar]
- 51.Kou Y, Liao Y, Toivainen T, Lv Y, Tian X, Emerson JJ, Gaut BS, Purugganan M. 2020. Evolutionary genomics of structural variation in Asian rice (Oryza sativa) domestication. Mol. Biol. Evol. 37, 3507-3524. ( 10.1093/molbev/msaa185) [DOI] [PMC free article] [PubMed] [Google Scholar]
- 52.Alonge M, et al. 2020. Major impacts of widespread structural variation on gene expression and crop improvement in tomato. Cell 182, 145-161.e23. ( 10.1016/j.cell.2020.05.021) [DOI] [PMC free article] [PubMed] [Google Scholar]
- 53.Pollard MO, Gurdasani D, Mentzer AJ, Porter T, Sandhu MS. 2018. Long reads: their purpose and place. Hum. Mol. Genet. 27, R234-R241. ( 10.1093/hmg/ddy177) [DOI] [PMC free article] [PubMed] [Google Scholar]
- 54.RStudio Team. 2016. RStudio: integrated development environment for R. Boston, MA: RStudio, Inc. See http://www.rstudio.com/. [Google Scholar]
- 55.R Core Team. 2017. R: a language and environment for statistical computing. Vienna, Austria: R Foundation for Statistical Computing. See https://www.R-project.org/. [Google Scholar]
- 56.Kelley DR, Salzberg SL. 2010. Detection and correction of false segmental duplications caused by genome mis-assembly. Genome Biol. 11, R28. ( 10.1186/gb-2010-11-3-r28) [DOI] [PMC free article] [PubMed] [Google Scholar]
- 57.Trost B, et al. 2018. A comprehensive workflow for read depth-based identification of copy-number variation from whole-genome sequence data. Am. J. Hum. Genet. 102, 142-155. ( 10.1016/j.ajhg.2017.12.007) [DOI] [PMC free article] [PubMed] [Google Scholar]
- 58.Smit AFA, Hubley R, Green P. RepeatMasker Open-4.0. 2013–2015 [Internet]. See http://www.repeatmasker.org.
- 59.Quinlan AR, Hall IM. 2010. BEDTools: a flexible suite of utilities for comparing genomic features. Bioinformatics 26, 841-842. ( 10.1093/bioinformatics/btq033) [DOI] [PMC free article] [PubMed] [Google Scholar]
- 60.Alexa A, Rahnenführer J, Lengauer T. 2006. Improved scoring of functional groups from gene expression data by decorrelating GO graph structure. Bioinformatics 22, 1600-1607. ( 10.1093/bioinformatics/btl140) [DOI] [PubMed] [Google Scholar]
- 61.Conrad D, et al. 2010. Origins and functional impact of copy number variation in the human genome. Nature 464, 704. ( 10.1038/nature08516) [DOI] [PMC free article] [PubMed] [Google Scholar]
- 62.Bickhart D, et al. 2012. Copy number variation of individual cattle genomes using next-generation sequencing. Genome Res. 22, 778-790. ( 10.1101/gr.133967.111) [DOI] [PMC free article] [PubMed] [Google Scholar]
- 63.Zarrei M, Jeffrey M, Merico D, Scherer S. 2015. A copy number variation map of the human genome. Nat. Rev. Genet. 16, 172-183. ( 10.1038/nrg3871) [DOI] [PubMed] [Google Scholar]
- 64.Nguyen D-Q, Webber C, Ponting C. 2006. Bias of selection on human copy-number variants. PLoS Genet. 2, e20. ( 10.1371/journal.pgen.0020020) [DOI] [PMC free article] [PubMed] [Google Scholar]
- 65.Zhao S, Gibbons JG. 2018. A population genomic characterization of copy number variation in the opportunistic fungal pathogen Aspergillus fumigatus. PLoS ONE 13, e0201611. ( 10.1371/journal.pone.0201611) [DOI] [PMC free article] [PubMed] [Google Scholar]
- 66.Cardoso AR, Oliveira M, Amorim A, Azevedo L. 2016. Major influence of repetitive elements on disease-associated copy number variants (CNVs). Hum. Genomics 10, 30. ( 10.1186/s40246-016-0088-9) [DOI] [PMC free article] [PubMed] [Google Scholar]
- 67.Galtsoff PS. 1964. The American oyster, Crassostrea virginica Gmelin. Washington, DC: US Government Printing Office. [Google Scholar]
- 68.Guo X, He Y, Zhang L, Lelong C, Jouaux A. 2015. Immune and stress responses in oysters with insights on adaptation. Fish Shellfish Immunol. 46, 107-119. ( 10.1016/j.fsi.2015.05.018) [DOI] [PubMed] [Google Scholar]
- 69.Hawkins JS, Grover CE, Wendel JF. 2008. Repeated big bangs and the expanding universe: directionality in plant genome size evolution. Plant Sci. 174, 557-562. ( 10.1016/j.plantsci.2008.03.015) [DOI] [Google Scholar]
- 70.Gregory TR. 2002. A bird's-eye view of the C-value enigma: genome size, cell size, and metabolic rate in the class Aves. Evolution 56, 121-130. ( 10.1111/j.0014-3820.2002.tb00854.x) [DOI] [PubMed] [Google Scholar]
- 71.Mueller RL, Jockusch EL. 2018. Jumping genomic gigantism. Nat Ecol. Evol. 2, 1687-1688. ( 10.1038/s41559-018-0703-3) [DOI] [PubMed] [Google Scholar]
- 72.Barrett RDH, Schluter D. 2008. Adaptation from standing genetic variation. Trends Ecol. Evol. 23, 38-44. ( 10.1016/j.tree.2007.09.008) [DOI] [PubMed] [Google Scholar]
- 73.Rosa R, Alonso P, Santini A, Vergnes A, Bachère E. 2015. High polymorphism in big defensin gene expression reveals presence–absence gene variability (PAV) in the oyster Crassostrea gigas. Dev. Comp. Immunol. 49, 231-238. ( 10.1016/j.dci.2014.12.002) [DOI] [PubMed] [Google Scholar]
- 74.Wang Y, et al. 2014. Exploration of presence/absence variation and corresponding polymorphic markers in soybean genome. J. Integr. Plant Biol. 56, 1009-1019. ( 10.1111/jipb.12208) [DOI] [PubMed] [Google Scholar]
- 75.Zhang L-M, Luo H, Liu Z-Q, Zhao Y, Luo J-C, Hao D-Y, Jing H-C. 2014. Genome-wide patterns of large-size presence/absence variants in sorghum. J. Integr. Plant Biol. 56, 24-37. ( 10.1111/jipb.12121) [DOI] [PubMed] [Google Scholar]
- 76.Feulner PGD, et al. 2013. Genome-wide patterns of standing genetic variation in a marine population of three-spined sticklebacks. Mol. Ecol. 22, 635-649. ( 10.1111/j.1365-294X.2012.05680.x) [DOI] [PubMed] [Google Scholar]
- 77.Pezer Ž, Harr B, Teschke M, Babiker H, Tautz D. 2015. Divergence patterns of genic copy number variation in natural populations of the house mouse (Mus musculus domesticus) reveal three conserved genes with major population-specific expansions. Genome Res. 25, 1114-1124. ( 10.1101/gr.187187.114) [DOI] [PMC free article] [PubMed] [Google Scholar]
- 78.Zhang G, et al. 2012. The oyster genome reveals stress adaptation and complexity of shell formation. Nature 490, 49-54. ( 10.1038/nature11413) [DOI] [PubMed] [Google Scholar]
- 79.Xue Y, et al. 2015. Mountain gorilla genomes reveal the impact of long-term population decline and inbreeding. Science 348, 242-245. ( 10.1126/science.aaa3952) [DOI] [PMC free article] [PubMed] [Google Scholar]
- 80.Watkins-Chow DE, Pavan WJ. 2008. Genomic copy number and expression variation within the C57BL/6 J inbred mouse strain. Genome Res. 18, 60-66. ( 10.1101/gr.6927808) [DOI] [PMC free article] [PubMed] [Google Scholar]
- 81.de Groot N, et al. 2017. A quick and robust MHC typing method for free-ranging and captive primate species. Immunogenetics 69, 231-240. ( 10.1007/s00251-016-0968-0) [DOI] [PMC free article] [PubMed] [Google Scholar]
- 82.Katju V, Bergthorsson U. 2013. Copy-number changes in evolution: rates, fitness effects and adaptive significance. Front Genet. 4, 273. ( 10.3389/fgene.2013.00273) [DOI] [PMC free article] [PubMed] [Google Scholar]
- 83.Conant GC, Wolfe KH. 2008. Turning a hobby into a job: how duplicated genes find new functions. Nat. Rev. Genet. 9, 938-950. ( 10.1038/nrg2482) [DOI] [PubMed] [Google Scholar]
- 84.Liu M, Guo X. 2017. A novel and stress adaptive alternative oxidase derived from alternative splicing of duplicated exon in oyster Crassostrea virginica. Sci. Rep. 7, 1-10. ( 10.1038/s41598-016-0028-x) [DOI] [PMC free article] [PubMed] [Google Scholar]
- 85.Guo X, Ford SE. 2016. Infectious diseases of marine molluscs and host responses as revealed by genomic tools. Phil. Trans. R. Soc. B 371, 20150206. ( 10.1098/rstb.2015.0206) [DOI] [PMC free article] [PubMed] [Google Scholar]
- 86.Bononi A, et al. 2011. Protein kinases and phosphatases in the control of cell fate. Enzyme Res. 2011, 329098. ( 10.4061/2011/329098) [DOI] [PMC free article] [PubMed] [Google Scholar]
- 87.Tonks NK. 2006. Protein tyrosine phosphatases: from genes, to function, to disease. Nat. Rev. Mol. Cell Biol. 7, 833-846. ( 10.1038/nrm2039) [DOI] [PubMed] [Google Scholar]
- 88.Hatfield MJ, Umans RA, Hyatt JL, Edwards CC, Wierdl M, Tsurkan L, Taylor MR, Potter PM. 2016. Carboxylesterases: general detoxifying enzymes. Chem. Biol. Interact. 259, 327-331. ( 10.1016/j.cbi.2016.02.011) [DOI] [PMC free article] [PubMed] [Google Scholar]
- 89.Espinosa E, Koller A, Allam B. 2016. Proteomic characterization of mucosal secretions in the eastern oyster, Crassostrea virginica . J. Proteomics 132, 63-76. ( 10.1016/j.jprot.2015.11.018) [DOI] [PubMed] [Google Scholar]
- 90.Brun NT, Ross NW, Boghen AD. 2000. Changes in the electrophoretic profiles of gill mucus proteases of the eastern oyster Crassostrea virginica in response to infection by the turbellarian Urastoma cyprinae. J. Invertebr. Pathol. 75, 163-170. ( 10.1006/jipa.1999.4917) [DOI] [PubMed] [Google Scholar]
- 91.Guryev V, et al. 2008. Distribution and functional impact of DNA copy number variation in the rat. Nat. Genet. 40, 538-545. ( 10.1038/ng.141) [DOI] [PubMed] [Google Scholar]
- 92.Guo X, Li C, Wang H, Xu Z. 2018. Diversity and evolution of living oysters. J. Shellfish Res. 37, 755-771. ( 10.2983/035.037.0407) [DOI] [Google Scholar]
- 93.Lin Y-L, Gokcumen O. 2019. Fine-scale characterization of genomic structural variation in the human genome reveals adaptive and biomedically relevant hotspots. Genome Biol. Evol. 11, evz058. ( 10.1101/294322) [DOI] [PMC free article] [PubMed] [Google Scholar]
- 94.Guo Y, Dai Y, Yu H, Zhao S, Samuels DC, Shyr Y. 2017. Improvements and impacts of GRCh38 human reference on high throughput sequencing data analysis. Genomics 109, 83-90. ( 10.1016/j.ygeno.2017.01.005) [DOI] [PubMed] [Google Scholar]
- 95.Food and Agriculture Organization of the United Nations. 2018. The State of World Fisheries and Aquaculture 2018: meeting the sustainable development goals. Rome, Italy: Fisheries and Aquaculture Department, Food and Agriculture Organization of the United Nations. [Google Scholar]
- 96.Newell RIE. 2004. Ecosystem influences of natural and cultivated populations of suspension-feeding bivalve molluscs: a review. J. Shellfish Res. 23, 51-62. [Google Scholar]
- 97.zu Ermgassen PSE, Spalding MD, Grizzle RE, Brumbaugh RD. 2013. Quantifying the loss of a marine ecosystem service: filtration by the eastern oyster in US Estuaries. Estuar. Coast. 36, 36-43. ( 10.1007/s12237-012-9559-y) [DOI] [Google Scholar]
- 98.Gómez-Chiarri M, Warren WC, Guo X, Proestou D. 2015. Developing tools for the study of molluscan immunity: the sequencing of the genome of the eastern oyster, Crassostrea virginica. Fish Shellfish Immunol. 46, 2-4. ( 10.1016/j.fsi.2015.05.004) [DOI] [PubMed] [Google Scholar]
- 99.Bai Z, Yuan Y, Yue G, Li J. 2011. Molecular cloning and copy number variation of a Ferritin Subunit (Fth1) and its association with growth in freshwater pearl mussel Hyriopsis cumingii. PLoS ONE 6, e22886. ( 10.1371/journal.pone.0022886) [DOI] [PMC free article] [PubMed] [Google Scholar]
- 100.Hollenbeck CM, Johnston IA. 2018. Genomic tools and selective breeding in molluscs. Front Genet. 9, 253. ( 10.3389/fgene.2018.00253) [DOI] [PMC free article] [PubMed] [Google Scholar]
Associated Data
This section collects any data citations, data availability statements, or supplementary materials included in this article.
Data Availability Statement
A repository with the complete bioinformatic workflow described in the paper can be accessed at https://github.com/tejashree1modak/Cvir-cnv.