
Figure 5. Downsampling mimics large field-of-view images.
(A) Original, high spatial and temporal resolution GCaMP6f image of an exemplar Cux2-f neuron. (B) 1 AP, 2 AP, and 3 AP traces for the same neuron. Thin lines, individual trials; thick line, mean. Dashed line, ΔF/F = 0. (C) Downsampled image of the same neuron. (D) Traces from the downsampled neuron. (E) Normalized distribution of baseline noise (robust standard deviation [rSTD]) for 48 downsampled neurons (red) and 11,816 layer 2/3 neurons from Emx1-f and Cux2-f mice in the Allen Brain Observatory (blue).
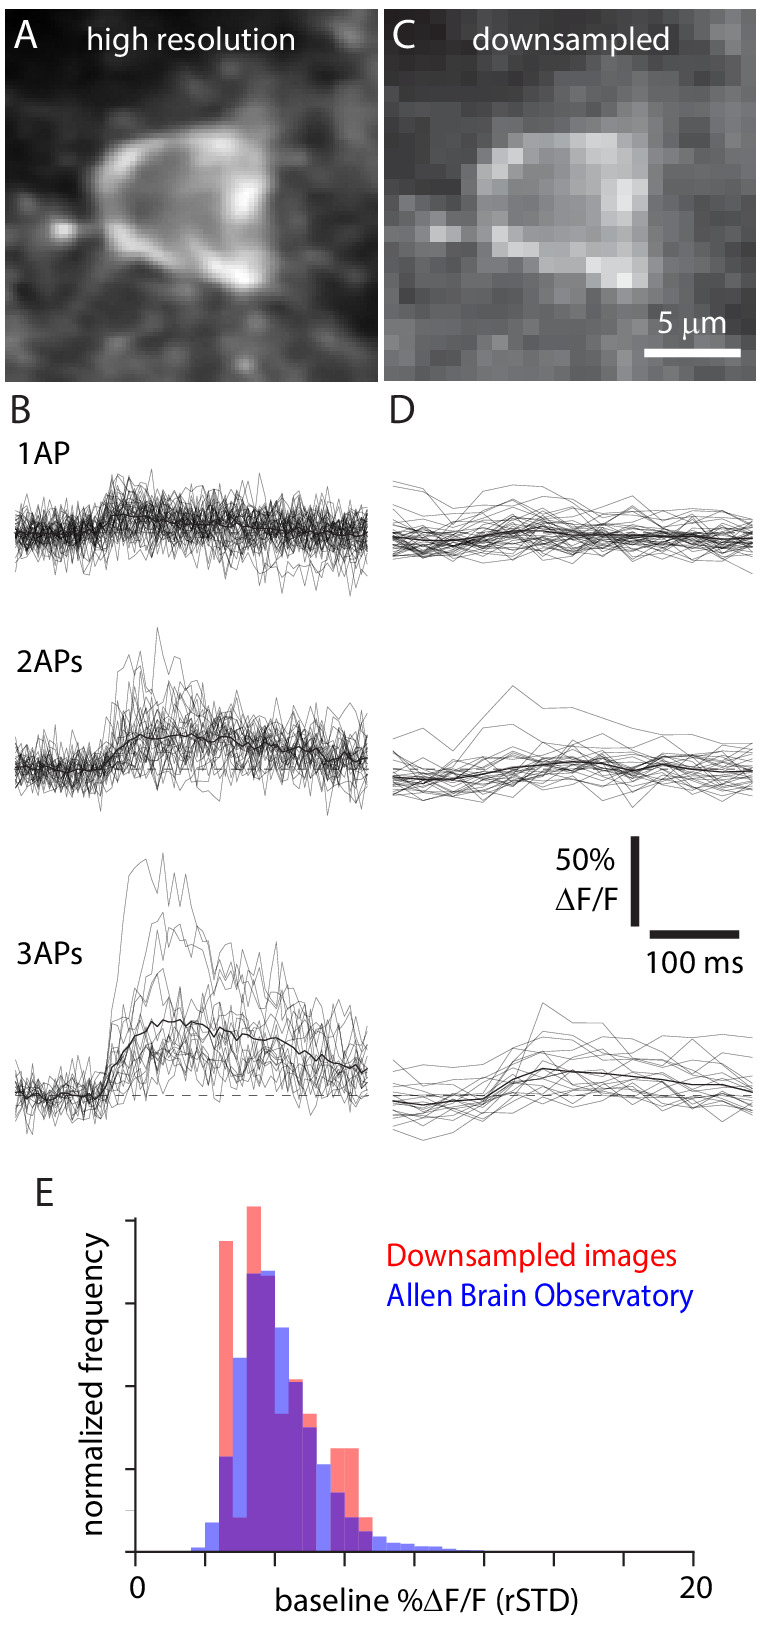
Figure 5—figure supplement 1. Example fluorescence traces from image quality control procedures, implemented during image downsampling.
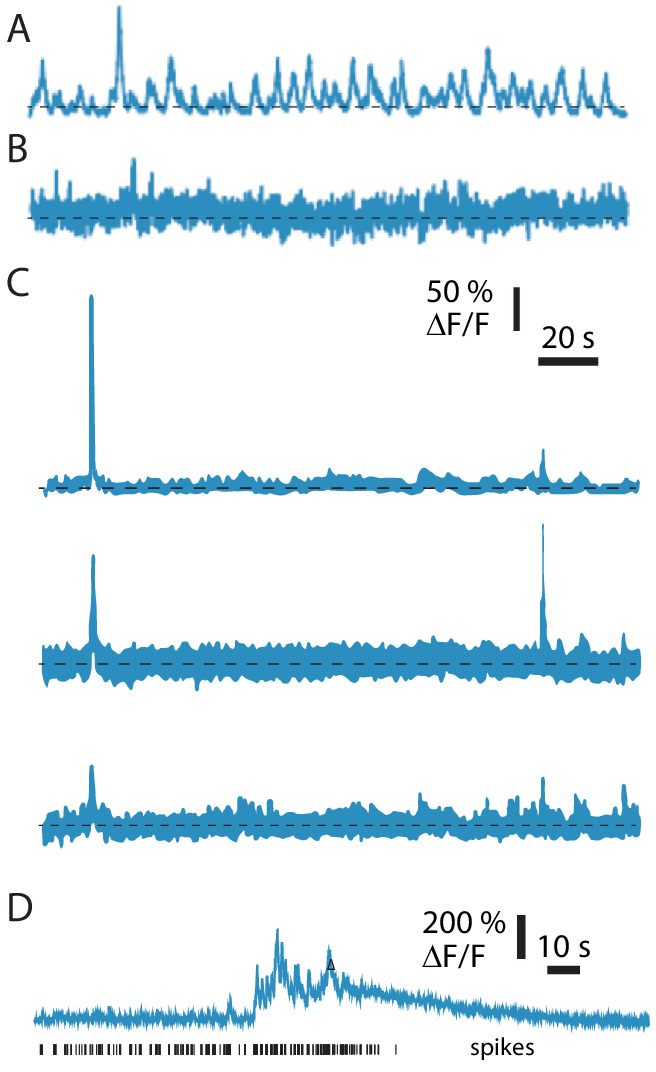
(A) Median of traces extracted from an example segmentation in which only the neuron of interest was found in each image during segmentation. The trace is significantly different from noise (KS test, p=1.8×10−40). (B) Median of traces extracted from an example segmentation in which only the neuron of interest was found in each image during segmentation. The trace is not significantly different from noise (KS test, p=0.072). (C) Medians of traces extracted from an example segmentation in which three regions of interest were identified. Each trace is significantly different from noise (KS tests, p=7.7×10−152, 1.6 × 10⁻¹⁹, 2.2 × 10⁻²⁵). The sum of these three cluster medians had the highest correlation with the firing rate and was therefore used as the ΔF/F trace for this recording in the dataset. Scale bars apply to A–C. (D) Example fluorescence trace with an abrupt and sustained rise in fluorescence and in spike rate and subsequent loss of spiking activity. This neuron was manually removed from the dataset.