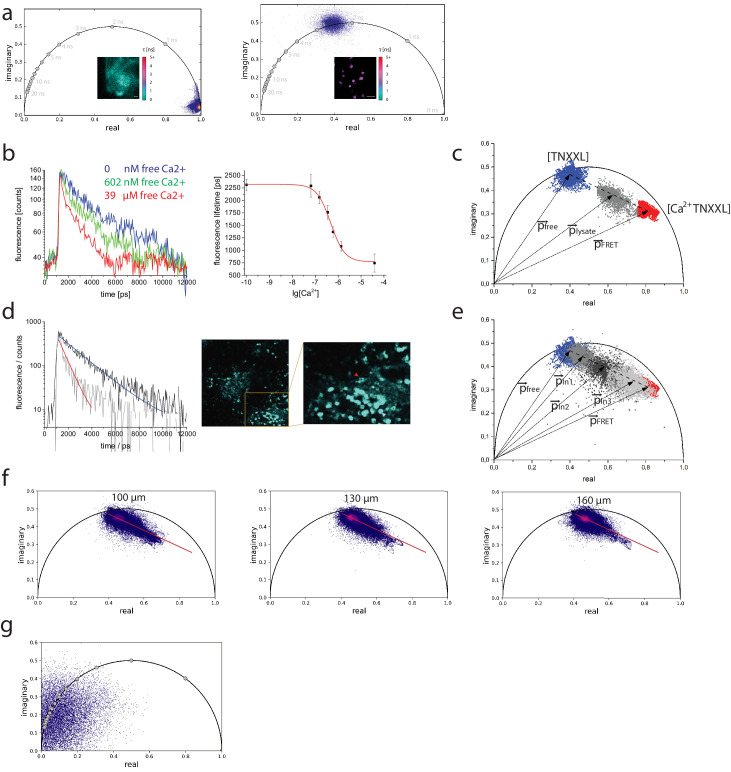
Figure 4. Calibration of the TN-XXL construct using fluorescence lifetime imaging of its Förster resonance energy transfer donor.
(a) Left panel: phasor plot of second harmonic generation signal of potassium dihydrogen phosphate crystals and lifetime image (inset, scale in picoseconds) corresponding to the instrument response function (τ = 80 ± 10 ps). λexc = 940 nm, λdetection = 466±20 nm. Right panel: phasor plot of GFP fluorescence expressed in HEK cells and fluorescence lifetime image (inset, the same scale as in the left panel), corresponding to mono-exponential decay GFP fluorescence (τ = 2500 ± 100 ps). λexc = 900 nm, λdetection = 525±25 nm. (b) Left panel: fluorescence decays of CFP in TN-XXL construct from lysates of B lymphocytes at 0 nM, 602 nM, and 39 µM free calcium. Right panel: titration curve of TN-XXL resulting from the time-domain evaluation of decay curves as shown in the left panel (three independent experiments). λexc = 850 nm, λdetection = 466±20 nm. (c) Phasor plot of representative data shown in (b) – time-resolved fluorescence images 422 × 422 pixels (200 × 200 µm²); time-bin = 55 ps; time window = 12.4 ns. Blue phasor cloud (with central phase vector free) corresponds to 0 nM free calcium, gray cloud (with central phase vector lysate) to 602 nM free calcium, and red cloud (with central phase vector FRET) to 39 µM free calcium. The dotted line connects the centers of the blue and red clouds, respectively, whereas the gray cloud is located on this line. The dotted line corresponds to the calibration segment as it results from measurements of TN-XXL in cell lysates. (d) Left panel: representative fluorescence decays of eCFP in two B lymphocytes (indicated by red and blue arrowheads in the inset image, right panel) expressing TN-XXL in the medullary cords of a popliteal lymph node of a YellowCaB mouse (right panel) and corresponding mono-exponential fitting curves (red fitting curve: τ = 703 ± 56 ps; blue fitting curve: τ = 1937 ± 49 ps). We measured τ = 2303 ± 53 ps in splenocytes expressing only CFP. (e) Phasor plot showing time-resolved CFP fluorescence data from three lymph nodes, in three YellowCaB mice (light gray – with central phase vector ln3, gray – with central phase vector p ln1, and dark gray – with central phase vector ln2) – time-resolved fluorescence images 505 × 505 pixels (512 × 512 µm²); time-bin = 55 ps; time window = 12.4 ns. Additionally, the calibration segment (dotted line) and the phasor clouds measured in lysates of B lymphocytes expressing TN-XXL at 0 nM and 39 µM free calcium from (c) are displayed. (f) Phasor plots of the CFP fluorescence (time-resolved fluorescence images 505 × 505 pixels / 512 × 512 µm²) acquired at three different depths (100, 130, and 160 µm from the organ capsule surface) in the popliteal lymph node of a YellowCaB mouse. The red line in each phasor plot represents the calibration segment also displayed in (c) and (e). (g) Phasor plot of signal acquired in the lymph node of a non-fluorescent mouse. λexc = 850 nm, λdetection = 466±20 nm.
Figure 4—figure supplement 1. Phasor plot showing time-resolved CFP fluorescence data of B lymphocytes from YellowCaB mice in culture (gray cloud – with central phase vector Bcells) – time-resolved fluorescence images 471 × 471 pixels (250 × 250 µm²); time-bin = 55 ps; time window = 12.4 ns.


