

Abstract
Objectives
We aimed at the high-resolution examination of the oral microbiome depending on oil pulling, compared it with saline pulling, and analyzed whether the method is capable of reducing the overall microbial burden of the oral cavity.
Materials and methods
The study was a cohort study with three healthy subjects. Oil pulling samples, saline pulling samples, and saliva samples were microscoped and cultured under microaerophilic and anaerobic conditions; colony-forming units were counted; and cultivated bacteria were identified employing MALDI-TOF MS. The oral microbiomes (saliva) and the microbiota incorporated in oil and saline pulling samples were determined in toto by using 16S rDNA next-generation sequencing (NGS) and bioinformatics.
Results
Microscopy revealed that oral epithelial cells are ensheathed with distinct oil droplets during oil pulling. Oil pulling induced a higher production of saliva and the oil/saliva emulsion contained more bacteria than saline pulling samples. Oil pulling resulted in a significant and transient reduction of the overall microbial burden in comparison to saliva examined prior to and after pulling. Both oil and saline pulling samples mirrored the individual oral microbiomes in saliva.
Conclusions
Within the limitations of this pilot study, it might be concluded that oil pulling is able to reduce the overall microbial burden of the oral cavity transiently and the microbiota in oil pulling samples are representative to the oral microbiome.
Clinical relevance
Within the limitations of this pilot study, it might be concluded that oil pulling can be considered as an enlargement of standard oral hygiene techniques since it has the characteristic of an oral massage, enwrapping epithelial cells carrying bacteria in oil vesicles and reaching almost all unique habitats in oral cavity.
Keywords: Oil pulling, Sunflower oil, Oral microbiome, Inflammation, Infection, Biofilm
Introduction
The oral cavity is a very complex space of the human body providing unique habitats for microbial colonization comprising buccal and vestibular mucosa, lips, cheek, palate, tongue, and natural (teeth) and artificial solid surfaces (dental materials). Saliva baths the oral tissues and fluctuations in oral parameters such as temperature, oxygen availability, pH, and variability in the composition and frequency of exposure to dietary constituents occur and result in a highly diversified oral environment. The characteristic of the oral cavity is the special balanced contention between bacterial colonization and the often broken barrier between bone and environment (periodontitis, dental implants, traumata) both by the influence of the immune system and saliva which contains IgA, lactoferrin, lysozyme, growth factors, and cellular defense mechanisms [1–3].
Although the oral microbiome is in principle composed of bacteria, viruses, fungi, archaea, and protozoa, the predominant microorganisms are bacteria. Members of the bacterial microbiota are mainly responsible for local and distant-site infections, in particular in the case of poor oral hygiene. Local infections encompass caries, gingivitis, and periodontitis [4, 5]. Distant-site infections can appear as acute infections such as bacteremia or even sepsis [6], as infective endocarditis [7], idiopathic arthritis [8], atherosclerosis and chronic inflammation [9, 10], and stroke [11]. Additionally, women with periodontitis show a higher prevalence of preterm low birth weight infants [9, 12].
In order to reduce the microbial burden of the oral cavity and to avoid or to minimize the abovementioned infectious diseases, people are engaged in regular oral hygiene practices, typically consisting of brushing with toothpastes, utilizing dental floss, and/or rinsing with mouthwashes. A crucial point is the capacity of bacteria to form polymicrobial biofilms since their removal requires typically mechanical techniques and preventive strategies to limit oral dysbiosis [1, 3, 13, 14].
“Oil pulling” or “oil swishing” is part of Ayurveda, a holistic system of medicine, which evolved in India and which is now practiced in other parts of the world as a form of complementary and alternative medicine. It is a procedure that involves swishing oil (in general sunflower or sesame oil, rarely coconut oil) in the mouth for oral and systemic health benefits. Occasionally, these oils are enriched with natural products such as herbs or etherous ingredients and are not standardized. Oil pulling has been used to prevent tooth decay, oral malodor, bleeding gums, dryness of throat, cracked lips, and for strengthening teeth, gums, and the jaw. In particular in cases of mouth ulcer or oral cancer, where teeth’s brushing is impeded, oil pulling can be used to clean the oral cavity. Therefore, it is a specialized technique to treat as well as to prevent oral diseases [15, 16]. Miscellaneous studies, including randomized clinical trials, have been performed counting bacterial colonies, calculating the amount of Streptococcus mutans, and assessing plaque and gingival index [17–22], but the studies were not standardized with regard to oil, volume, and duration of pulling. Therefore, the results are still controversial.
We aimed at the high-resolution taxonomic examination of the oral microbiome prior to and after oil pulling and compared it with saline pulling. Furthermore, we analyzed whether oil and saline pulling are able to reduce the overall microbial burden of the oral cavity and determined the appropriate volume of oil and duration for oil pulling.
Materials and methods
Subjects
The study was done with the encouragement of three healthy subjects, all nonsmoker and omnivore: subject A: male; subject B: male; subject C: female. They were Germans and local residents. All of the participants were able to pull with sunflower seed oil and saline (0.9% NaCl) and were part of the laboratory team in order to ensure continuity and immediate sample processing. Written informed consent was obtained from the individuals for publication of this study and any accompanying images. The study was approved by the Ethics Board of the Justus-Liebig-University of Giessen (reference number: AZ 97/16).
Procedure of pulling
The study lasted 16 consecutive days and was separated into three parts (Fig. 1): pulling with saline (0.9% NaCl = negative control) for 3 days, intermission of 6 days, pulling with oil (sunflower seed oil) for 3 days. The pulling substances had a volume of 15 ml and were provided in 50-ml tubes (Eppendorf, Hamburg, Germany). The pulling lasted 15 min and was done in the morning between 6 and 7 o’clock: after getting up and before oral hygiene and/or breakfast. After 15 min of pulling, the mixture of saline/saliva and the mixture of oil/saliva were collected in the same tube, respectively. Prior to and 5 min after pulling, the saliva produced within 5 min was collected in separate 50-ml tubes (Eppendorf, Hamburg, Germany). In total, 22 samples were collected for each subject (Table 1), altogether 66 for the three subjects.
Fig. 1.

Pulling with saline and sunflower seed oil. a Pulling scheme. The study was separated into three parts: pulling with saline (0.9% NaCl), intermission, and pulling with oil (sunflower seed oil). b Saliva production due to saline pulling (blue) and oil pulling (yellow)
Table 1.
Overview of the samples (n = 22) collected for analysis per subject
| Data point no. | Day | Sample |
|---|---|---|
| 01 | 01 | Saliva |
| 02 | 02 | Saliva prior to pulling |
| 03 | 02 | Saline pulling (day 1) |
| 04 | 02 | Saliva after pulling |
| 05 | 03 | Saliva prior to pulling |
| 06 | 03 | Saline pulling (day 2) |
| 07 | 03 | Saliva after pulling |
| 08 | 04 | Saliva prior to pulling |
| 09 | 04 | Saline pulling (day 3) |
| 10 | 04 | Saliva after pulling |
| 11 | 05 | Saliva |
| 12 | 12 | Saliva prior to pulling |
| 13 | 12 | Oil pulling (day 1) |
| 14 | 12 | Saliva after pulling |
| 15 | 13 | Saliva prior to pulling |
| 16 | 13 | Oil pulling (day 2) |
| 17 | 13 | Saliva after pulling |
| 18 | 14 | Saliva prior to pulling |
| 19 | 14 | Oil pulling (day 3) |
| 20 | 14 | Saliva after pulling |
| 21 | 15 | Saliva |
| 22 | 16 | Saliva |
Sunflower seed oil used
The sunflower seed oil Oleum Helianthi raffinatum (article number 7309) distributed by company Caelo (Hilden, Germany) under CAS number 8001-21-6 and EG number 232-273-9 was used. It is a concoction of 16:0 palmitic acid (4–9%), 18:0 stearic acid (1–7%), 18:1 oleic acid (14–40%), and 18:2 linoleic acid (48–74%). This commercially available oil is standardized; free of herbs, ethereous, or other ingredients; and certified. Standardization and commercial availability are important in order to compare studies.
Staining and microscopy
For microscopic analysis, samples of saliva, saline, and oil pulling were stained with Giemsa (Merck, Darmstadt, Germany). Therefore, the samples were diluted 1:4 (50 μl Giemsa stain:150 μl sample) and 20 μl of each dilution was transferred on a slide and covered with a cover slip. The samples were examined with the Biozero BZ 8000 microscope (Keyence, Neu-Isenburg, Germany) and recorded.
Bacterial culture and identification by MALDI-TOF MS
One-hundred microliter of each sample was streaked on sheep blood, MacConkey, chocolate, Sabouraud, and Schaedler agar plates. The latter ones were incubated anaerobically at 37 °C for 5 days, the others in 5% CO2 atmosphere at 37 °C for 48 h. In order to determine the amount of bacteria in each sample, serial dilutions were done with 0.9% NaCl, plated on sheep blood agar plates, and incubated at 37 °C and 5% CO2 for 48 h. Colony-forming units (CFU) were counted and bacteria were identified by using MALDI-TOF MS: matrix-assisted laser desorption ionization time of flight mass spectrometry [23].
Nucleic acid extraction of samples, library construction, and 16S rDNA next-generation sequencing
For nucleic acid extraction, the following samples have been used: saliva (1.5 ml), saline/saliva mixture (1.5 ml), oil/saliva mixture (1.5 ml), saline/mock community mixture (1.3 ml/0.2 ml = 1.5 ml), oil/mock community mixture (1.3 ml/0.2 ml = 1.5 ml). In order to examine the potential bacterial background in the solutions used, negative controls of water (1.5 ml), saline (1.5 ml), and oil (1.5 ml) have been used.
Samples were centrifuged in 1.5-ml Eppendorf tubes (13,000 rpm, 10 min) and DNA from the bacterial pellets was extracted by using glass beads and the Power Lyzer DNA Isolation Kit from MoBio as recommended by the vendor (MoBio Laboratories, Carlsbad, CA, USA). The supernatants from the samples containing oil appeared as an emulsion of an oleaginous and an aqueous phase. These mixtures were treated with a solution of phenol/chloroform:isoamyl ethanol to remove oleaginous phase and DNA was precipitated with salt and ethanol. DNA of all samples was resuspended in 100 μl of nuclease-free water and concentration was determined using Qubit Fluorometric Quantitation (Thermo Fisher Scientific, Waltham, MA, USA). In order to examine the entire oil/saliva samples, DNA from pellets and DNA from supernatants were mixed in proportions of 4:1 and similar amounts of saline/saliva samples with water (4:1) to achieve the same dilution factor. The V4 region of 16S rRNA gene was amplified using adapter forward primer 5′-TCGTCGGCAGCGTCAGATGTGTATAAGAGACAGGTGCCAGCMGCCGCGGTAA-3′, adapter reverse primer 5′-GTCTCGTGGGCTCGGAGATGTGTATAAGAGACAGGGACTACHVGGGTWTCTAAT-3′, and the 2× Kapa HiFi HotStart Ready Mix (Kapa Biosystems, Wilmington, MA, USA). Amplification profile comprised an initial heating step at 95 °C for 3 min, 25 cycles of denaturation at 95 °C for 30 s, annealing at 55 °C for 30 s, elongation at 72 °C for 30 s, and a final elongation step at 72 °C for 5 min. PCR products were purified with Agencourt AMPure XP system as recommended by the vendor (Beckman Coulter, Brea, CA, USA). Size, purity, and concentration of amplicons were determined using the Agilent Bioanalyzer as recommended by the vendor (Agilent Technologies, Santa Clara, CA, USA). The index PCR was done by using the Nextera index Kit v2 Set B as recommended by the vendor (Illumina, San Diego, CA, USA). The quality of the index PCR has been determined as described above for the adapter PCR. The library was adjusted to 3 pM, the flow cell was prepared and loaded according to the Reagent Preparation Guide of MiSeq Reagent Kit v2 as recommended by the vendor (Illumina), and the MiSeq sequencing machine was started for sequencing.
Mock community
The mock community served as the positive control and was a composition of 14 Gram-positive and Gram-negative rods and cocci, considering morphologies and structure of cell walls (Table 2). The bacteria were cultured in appropriate media and each strain had a final concentration of ~ 1 × 10⁸/ml, altogether ~ 1–2 × 10⁹/ml.
Table 2.
Mock community
| No. | Morphology | Bacterium | Strain designation |
|---|---|---|---|
| 01 | Gram-positive rod | Bacillus cereus 13 | DSM 31 |
| 02 | Gram-positive rod | Lactobacillus delbrueckii #22 | DSM 103825 |
| 03 | Gram-positive rod | Listeria monocytogenes EGDe | EDCC 2100 |
| 04 | Gram-positive rod | Propionibacterium acnes KPA 171202 | DSM 16379 |
| 05 | Gram-positive coccus | Enterococcus faecalis Symbioflor 1 | DSM 16431 |
| 06 | Gram-positive coccus | Staphylococcus aureus DFS 42 | EDCC 5430 |
| 07 | Gram-positive coccus | Streptococcus agalactiae G 19 | DSM 2134 |
| 08 | Gram-positive coccus | Streptococcus pneumoniae TIGR 4 | EDCC 5501 |
| 09 | Gram-negative rod | Acinetobacter baumannii 65 | EDCC 5502 |
| 10 | Gram-negative rod | Escherichia coli MG 1655 | DSM 18039 |
| 11 | Gram-negative rod | Porphyromonas gingivalis W 83 | EDCC 5503 |
| 12 | Gram-negative rod | Pseudomonas aeruginosa PAO1 | DSM 19880 |
| 13 | Gram-negative coccus | Moraxella catarrhalis | DSM 9143 |
| 14 | Gram-negative coccus | Neisseria meningitidis 21 | DSM 10036 |
DSM German collection of microorganisms, EDCC Eugen Domann Culture Collection
Bioinformatics
MiSeq reporter software was used to split the sequences by barcode and to generate the fastq files [24]. After quality control with FastQC [25], paired end reads were joined and primer sequences were removed with PANDAseq [26]. Filtering was done for the calculated amplicon length and reads with ambiguous base calls or with homopolymers longer than eight nucleotides were removed. Microbiomic analysis was done by using QIIME [27]. The operational taxonomic units (OTU) were analyzed with uclust [28] using the Greengenes database [29] as reference with a similarity of 97%. For each OTU, a representative sequence was chosen and aligned with PyNAST [30] using the Greengenes core reference alignment [29]. Chimeric sequences were removed by using ChimeraSlayer [31]. Taxonomic assignment was done with the uclust consensus taxonomy assigner and the Greengenes database as taxonomy reference [32]. A phylogenetic tree was created using FastTree [33]. Alpha and beta diversity analysis and taxa summary plots were generated using QIIME core diversity analysis script. The principal coordinates analysis (PCoA) plots were visualized using EMPeror [34].
Statistical analysis
Statistical analysis has been done with MS Excel version 14.0.7177.5000.
Results
Oil pulling induced higher production of saliva than pulling with saline
The study lasted 16 consecutive days and was separated into three parts: pulling with saline (0.9% NaCl) for 3 days, intermission of 6 days, pulling with oil (sunflower seed oil) for 3 days (Fig. 1a; Table 1). The collected volume of saliva alone within 5 min was constantly ~ 2–3 ml. Both saline pulling and oil pulling induced production of saliva resulting in a concoction of saline/saliva and oil/saliva. The production of saliva due to oil pulling was—apart from subject A: day 2, oil pulling (Fig. 1b; sample 16 in Table 1)—always higher than due to saline pulling (Fig. 1b).
Phenotypes of oral epithelial cells derived from saliva, saline pulling, and oil pulling samples were significantly different
Saliva, saline pulling, and oil pulling samples were stained with Giemsa and examined under a microscope. The phenotypes of oral epithelial cells derived from the three sample types were significantly different: saliva samples showed loads of protein aggregates (white arrow heads) around epithelial cells (Fig. 2a) which were barely visible in saline pulling samples (Fig. 2b) and oil pulling samples (Fig. 2c). Additionally, the latter ones showed loads of oil droplets (yellow arrow heads). Microscopy showed that all of the epithelial cells were surrounded by bacteria (magenta arrow heads). The saline/saliva samples were fluid, whereas the oil/saliva samples had the character of an emulsion.
Fig. 2.
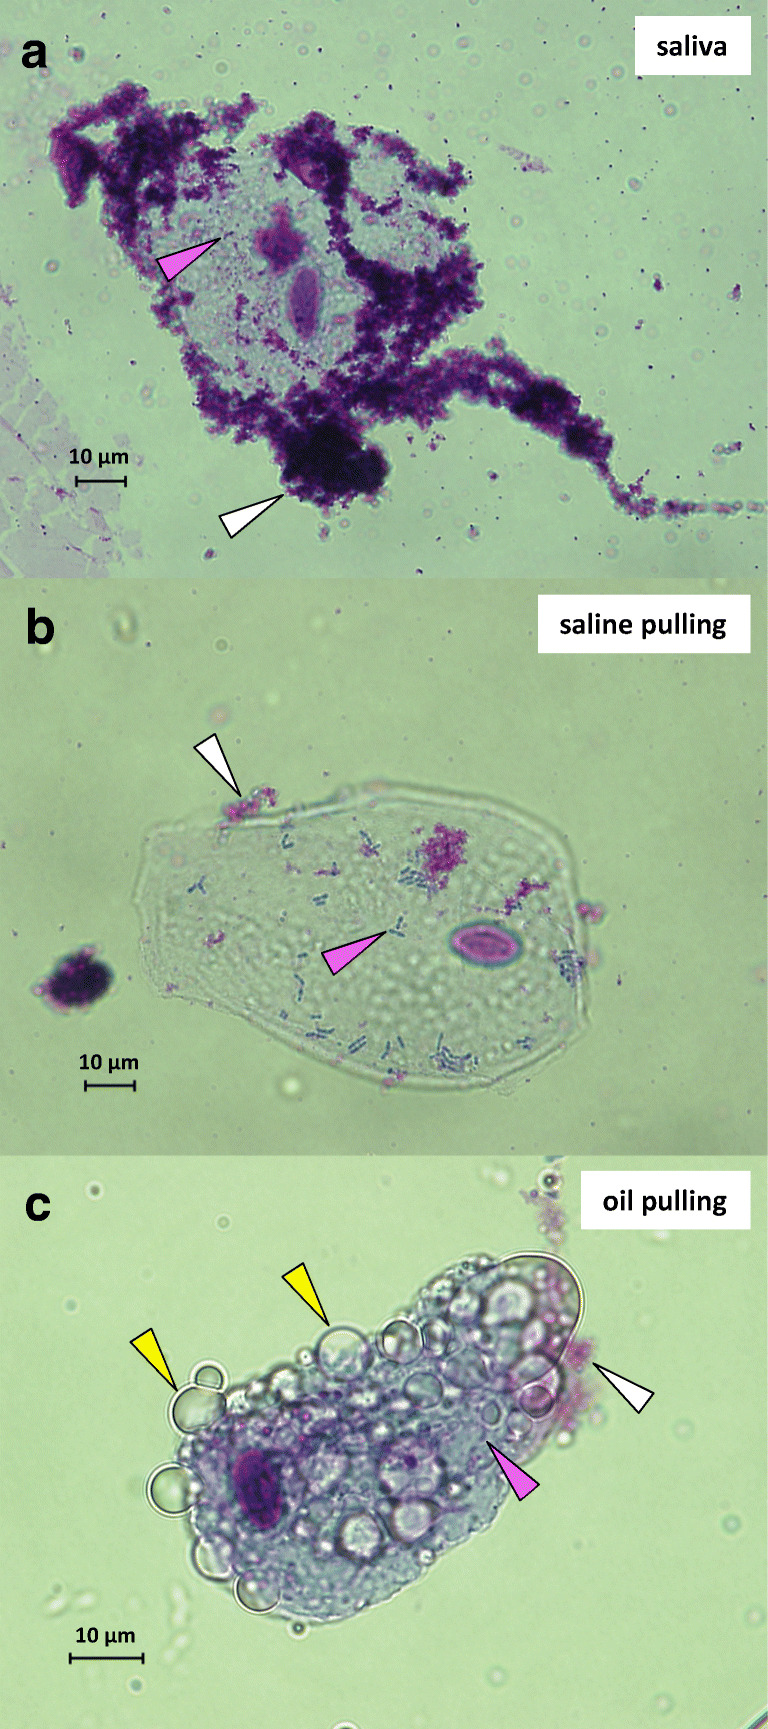
Giemsa staining and microscopy of oral epithelial cells. Cells shown are representative and derived from subject B. a Saliva sample. b Saline pulling sample. c Oil pulling sample. White arrow heads indicate protein aggregates, magenta arrow heads bacteria, and yellow arrow heads oil droplets. Magnification × 60; bars indicate 10 μm
Oil/saliva concoction contained more bacteria than concoction of saline/saliva
Determination of the total amount of cultivable bacteria in samples of saline pulling (Fig. 3, blue bars) and oil pulling (Fig. 3, yellow bars) revealed a significant higher amount of bacteria for oil pulling (Fig. 3). One exception was a sample from subject C: day 1, oil pulling (Fig. 3; sample 13 in Table 1).
Fig. 3.

Determination of the total colony-forming units (CFU) of saline pulling samples (blue: numbers 03, 06, 09) and oil pulling samples (yellow: numbers 13, 16, 19) for subjects A, B, and C (Table 1)
The following bacteria have been cultivated and identified by using MALDI-TOF MS (alphabetical order): Achromobacter xylosoxidans, Actinomyces odontolyticus, Actinomyces radingae, Actinomyces viscosus, Eikenella corrodens, Fusobacterium nucleatum, Gemella sanguinis, Haemophilus parainfluenzae, Klebsiella oxytoca, Leifsonia aquatica, Leuconostoc mesenteroides, Micrococcus luteus/lylae, Neisseria mucosa, Neisseria subflava, Nocardia asteroides, Prevotella denticola, Prevotella desiens, Prevotella melaninogenica, Propionibacterium avidum, Rothia mucilaginosa, Serratia liquefaciens, Serratia marcescens, Staphylococcus aureus, Staphylococcus warneri, Streptococcus constellatus, Streptococcus mitis/oralis, Streptococcus parasanguinis, Streptococcus salivarius, Streptococcus vestibularis, Veillonella parvula. Altogether, 12 out of 85 genera detected by NGS have been cultivated and seven cultivated genera (Achromobacter, Klebsiella, Leifsonia, Leuconostoc, Micrococcus, Nocardia, Serratia) were not detected by NGS in saliva (Table 4). Candida albicans was the only fungus which has been cultivated.
Table 4.
Summary of bacteria down to genus level detected in oral microbiomes of subjects A, B, and C by using 16S rDNA next-generation sequencing and bioinformatics (alphabetical order; percentage of appearance in saliva)
| Genus | % of appearance in saliva | Genus | % of appearance in saliva | ||||
|---|---|---|---|---|---|---|---|
| Subject A | Subject B | Subject C | Subject A | Subject B | Subject C | ||
| Acinetobacter | - | 0.0002 | 0.0003 | Listeria | 0.0002 | 0.0012 | 0.0008 |
| Actinobacillus | 0.4555 | 0.3082 | 0.5673 | Lysinibacillus | - | 0.0002 | - |
| Actinomyces | 2.4590 | 4.7042 | 3.2081 | Megasphaera | 2.0961 | 0.4093 | 0.3995 |
| Aerococcus | 0.1050 | 0.0002 | 0.0003 | Mobiluncus | - | 0.0249 | 0.0620 |
| Aggregatibacter | 0.1753 | 0.1427 | 0.2611 | Mogibacterium | 0.3825 | 0.3154 | 0.1561 |
| Agrobacterium | 0.0004 | 0.0005 | 0.0005 | Mollicutes RF39 | 0.0647 | 0.0407 | 0.0479 |
| Akkermansia | 0.0002 | 0.0002 | 0.0003 | Moraxella | 0.0004 | - | 0.0008 |
| Atopobium | 1.9965 | 0.9902 | 1.1808 | Moryella | 0.1146 | 0.0005 | 0.1020 |
| Bacillus | - | 0.0002 | - | Mycoplasma | 0.0011 | 0.0002 | 0.0022 |
| Bacteroidales S24-7 | 0.0054 | 0.0035 | 0.0044 | Neisseria | 4.5475 | 8.6061 | 12.9174 |
| Bacteroides | 0.0018 | 0.0026 | 0.0016 | Oribacterium | 0.2185 | 0.3268 | 0.5453 |
| Bifidobacterium | 0.0040 | - | 0.0321 | Oscillospira | 0.0007 | 0.0007 | 0.0011 |
| Bulleidia | 0.4242 | 0.4873 | 0.6032 | Oxalobacter | 0.0002 | 0.0002 | - |
| Butyrivibrio | - | 0.0316 | 0.0617 | Paludibacter | 0.0992 | 0.0014 | 0.0011 |
| Campylobacter | 0.7986 | 0.9012 | 1.3790 | Parabacteroides | - | 0.0002 | - |
| Candidatus Absconditabacteria | 0.0098 | 0.0030 | 0.2660 | Paracoccus | - | 0.0005 | - |
| Candidatus Gracilibacteria BD1-5 | 0.0154 | 0.0012 | 0.0008 | Parvimonas | 0.0271 | 0.1371 | 0.0057 |
| Candidatus Saccharibacteria F16 | 0.2995 | 0.2656 | 0.4631 | Peptococcus | - | 0.0009 | - |
| Capnocytophaga | 0.3136 | 0.6781 | 0.7960 | Peptostreptococcus | 0.3143 | 1.2703 | 0.2208 |
| Cardiobacterium | 0.0139 | 0.0139 | 0.0041 | Porphyromonas | 4.9405 | 2.6363 | 1.6257 |
| Catonella | 0.1260 | 0.2022 | 0.1381 | Prevotella | 28.5108 | 23.7212 | 28.6407 |
| Coprococcus | 0.0004 | - | - | Propionibacterium | 0.0011 | - | 0.0003 |
| Corynebacterium | 0.0911 | 0.0493 | 0.0286 | Propionivibrio | 0.0002 | - | - |
| Dehalobacterium | 0.0002 | - | - | Pseudomonas | 0.0004 | 0.0007 | 0.0014 |
| Delftia | 0.0004 | 0.0007 | 0.0011 | Pseudoramibacter | 0.0004 | - | 0.0011 |
| Desulfobulbus | 0.0004 | - | - | Ralstonia | 0.0002 | - | - |
| Desulfovibrio | 0.0002 | - | 0.0003 | Rikenella | 0.0018 | 0.0009 | 0.0003 |
| Dethiosulfovibrionaceae TG5 | 0.0092 | - | - | Rothia | 2.2709 | 3.9489 | 4.1385 |
| Dialister | 0.0470 | 0.0149 | 0.0103 | Ruminococcus | 0.0009 | 0.0002 | 0.0003 |
| Eikenella | 0.0004 | 0.0019 | 0.0022 | Scardovia | 0.0045 | 0.0016 | 0.0024 |
| Enterococcus | 0.1394 | 0.2259 | 0.2012 | Schwartzia | 0.0051 | - | 0.0008 |
| Escherichia | 0.0002 | 0.0002 | 0.0008 | Selenomonas | 0.1298 | 0.2466 | 0.6986 |
| Eubacterium | 0.0002 | - | - | Slackia | 0.0170 | 0.0012 | 0.0003 |
| Filifactor | - | 0.0007 | 0.0005 | Staphylococcus | 0.0058 | 0.0044 | 0.0005 |
| Fusobacterium | 6.0281 | 3.7349 | 2.8685 | Streptococcus | 18.6900 | 20.8486 | 17.5940 |
| Gemella | 4.3812 | 3.6017 | 2.3314 | Streptophyta | - | - | 0.0003 |
| Granulicatella | 0.0222 | 0.0425 | 0.0373 | Sutterella | 0.0002 | - | - |
| Haemophilus | 4.7774 | 6.5329 | 6.1481 | Tannerella | 0.5797 | 0.1848 | 0.1634 |
| Kingella | 0.0508 | 0.0600 | 0.1150 | Treponema | 0.0298 | 0.0112 | 0.0416 |
| Lachnospira | 0.4340 | 0.4620 | 0.1640 | Vagococcus | 0.0049 | 0.0098 | 0.0041 |
| Lactobacillus | 0.0022 | 0.0009 | 0.0098 | Veillonella | 9.3103 | 11.6926 | 8.8377 |
| Lautropia | 0.0537 | 0.0056 | 0.0258 | Weeksella | 0.1222 | 0.1274 | 0.7362 |
| Leptotrichia | 4.2630 | 1.9563 | 2.1356 | ||||
Reduction of microbial burden in saliva was significantly higher for oil pulling than for pulling with saline
Prior to and after pulling with saline and oil, the colony-forming units (CFU) in saliva per milliliter were determined (Fig. 4a; Table 3). The analysis revealed a significant higher reduction of bacteria in saliva for oil pulling than for saline pulling, which was very prominent for subjects B (reduction: ~ 78.33 ± 10.87%) and C (reduction: ~ 81.00 ± 8.52%). The reduction through oil pulling for subject A increased over 3 days and achieved the same level as for subjects B and C at day 3 (Fig. 4a).
Fig. 4.

Determination of the capacity of saline pulling and oil pulling to reduce the microbial burden in saliva. Colony-forming units (CFU) of saliva prior to and after saline pulling and oil pulling were counted (Table 3). a Reduction of CFU per ml in percent of saliva due to saline pulling (blue bars) and oil pulling (yellow bars) of subjects A, B, and C. b Reduction of Candida albicans of subject C after saline pulling (~ 57%) and oil pulling (~ 84%) shown on Sabouraud agar plates
Table 3.
Determination of the colony-forming units (CFU) per milliliter of saliva prior to and after saline pulling and oil pulling for subjects A, B, and C
| Subject | Pulling with | Day | CFU/ml prior to/after | Comment |
|---|---|---|---|---|
| A | Saline | 1 | 2.1 × 10⁸/4.1 × 108 | No reduction |
| 2 | 2.2 × 10⁸/1.0 × 108 | Reduction: 55% | ||
| 3 | 2.0 × 10⁸/5.1 × 108 | No reduction | ||
| Oil | 1 | 2.9 × 10⁸/2.8 × 108 | Reduction: 3% | |
| 2 | 4.5 × 10⁸/3.3 × 108 | Reduction: 27% | ||
| 3 | 1.4 × 10⁹/1.1 × 108 | Reduction: 92% | ||
| B | Saline | 1 | 2.6 × 10⁸/2.4 × 108 | Reduction: 8% |
| 2 | 8.1 × 10⁸/2.1 × 108 | Reduction: 74% | ||
| 3 | 2.3 × 10⁸/3.4 × 108 | No reduction | ||
| Oil | 1 | 6.0 × 10⁸/8.0 × 107 | Reduction: 87% | |
| 2 | 6.0 × 10⁸/8.9 × 107 | Reduction: 85% | ||
| 3 | 4.3 × 10⁸/1.6 × 108 | Reduction: 63% | ||
| C | Saline | 1 | 2.2 × 10⁸/1.6 × 108 | Reduction: 27% |
| 2 | 1.4 × 10⁸/1.4 × 108 | No reduction | ||
| 3 | 2.4 × 10⁸/1.8 × 108 | Reduction: 25% | ||
| Oil | 1 | 8.2 × 10⁸/2.0 × 108 | Reduction: 76% | |
| 2 | 4.3 × 10⁸/1.1 × 108 | Reduction: 74% | ||
| 3 | 6.4 × 10⁸/4.5 × 107 | Reduction: 93% |
Subjects A and B harbored only single colonies of Candida species in their oral cavities, whereas subject C harbored high amounts, which were identified as C. albicans by MALDI-TOF MS. Since the method used for 16S rDNA next-generation sequencing detected specifically bacteria but not fungi, reduction of this fungus due to saline pulling (~ 57%) and oil pulling (~ 84%) is representative as shown in Fig. 4b. Both methods are able to reduce the amount of C. albicans in the oral cavity with a significantly higher efficiency for oil pulling.
Subjects A, B, and C harbored an individual oral microbiome
16S rDNA next-generation sequencing and bioinformatics revealed individual oral microbiomes for subjects A, B, and C (Fig. 5; Table 4). This was demonstrated by principal coordinates analysis (PCoA) of 22 data points comprising all, saliva, saline, and oil pulling samples (Table 1). The individual oral microbiomes appeared as distinct clouds clearly separated (Fig. 5a). Altogether, 85 genera have been detected in oral microbiome represented by saliva of probands (Fig. 5b; Table 4). Subject A harbored 75, subject B harbored 70, and subject C harbored 71 genera and they shared 60 genera. The majority of bacteria were made up of ~ 90% comprising 11 genera (decreasing order): Prevotella, Streptococcus, Veillonella, Neisseria, Haemophilus, Fusobacterium, Gemella, Actinomyces, Rothia, Porphyromonas, Leptotrichia. The remaining ~ 10% encompassed 74 genera.
Fig. 5.

Oral microbiomes of subjects A, B, and C. a Principal coordinates analysis (PCoA) of n = 22 data points (Table 1) of subjects A, B, and C. Data points from each subject appear as distinct cloud, indicated in orange (subject A), purple (subject B), and green (subject C). b Percentage of bacteria down to the genus level indicated as columns for saliva of subjects A, B, and C (Table 3). Red rectangle highlights ~ 90% of all bacteria found (11 genera): Prevotella, Streptococcus, Veillonella, Neisseria, Haemophilus, Fusobacterium, Gemella, Actinomyces, Rothia, Porphyromonas, Leptotrichia
Members of the individual oral microbiomes were represented in samples of saline pulling and oil pulling
In order to determine the capacity of saline pulling and oil pulling to absorb members of the oral microbiome representatively, saliva samples, saline pulling samples, and oil pulling samples have been compared (Fig. 6). The PCoA in Fig. 6a is the same analysis as in Fig. 5a but only saliva, saline, and oil pulling samples are shown to demonstrate similarities. Figure 6 b shows the percentage of bacteria down to the genus level found in these sample types. The majority of bacteria are similar and only minor differences in percentage of appearance could be observed. For instance, in subject A, Prevotella in saline pulling (20.5%) and in oil pulling (21.2%) samples was lower than in saliva (28.5%), whereas Neisseria (9.9%/9.2%) and Rothia (5.9%/5.3%) were higher in saline/oil pulling samples than in saliva (4.5%/2.3%). In subject B, Prevotella was lower in oil pulling samples (17.7%) than in saline pulling samples (25.7%) and in saliva (23.7%). In subject C, Prevotella was higher in saliva (28.6%) than in saline (23.6%) and in oil pulling (23.5%) samples.
Fig. 6.

Oral microbiomes of subjects A, B, and C subdivided into saliva, saline pulling, and oil pulling. a Principal coordinates analysis (PCoA) of n = 9 data points of subjects A, B, and C: saliva (gray) = numbers 01, 12, 22; saline (blue) = numbers 03, 06, 09; oil (yellow) = numbers 13, 16, 19 (Table 1). Data points from each subject appear as distinct cloud, indicated in orange (subject A), purple (subject B), and green (subject C). b Percentage of bacteria down to the genus level indicated as columns for subjects A, B, and C subdivided into saliva, saline pulling, and oil pulling
Furthermore, bioinformatics was done considering cell wall structure (Gram stain: Gram-positive, Gram-negative) and oxygen tolerance (obligate anaerobes, facultative aerobes, aerobes) as demonstrated in Fig. 7. The ratios of Gram-positive to Gram-negative bacteria were very similar for saline and oil pulling samples but contained less Gram-negative and more Gram-positive bacteria when compared with saliva (Fig. 7a). The ratios of obligate anaerobes, facultative aerobes, and aerobes were very similar, apart from subject A who showed significant enrichment of aerobes in saline and oil pulling samples. Subject B showed a slightly increased enrichment of aerobes in oil pulling samples (Fig. 7b).
Fig. 7.

Oral microbiomes of subjects A, B, and C subdivided into saliva, saline pulling, and oil pulling. a Subdivision into percentage of Gram-negative and Gram-positive bacteria. b Subdivision into percentage of obligate anaerobes, facultative aerobes, and aerobes
Quality of mock community in saline and in oil
In order to monitor the whole procedure of DNA extraction, PCR, library construction, and 16S rDNA next-generation sequencing, a mock community was created containing equimolar amounts of 14 Gram-positive and Gram-negative bacteria taking into account morphologies and cell wall structures (Table 1). Four different types with respect to percentage of appearance have been detected (Fig. 8): firstly, enrichment of Porphyromonas in oil (saline: ~ 9%, oil: ~ 17%); secondly, percentage of appearance in the range of ~ 10 through ~ 15% in saline and oil (Streptococcus, Staphylococcus, Lactobacillus, Moraxella, Listeria); thirdly, percentage of appearance in the range of ~ 4 through ~ 7% in saline and oil (Escherichia, Neisseria, Acinetobacter, Pseudomonas, Bacillus, Enterococcus); fourthly, low abundance of Propionibacterium (saline: ~ 0.17%, oil: ~ 0.22%).
Fig. 8.

Mock community as quality and positive control for saline pulling (negative control) and for oil pulling as the verum (Table 2)
Discussion
The human oral cavity is a unique habitat with distinctive anatomic and physiological features resulting in a highly diversified oral environment and microbiota. Individual oral health depends on personal oral hygiene in order to reduce the overall microbial burden, including potential pathogens, and on nutrition. Both, oral hygiene and nutrition, have a significant impact on oral health and the incidence of oral and systemic diseases [35–41]. Apart from teeth brushing, utilization of dental floss, and rinsing with mouthwashes, oil pulling is a very old and cost-effective enlargement to oral and systemic health benefits. This study on oil pulling was conducted with three healthy subjects all part of the laboratory team in order to ensure continuity and immediate sample processing. To our knowledge, this was the first study which examined the microbiota in oil pulling samples. Therefore, we aimed at the high-resolution taxonomic examination of the oral microbiota in saliva and in oil pulling samples and analyzed the capacity of the method to reduce the overall microbial burden of the oral cavity transiently.
The first decision to conduct the study concerned the volume of sunflower seed oil for pulling and duration of procedure. Instructions in literature regarding volume are very imprecise and range from 1 to 3 teaspoons, one tablespoon through as much as comfortable [15–17, 20]. In order to specify volume, we tested 5, 10, 15, 20, and 25 ml and found that 15 ml was acceptable for all participants. Regarding duration, we used 15 ml of oil and tested oil pulling for 10, 15, and 20 min. All participants found 15 min acceptable and reported on an increasing volume during pulling and a growing viscosity which came along with a “peeling” effect in mouth. Both effects, increased volume and viscosity, were considerably less when saline is used instead of oil. Examination of the sample volumes after saline and oil pulling revealed a significant higher production of saliva for the latter one explaining the observation that volume during pulling increased considerably (Fig. 1). Therefore, oil pulling has the capacity to stimulate the salivary flow rate and can be recommended for patients suffering from hyposalivation, xerostomia, or dry mouth syndrome [42, 43]. In order to examine the feeling of an increased viscosity and the accompanying “peeling” effect, we microscoped saline/saliva and oil/saliva samples. The analysis revealed that oral epithelial cells were closely ensheathed with distinct oil droplets in oil pulling samples, whereas the cells in saline pulling samples appeared distinct. The major components of the sunflower seed oil used were oleic acid (14–40%) and linoleic acid (48–74%) which are monounsaturated omega-9 fatty acids and polyunsaturated omega-6 fatty acids, respectively. We assume that the intensive pulling with that oil resulted in a mixture, an emulsion, of oil and saliva which induced generation of micelles interacting via their unsaturated cis double bonds with superficial triglycerides such as lecithin and glycerol of the oral epithelial cells through van der Waals forces. The longer the pulling lasted, the more epithelial cells were ensheathed, inclosing bacteria, and thereby increasing emulsification and viscosity which induced the “peeling” effect. Therefore, oil pulling can be construed as a kind of “oral massage” reaching almost all anatomic features in the oral cavity and which is rejected after the procedure. This may contribute to the explanation of the benefits of oil pulling for gingivitis, periodontitis, and tissue regeneration [16, 18, 19].
16S rDNA sequencing is a complex procedure involving DNA extraction, PCR, library construction, next-generation sequencing, and bioinformatics resulting in a relative frequency of bacteria in a given sample as a function of sequence counts in percentage. In order to calculate the amount of and to identify viable bacteria in saliva, saline pulling, and oil pulling samples, we cultured the samples under appropriate microaerophilic and anaerobic conditions [44]. The advantage of our study was the immediate sample processing which ensured optimal culture conditions resulting in a bacterial survival rate of ~ 90–98% cultivable bacteria within 1 h. Within that time period, oil pulling showed no significant anti-bacterial effect on cultivable bacteria which was in accordance with the results of other studies [18, 20]. Comparison of culture and sequencing showed that we were able to culture members of 12 genera out of 85 genera detected by NGS. Although these 12 genera represented only ~ 14%, these cultivated genera belong to the mass of ~ 80–85% genera of the oral microbiome (Table 4; Fig. 5) indicating a reliable counting of viable bacteria in saliva, saline pulling, and oil pulling samples in order to calculate the reductive effect of pulling on the microbial burden in oral cavity. Seven more bacteria were cultivated but not detected by NGS. One explanation is that the colony-forming units of Achromobacter, Leifsonia, Leuconostoc, Micrococcus, and Nocardia were very low and therefore not detected by NGS. The second explanation is that the genera Klebsiella and Serratia belong to the Enterobacteriaceae. Taking into account that the analyzed amplicon had a size of ~ 250 bp, we assume that these bacteria were false-classified by the bioinformatics software tool to other Enterobacteriaceae (Table 4).
Candida albicans was the only fungus cultivated and which was not covered by 16S rDNA NGS since the method used focused on bacteria. But our study showed that oil pulling had also the capacity to reduce the amount of this pathogen significantly (Fig. 4b). The overall reduction of the microbial burden in the oral cavity due to oil pulling was transient since the same amount of microorganisms was restored within ~ 24 h. Furthermore, the high-resolution taxonomic examination of the oral microbiome exhibited that the individuals who participated in the study harbored individual oral microbiomes and that the same composition of microorganisms was also restored after ~ 24 h. This was consistent with the oral cavity as a highly diversified oral environment but harboring a core microbiome and maintaining individuality with little geographic diversity [3, 5, 45, 46].
Even more, the individual microbiomes were detected in all samples examined independently whether in saliva, saline, or oil pulling samples (Figs. 5 and 6). The pulling methods showed no significant preferences for particular bacteria, even considering morphology, cell wall structure, and oxygen tolerance (Fig. 7). Therefore, the overall microbial burden was uniformly reduced. But one has to bear in mind that the participating subjects were healthy, nonsmoker, and omnivore and showed no current oral health problems. All participants applied in general a very good oral hygiene. Considering the mock community used as a positive control for the whole analysis, we observed a significant enrichment of the well-known oral pathogen P. gingivalis in oil pulling sample (Fig. 8). Therefore, it is recommended to conduct a study with patients suffering from periodontitis where P. gingivalis plays a crucial role and acts as a keystone-pathogen [47, 48] in order to demonstrate potential benefits of oil pulling for periodontitis via reduction of this pathogen in the oral cavity.
The participants (n = 3) of this study perceived the oil pulling procedure as comfortable and reported no problems, which is in compliance with other studies [15–22]. However, literatures report on at least three cases where parts of the oil/saliva emulsion were aspirated, inhaled, or swallowed thereby causing exogenous lipoid pneumonia [49, 50]. This has to be considered and requires detailed instructions for participants and patients prior to oil pulling.
Conclusions
To sum up, this was the first comprehensive study which examined the microbiota in oil pulling samples. The data achieved within the limitations of this pilot study show that oil pulling is able to reduce the overall microbial burden of the oral cavity transiently and that the microbiota in oil pulling samples represent the entire oral microbiome. As an enlargement of standard oral hygiene techniques, the combination of oil pulling, e.g., along with teeth brushing, has the capacity to minimize the risk of local and distant-site infections contributing to overall oral health. Although this is conclusive and considering publications on oil pulling, to our opinion evidence necessitates clinical trials (based on the standardized and commercially available sunflower seed oil we used, a particular volume of 15 ml and pulling for exactly 15 min) with sufficient participants and takes additional questions into account: (1) Do oil pulling samples contain other substances apart from microorganisms, for example, bacterial proteins, toxins, or any other molecules? This could be answered by using mass spectrometry as a direct analysis. (2) Has oil pulling the capacity to minimize chronic inflammation starting from oral cavity? This could be answered by examination of specific parameters for inflammation such as CRP, leukocyte amount, immunoglobulins, erythrocyte sedimentation rate, and complete blood count in blood samples as an indirect analysis.
Acknowledgments
The authors thank English teacher Marina Domann for editing English spelling and grammar.
Funding
Open Access funding enabled and organized by Projekt DEAL. The 16S rDNA next-generation sequencing was in part funded by the Deutsche Forschungsgemeinschaft SFB-TR84 project B01 to TH.
Compliance with ethical standards
Conflict of interest
The authors declare that they have no conflict of interest.
Ethical approval
All procedures performed in studies involving human participants were in accordance with the ethical standards of the institutional research committee and with the 1964 Helsinki declaration and its later amendments or comparable ethical standards. The study was approved by the Ethics Board of the Justus-Liebig-University of Giessen, Germany (AZ: 97/16). The study conducted is an observational study. It was retrospectively registered at the German Clinical Trials Register under trial registration number DRKS00011922.
Informed consent
Informed consent was obtained from all individual participants included in the study.
Footnotes
Publisher’s note
Springer Nature remains neutral with regard to jurisdictional claims in published maps and institutional affiliations.
Contributor Information
Tim Griessl, tim.griessl@googlemail.com.
Silke Zechel-Gran, Email: silke.zechel@mikrobio.med.uni-giessen.de.
Stefan Olejniczak, Email: dentist.stefan.olejniczak@gmail.com.
Markus Weigel, Email: markus.weigel@mikrobio.med.uni-giessen.de.
Torsten Hain, Email: torsten.hain@mikrobio.med.uni-giessen.de.
Eugen Domann, Email: eugen.domann@mikrobio.med.uni-giessen.de.
References
- 1.Arweiler NB, Netuschil L. The oral microbiota. In: Schwiertz A, editor. Microbiota of the human body, advances in experimental medicine and biology 902. Switzerland: Springer International Publishing; 2016. pp. 45–60. [DOI] [PubMed] [Google Scholar]
- 2.Scannapieco FA. The oral environment. In: Lamont RJ, Hajishengallis GN, Jenkonson HF, editors. Oral microbiology and immunology. 2. Washington, D.C.: ASM Press; 2014. pp. 51–76. [Google Scholar]
- 3.Wade WG. The oral microbiome in health and disease. Pharmacol Res. 2013;69:137–143. doi: 10.1016/j.phrs.2012.11.006. [DOI] [PubMed] [Google Scholar]
- 4.Bahrani-Mougeot FK, Saunders SE, Brennan MT, Lockhart PB. Associations between bacteremia from oral sources and distant-site infections: tooth brushing versus single tooth extraction. Oral Med. 2015;119:430–435. doi: 10.1016/j.oooo.2015.01.009. [DOI] [PubMed] [Google Scholar]
- 5.Loyed-Price J, Abu-Ali G, Huttenhower C. The healthy human microbiome. Genome Med. 2016;8:51. doi: 10.1186/s13073-016-0307-y. [DOI] [PMC free article] [PubMed] [Google Scholar]
- 6.Hirschfeld J, Kawai T. Oral inflammation and bacteremia: implications for chronic and acute systemic diseases involving major organs. Cardiovasc Hematol Disord Drug Targets. 2015;15:70–84. doi: 10.2174/1871529X15666150108115241. [DOI] [PubMed] [Google Scholar]
- 7.Lockhart PB, Brennan MT, Thornhill M, Michalowicz BS, Noll J, Bahrani-Mougeot FK, Sasser HC. Poor oral hygiene as a risk factor for infective endocarditis-related bacteremia. J Am Dent Assoc. 2009;140:1238–1244. doi: 10.14219/jada.archive.2009.0046. [DOI] [PMC free article] [PubMed] [Google Scholar]
- 8.Welbury RR, Thomason JM, Fitzgerald JL, Steen IN, Marshall NJ, Foster HE. Increased prevalence of dental caries and poor oral hygiene in juvenile idiopathic arthritis. Rheumatology. 2003;42:1445–1451. doi: 10.1093/rheumatology/keg395. [DOI] [PubMed] [Google Scholar]
- 9.Han YW, Houcken W, Loos BG, Schenkein HA, Tezal M. Periodontal disease, atherosclerosis, adverse pregnancy outcomes, and head-and-neck cancer. Adv Dent Res. 2014;26:47–55. doi: 10.1177/0022034514528334. [DOI] [PMC free article] [PubMed] [Google Scholar]
- 10.Slocum C, Kramer C, Genco CA. Immune dysregulation mediated by the oral microbiome: potential link to chronic inflammation and atherosclerosis. J Intern Med. 2016;280:114–128. doi: 10.1111/joim.12476. [DOI] [PubMed] [Google Scholar]
- 11.Dai R, Lam OLT, Lo ECM, Li LSW, Wen Y, McGrath C. A systemic review and meta-analysis of clinical, microbiological, and behavioural aspects of oral health among patients with stroke. J Dent. 2015;43:171–180. doi: 10.1016/j.jdent.2014.06.005. [DOI] [PubMed] [Google Scholar]
- 12.Straka M. Pregnancy and periodontal tissue. Neuro Endocrinol Lett. 2011;32:34–38. [PubMed] [Google Scholar]
- 13.Ames NJ. Evidence to support tooth brushing in critically ill patients. Am J Crit Care. 2011;20:242–250. doi: 10.4037/ajcc2011120. [DOI] [PMC free article] [PubMed] [Google Scholar]
- 14.Willems HM, Xu Z, Peters BM. Polymicrobial biofilm studies: from basic science to biofilm control. Curr Oral Health Rep. 2016;3:36–44. doi: 10.1007/s40496-016-0078-y. [DOI] [PMC free article] [PubMed] [Google Scholar]
- 15.Asokan S. Oil pulling therapy. Indian J Dent Res. 2008;19:169. doi: 10.4103/0970-9290.40476. [DOI] [PubMed] [Google Scholar]
- 16.Singh A, Purohit B. Tooth brushing, oil pulling and tissue regeneration: a review of holistic approaches to oral health. J Ayurveda Integr Med. 2011;2:64–68. doi: 10.4103/0975-9476.82525. [DOI] [PMC free article] [PubMed] [Google Scholar]
- 17.Asokan S, Emmadi P, Chamundeswari R. Effect of oil pulling on plaque induced gingivitis: a randomized, controlled, triple-blind study. Indian J Dent Res. 2009;20:47–51. doi: 10.4103/0970-9290.49067. [DOI] [PubMed] [Google Scholar]
- 18.Asokan S, Rathinasamy TK, Inbamani N, Menon T, Kumar SS, Emmadi P, Raghuraman R. Mechanism of oil-pulling therapy – in vitro study. Indian J Dent Res. 2011;22:34–37. doi: 10.4103/0970-9290.79971. [DOI] [PubMed] [Google Scholar]
- 19.Gbinigie O, Onakpoya I, Spencer E, McCall MacBain M, Heneghan C. Effect of oil pulling in promoting oro dental hygiene: a systemic review of randomized clinical trials. Complement Ther Med. 2016;26:47–54. doi: 10.1016/j.ctim.2016.02.011. [DOI] [PubMed] [Google Scholar]
- 20.Jauhari D, Srivastava N, Rana V, Chandna P. Comparative evaluation of the effects of fluoride mouthrinse, herbal mouthrinse and oil pulling on the caries activity and Streptococcus mutans counts using Oratest and Dentocult SM Strip Mutans Kit. Int J Clin Pediatr Dent. 2015;8:114–118. doi: 10.5005/jp-journals-10005-1295. [DOI] [PMC free article] [PubMed] [Google Scholar]
- 21.Kaushik M, Reddy P, Sharma R, Udameshi P, Mehra N, Marwaha A. The effect of coconut oil pulling on Streptococcus mutans count in saliva in comparison with chlorhexidine mouthwash. J Contemp Dent Pract. 2016;17:38–41. doi: 10.5005/jp-journals-10024-1800. [DOI] [PubMed] [Google Scholar]
- 22.Peedikayil FC, Sreenivasan P, Narayanan A. Effect of coconut oil in plaque related gingivitis – a preliminary report. Niger Med J. 2015;56:143–147. doi: 10.4103/0300-1652.153406. [DOI] [PMC free article] [PubMed] [Google Scholar]
- 23.Nolte FS. Molecular microbiology. In: Jorgensen JH, Pfaller MA, Carroll KC, Funke G, Landry ML, Richter SS, Warnock DW, editors. Manual of clinical microbiology. Washington, D.C.: ASM Press; 2015. pp. 51–76. [Google Scholar]
- 24.Illumina reporter software: https://www.illumina.com/systems/sequencing-platforms/miseq/products-services/miseq-reporter.html. Accessed 18 Sept 2020
- 25.FastQC software: http://www.bioinformatics.babraham.ac.uk/projects/fastqc/. Accessed 18 Sept 2020
- 26.Masella AP, Bartram AK, Truszkowski JM, Brown DG, Neufeld JD. PANDAseq: paired-end assembler for Illumina sequences. BMC Bioinformatics. 2012;13:31. doi: 10.1186/1471-2105-13-31. [DOI] [PMC free article] [PubMed] [Google Scholar]
- 27.Caporaso JG, Kuczynski J, Stombaugh J, Bittinger K, Bushman FD, Costello EK, Fierer N, Peña AG, Goodrich JK, Gordon JI, Huttley GA, Kelley ST, Knights D, Koenig JE, Ley RE, Lozupone CA, McDonald D, Muegge BD, Pirrung M, Reeder J, Sevinsky JR, Turnbaugh PJ, Walters WA, Widmann J, Yatsunenko T, Zaneveld J, Knight R. QIIME allows analysis of high-throughput community sequencing data. Nat Methods. 2010;7:335–336. doi: 10.1038/nmeth.f.303. [DOI] [PMC free article] [PubMed] [Google Scholar]
- 28.Edgar RC. Search and clustering orders of magnitude faster than BLAST. Bioinformatics. 2010;26:2460–2461. doi: 10.1093/bioinformatics/btq461. [DOI] [PubMed] [Google Scholar]
- 29.DeSantis TZ, Hugenholtz P, Larsen N, Rojas M, Brodie EL, Keller K, Huber T, Dalevi D, Hu P, Andersen GL. Greengenes, a chimera-checked 16S rRNA gene database and workbench compatible with ARB. Appl Environ Microbiol. 2006;72:5069–5072. doi: 10.1128/AEM.03006-05. [DOI] [PMC free article] [PubMed] [Google Scholar]
- 30.Caporaso JG, Bittinger K, Bushman FD, DeSantis TZ, Andersen GL, Knight R. PyNAST: a flexible tool for aligning sequences to a template alignment. Bioinformatics. 2010;26:266–267. doi: 10.1093/bioinformatics/btp636. [DOI] [PMC free article] [PubMed] [Google Scholar]
- 31.Haas BJ, Gevers D, Earl AM, Feldgarden M, Ward DV, Giannoukos G, Ciulla D, Tabbaa D, Highlander SK, Sodergren E, Methé B, DeSantis TZ, Human Microbiome Consortium. Petrosino JF, Knight R, Birren BW. Chimeric 16S rRNA sequence formation and detection in Sanger and 454-pyrosequenced PCR amplicons. Genome Res. 2011;21:494–504. doi: 10.1101/gr.112730.110. [DOI] [PMC free article] [PubMed] [Google Scholar]
- 32.McDonald D, Price MN, Goodrich J, Nawrocki EP, DeSantis TZ, Probst A, Andersen GL, Knight R, Hugenholtz P. An improved Greengenes taxonomy with explicit ranks for ecological and evolutionary analyses of bacteria and archaea. ISME J. 2012;6:610–618. doi: 10.1038/ismej.2011.139. [DOI] [PMC free article] [PubMed] [Google Scholar]
- 33.Price MN, Dehal PS, Arkin AP. FastTree 2 – approximately maximum-likelihood trees for large alignments. PLoS One. 2010;5:e9490. doi: 10.1371/journal.pone.0009490. [DOI] [PMC free article] [PubMed] [Google Scholar]
- 34.Vázquez-Baeza Y, Pirrung M, Gonzalez A, Knight R. EMPeror: a tool visualizing high-throughput microbial community data. Gigascience. 2013;2:16. doi: 10.1186/2047-217X-2-16. [DOI] [PMC free article] [PubMed] [Google Scholar]
- 35.Bhattacharya PT, Misra SR, Hussain M. Nutritional aspects of essential trace elements in oral health and disease: an extensive review. Scientifica (Cairo) 2016;5464373:1–12. doi: 10.1155/2016/5464373. [DOI] [PMC free article] [PubMed] [Google Scholar]
- 36.Gaur S, Agnihotri R. Green tea: a novel functional food for the oral health of older adults. Geriatr Gerontol Int. 2014;14:238–250. doi: 10.1111/ggi.12194. [DOI] [PubMed] [Google Scholar]
- 37.Gil-Montoya JA, de Mello AL, Barrios R, Gonzalez-Molez MA, Bravo M. Oral health in the elderly patient and its impact on general well-being: a nonsystematic review. Clin Interv Aging. 2015;10:461–467. doi: 10.2147/CIA.S54630. [DOI] [PMC free article] [PubMed] [Google Scholar]
- 38.Slotwinska SM, Slotwinski R. Host response, obesity, and oral health. Cent Eur J Immunol. 2015;40:201–205. doi: 10.5114/ceji.2015.52834. [DOI] [PMC free article] [PubMed] [Google Scholar]
- 39.Najeeb S, Zafar MS, Khurshid Z, Zohaib S, Almas K. The role of nutrition in periodontal health: an update. Nutrients. 2016;8:530. doi: 10.3390/nu8090530. [DOI] [PMC free article] [PubMed] [Google Scholar]
- 40.Sheiham A, James WP. Diet and dental caries: the pivotal role of free sugars reemphasized. J Dent Res. 2015;94:1341–1347. doi: 10.1177/0022034515590377. [DOI] [PubMed] [Google Scholar]
- 41.Wang X, Lussi A. Introduction: functional foods and oral health. Eur J Nutr. 2012;51(Suppl 2):S39–S48. doi: 10.1007/s00394-012-0326-4. [DOI] [PubMed] [Google Scholar]
- 42.Lapiedra RC, Gomez GE, Sanchez BP, Pereda AA, Turner MD. The effect of a combination saliva substitute for the management of xerostomia and hyposalivation. J Maxillofac Oral Surg. 2015;14:653–658. doi: 10.1007/s12663-015-0752-y. [DOI] [PMC free article] [PubMed] [Google Scholar]
- 43.Shimazaki Y, Fu B, Yonemoto K, Akifusa S, Shibata Y, Takeshita T, Ninomiya T, Kiyohara Y, Yamashita Y. Stimulated salivary flow rate and oral health status. J Oral Sci. 2016;59:55–62. doi: 10.2334/josnusd.16-0372. [DOI] [PubMed] [Google Scholar]
- 44.Wade W, Thompson H, Rybalka A, Vartoukian S. Uncultured members of the oral microbiome. J Calif Dent Assoc. 2016;44:447–456. [PubMed] [Google Scholar]
- 45.Nasidze I, Li J, Quinque D, Tang K, Stoneking M. Global diversity in the human salivary microbiome. Genome Res. 2009;19:636–643. doi: 10.1101/gr.084616.108. [DOI] [PMC free article] [PubMed] [Google Scholar]
- 46.Krishnan K, Chen T, Paster BJ. A practical guide to the oral microbiome and its relation to health and disease. Oral Dis. 2017;23:276–286. doi: 10.1111/odi.12509. [DOI] [PMC free article] [PubMed] [Google Scholar]
- 47.Hajishengallis G, Darveau RP, Curtis MA. The keystone-pathogen hypothesis. Nat Rev Microbiol. 2012;10:717–725. doi: 10.1038/nrmicro2873. [DOI] [PMC free article] [PubMed] [Google Scholar]
- 48.Groeger S, Jarzina F, Domann E, Meyle J. Porphyromonas gingivalis activates NFKB and MAPK pathways in human oral epithelial cells. BMC Immunol. 2017;18:1. doi: 10.1186/s12865-016-0185-5. [DOI] [PMC free article] [PubMed] [Google Scholar]
- 49.Kim JY, Jung JW, Choi JC, Shin JW, Park IW, Choi BW. Recurrent lipoid pneumonia associated with oil pulling. Int J Tuberc Lung Dis. 2014;18:251–252. doi: 10.5588/ijtld.13.0852. [DOI] [PubMed] [Google Scholar]
- 50.Kuroyama M, Kagawa H, Kitada S, Maekura R, Mori M, Hirano H. Exogenous lipoid pneumonia caused by repeated sesame oil pulling: a report of two cases. BMC Pulm Med. 2015;15:135. doi: 10.1186/s12890-015-0134-8. [DOI] [PMC free article] [PubMed] [Google Scholar]