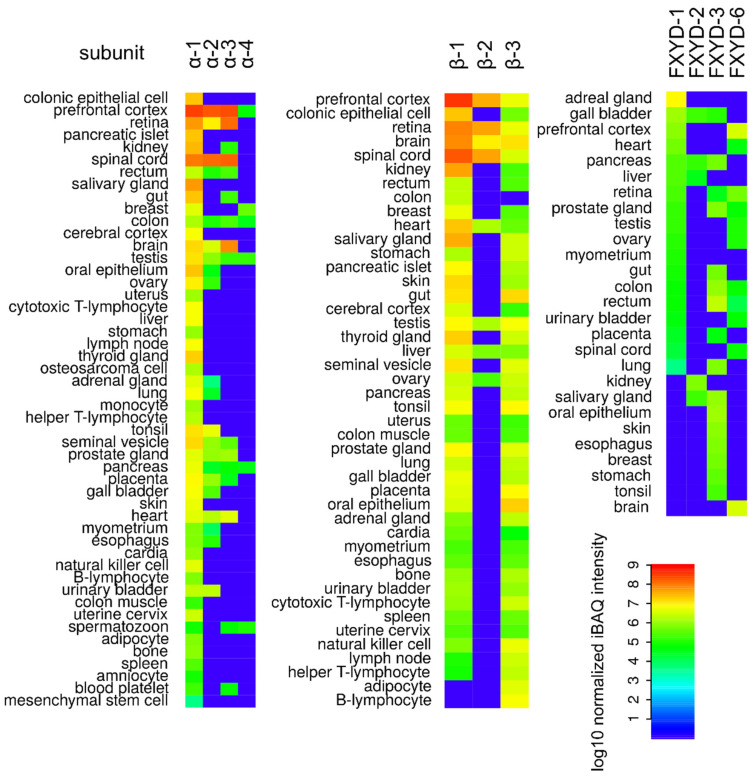
Figure 3.
The human proteome of individual Na+/K+-ATPase isoforms of α subunit (α-1, α-2, α-3, and α-4) β subunit (β-1, β-2, and β-3) and FXYD subunit (FXYD-1, FXYD-2, FXYD-3, and FXYD-6, data for FXYD-4, FXYD-5, FXYD-7 were not available). Data were taken from ProteomicsDB [48,49,50,51,52,53,54,55,56,57,58]. The color scale represents log10 normalized intensity-based absolute quantification (iBAQ) [59] for respective isoforms in a given tissue. The plots were prepared in R software, version 3.4.4.

