

Abstract
Background:
Lean muscle plays critical roles in physical functioning and metabolism. However, little is known regarding associations between muscle and mortality in adults.
Objective:
The purpose was to evaluate associations between abdominal muscle quantity (area) and quality (density) with risk of all-cause mortality in a diverse cohort free of cardiovascular disease.
Design:
Data were taken from the Abdominal Body Composition, Inflammation, and Cardiovascular Disease ancillary study of the Multi-Ethnic Study of Atherosclerosis prospective cohort study. Participants were adults (45–85 years) free of extant cardiovascular disease, and of Hispanic, African American, Chinese, or Caucasian descent. Of the original 6814 MESA participants, a random, representative sample (n=1,974) participated in the ancillary body composition study. Abdominal muscle area and density were measured from computed tomography scans spanning L2-L4. Muscle density was measured as attenuation in Hounsfield units, and area was quantified as cm2. Gender-stratified cox proportional hazard models assessed the risk of all-cause mortality across gender-specific quartiles of muscle area and density adjusting for confounders, with area and density entered simultaneously.
Results:
At baseline, the mean age for men (n=946) and women (n=955) was 61.5 and 62.5 years and median follow-up time was 10.6 and 10.9 years, respectively. Muscle density was inversely associated with mortality, with the highest quartile of density showing a 73% reduction in risk for men (HR=0.27, 95% CI=0.14–0.51; p-trend<0.001) and 57% reduction for women (HR=0.43, 95% CI=0.18–1.01; p-trend=0.04) compared to the lowest quartile when adjusting for mortality risk factors, lifestyle, BMI and visceral fat. There was no association between muscle area and all-cause mortality for men (p-trend=0.58) or women (p-trend = 0.47).
Conclusions:
Greater abdominal muscle density, but not muscle area, is associated with markedly lower risk of all-cause mortality across a decade of follow up. Muscle quality may be a powerful predictor of mortality in community dwelling adults.
Keywords: body composition, obesity, mortality, myosteatosis, muscle quality, muscle quantity
1. Introduction
Lean muscle plays a critical role in physical functioning and metabolism, yet the associations between muscle and mortality are not well understood. To date, research on muscle area as a risk factor for chronic disease and mortality has been inconsistent. While a number of studies have shown increased muscle area is associated with lower risk of diabetes,(1) cardiovascular disease,(2) and all-cause mortality,(3) others have found greater muscle area to be associated with higher risk of diabetes,(4) hypertension,(5) and cardiovascular disease.(2)
These inconsistencies may be due to the fact that muscle quality appears to be more important for health than muscle quantity.(6) Fat infiltration in lean muscle, or myosteatosis, is a measure of muscle quality, and occurs with aging. Myosteatosis can be measured as muscle density on computed tomography (CT) scans, with lower muscle density comprising more intramuscular fat.(7) Low-density muscle has been shown to predict reduced physical functioning and strength, and increased risk of hospitalization and mortality in older adults and frail clinical populations.(8–15) However, the association between muscle density and all-cause mortality in a cohort of healthy, ethnically diverse adults has yet to be investigated. Additionally, while several studies have evaluated muscle area and density as distinct predictors of mortality, few have simultaneously adjusted for area and density, which would allow for investigation of the independent associations of muscle size and quality with mortality. Therefore, the purpose of the current analysis was to evaluate the independent associations between muscle quantity (area) and quality (density) and all-cause mortality in adults in the Multi-Ethnic Study of Atherosclerosis (MESA). We hypothesized that greater muscle area and density would each be associated with lower all-cause mortality in mutually adjusted models.
2. Subjects and Methods
2.1. Study Overview & Participants
The Multi-Ethnic Study of Atherosclerosis (MESA) is a longitudinal study conducted across six different communities in the United States with baseline data collected on 6,814 men and women initially free of any known cardiovascular disease. Details of the study design have been published previously.(16)
The Abdominal Body Composition, Inflammation, and Cardiovascular Disease ancillary study (2002–2005) is composed of a random sample of the MESA cohort in which roughly 30% were selected to receive an abdominal CT scan at either visits 2 or 3. The ancillary study sample (n=1,974) is roughly representative of the whole MESA cohort, and includes males and post-menopausal women of Hispanic, African American, Chinese, and Caucasian descent. All MESA participants that completed an abdominal computed tomography (CT) scan as part of the body composition ancillary study were eligible for this analysis.
A total of 1,901 of the 1,974 participants with an abdominal CT scan had complete covariate data and were included in analysis. Approval from the Institutional Review Board was obtained at all six MESA study sites, and all participants provided written informed consent prior to the study.
2.2. Body Composition Measures
Abdominal CT scans were obtained between 2002 and 2005, with approximately half the study participants undergoing a CT scan at visit 2 and half at visit 3. An electron-beam CT scanner (Imatron C-150) was used at three clinical sites – Northwestern University, University of California Los Angeles, and Johns Hopkins University while multi-detector CT scanners (Sensation 64 GE lightspeed, Siemens S4 Volume Zoom, and Siemens Sensation 16) were used at the remaining three clinical sites – Columbia University, Wake Forest University, and University of Minnesota. CT scans were set at a collimation of 3mm with a slice thickness of 6 mm. CT scans were reconstructed using twenty-five 6-mm slices with a 35 cm field of view. In total, six cross-sectional slices were taken with 2 at L2/L3, 2 at L3/L4, and 2 at the L4/L5 intervertebral disc spaces. Research technologists responsible for interpreting CT scans were blinded to participants’ clinical information. The inter- and intra-rater reliability of measurements for total abdominal area as well as measurements for all muscle groups was 0.99 and 0.93–0.98 respectively.
Semi-automated measurements for total tissue, lean muscle, and adipose tissue were computed using Medical Imaging Processing Analysis and Visualization (MIPAV) software version 4.1.2 (National Institutes of Health, Bethesda, Maryland). Attenuation in each tissue compartment was measured in Hounsfield units (Hu). The four abdominal muscle groups analyzed include the psoas, paraspinous, oblique, and rectus muscles. Lean muscle tissue was defined as having an attenuation between 0 and 100 Hu while adipose tissue had an attenuation between −90 and −130 Hu.
Pixel density values were calculated using the six cross-sectional CT scan images of the L2/L3, L3/L4, and L4/L5 spine levels. Thereafter, abdominal muscle density, abdominal muscle area, and abdominal fat area were calculated. Abdominal muscle density was the average attenuation measurement within the desired muscle’s fascial plane that fell within the 0 to 100 Hu range. Abdominal muscle area was the summation of the number of pixels that fell within the 0 to 100 Hu range within the desired muscle’s fascial plane. Abdominal fat area was the summation of the number of pixels that fell within the −90 to −130 Hu range within the desired muscle’s fascial plane.
2.3. All Cause Mortality
Study participants were asked to return to one of the six clinics two years after initial baseline visit. Visit 2 took place between July 2002 and November 2003, and visit 3 took place between January 2004 and June 2005. Additionally, participants were asked to maintain regular phone contact every 9–12 months to report pertinent medical events. In the event of a study participant death, next of kin was contacted to provide information regarding the date and cause of death. This information was verified by the study team using death certificates. Follow up time was measured from the time of their CT scan.
2.4. Covariates
For each participant, the visit at which they had a CT scan was considered ‘baseline,’ and all covariate measures were taken from that visit. Study participants’ self-reported information regarding age, gender, race/ethnicity, alcohol intake, smoking status, and medication use was obtained via questionnaire. Questionnaires were standardized and administered at visits 1, 2, and 3. Data collection was matched to the visit at which the CT scan was taken. Height and weight were measured via stadiometer after patients removed shoes and were instructed to wear minimal clothing. Body mass index (BMI) was calculated by dividing weight in kg by height in meters squared. Information regarding physical activity levels and sedentary behavior were collected using the MESA Typical Week Physical Activity Survey, which was adapted from the Cross-Cultural Activity Participation Study.(17)
Baseline measurements for kidney function (eGFR ml/min/1.73m2) was measured using the CKD Epidemiology Collaboration (CKD-EPI) equation. Blood pressure was recorded 3 times after a 5-minute resting period using an automated sphygmomanometer (Dinamap automated oscillometric sphygmomanometer model Pro 100). The last two measurements were averaged and used for analysis. Data collection occurred at visits 2 and 3 and were matched to the visit at which the CT scan was taken.
Total cholesterol and HDL cholesterol were assessed using fasting venous blood samples with cholesterol esterase/cholesterol oxidase reaction (Roche Diagnostics, Indianapolis, Indiana) and triglyceride GB reagent (Roche Diagnostics, Indianapolis, Indiana). Depending on the triglyceride levels, the Friedewald formula (<400 mg/dL) and nuclear magnetic resonance spectroscopy (>400 mg/dL) were used to calculate LDL levels. Measurements were matched to the corresponding visit at which an abdominal CT scan was taken (visits 2 and 3). Fasting glucose levels measured using a Vitros analyzer (Johnson & Johnson Clinical Diagnostics, Rochester, New York) were used to categorize study participants as “normal” (<100 mg/dL), “impaired fasting glucose” (100–125 mg/dL), or “diabetic” (≥126 mg/dL) or use of diabetes medication.
2.5. Statistical Analyses/Calculations
All variables were assessed for normality and outliers. During this process, we noted that the distributions for muscle density and area had little to no overlap for men and women. As an additional preliminary step, we assessed whether the association between muscle density and mortality was modified by gender, and found a strong interaction term (p=0.06). Therefore, to provide the most informative analysis, all analyses were stratified by gender, consistent with previous studies (4, 18–20). We used Pearson correlations to assess correlations among body composition characteristics. Descriptive characteristics across gender and across gender-specific quartiles of total abdominal muscle density and muscle area were compared by ANOVA for continuous variables and chi-square for categorical variables.
We used progressively adjusted multivariable Cox proportional hazard models to study total mortality events as the dependent variable and gender-specific quartiles of muscle density and of muscle area as the key independent variables. Muscle area and density were entered simultaneously so each analysis was mutually adjusted for muscle area and density. Models were also run separately for area and density without mutual adjustment and no appreciable differences were found, therefore models were run with mutual adjustment to highlight independent associations. Quartiles of muscle composition were modeled to avoid assumption of a linear association and better portray the nature of the relationship. Model 1 adjusted for age, race/ethnicity and height. Model 2 included these variables in addition to CVD risk factors and mortality confounders (systolic blood pressure, antihypertensive medication use, total cholesterol, HDL cholesterol, statin use, cigarette smoking, diabetes, cancer history and kidney function). Model 3 included Model 2 variables in addition to physical activity and sedentary time. To assess the independent contribution of muscle composition characteristics in relationship to adiposity, Model 4 added visceral fat and BMI. Because quartile analyses were done with gender-specific quartiles, we also converted abdominal muscle and density into z-scores for the whole sample (men and women) and conducted progressively adjusted Cox models continuously per SD to assess linear associations between muscle variables and mortality and to allow for more direct comparison of results between men and women.
The dose-response relation of all-cause mortality risk with the continuous variables of abdominal muscle density and muscle area were examined in 2 steps. First, we tested the dose-response trajectory for nonlinearity by repeating model 4 after including restricted cubic spline functions of muscle density and muscle area using the Regression Modeling Strategies (rms) package in R (R Foundation for Statistical Computing; Vienna, Austria). To test whether the shapes of the dose-response trajectories were sensitive to the number of knots used, we ran models with 3 and 4 knots placed at the 10th, 50th, and 90th and the 5th, 35th, 65th, and 95th percentiles, respectively. Plots of the dose-response trajectories were reviewed for each outcome for each model fit, and χ2 tests for nonlinearity were performed. After determining the most appropriate functional form of the dose-response trajectories, we plotted them for each exposure, specifying the 10th percentile of muscle density/muscle area distribution as the referent category. Both muscle density and muscle area were converted to z-scores to allow visual overlay on the same plot. The trajectories were not meaningfully different when modeled with 3 or 4 knots, so χ2 tests were performed for restricted cubic spline models with 3 knots to maximize statistical power.
Proportional hazards assumptions were tested by including a multiplicative interaction term of muscle characteristic by time in the model and assessing for significant interaction. All results were nonsignificant. Tests for linear trend across quartiles were conducted by treating each muscle quartile as a continuous linear variable in the regression models. To assess for effect modification, the fully adjusted model (Model 3) included multiplicative interaction terms for each muscle characteristic with age and race/ethnicity.
3. Results
3.1. Baseline characteristics.
Table 1 shows baseline sample characteristics for the whole sample, and for men and women separately. Men had lower total cholesterol (184 vs. 198mg/dL), were more physically active and less sedentary, but were also more likely to have diabetes (15.6% vs. 12%) and be current smokers (13.4% vs. 10.3%). Compared to men, women had lower muscle area (80.4 vs. 116.4 cm2/m2), lower mean muscle density (40.1 vs. 44.5 Hu) and less visceral fat (131.1 vs. 161.7 cm2), but higher subcutaneous fat (296.6 vs. 211.6 cm2).
Table 1.
Baseline sample characteristics (N=1901): MESA (2002–2005)
| Overall | Men | Women | p-valuea | |
|---|---|---|---|---|
| N | 1901 | 946 | 955 | |
| Age [years], mean (SD) | 62.0 (9.7) | 61.5 (10.1) | 62.5 (9.4) | 0.04 |
| Race/Ethnicity, n (%) | 0.18 | |||
| Non-Hispanic White | 762 (40.1) | 394 (41.6) | 368 (38.5) | |
| Chinese American | 251 (13.2) | 133 (14.1) | 118 (12.4) | |
| Black | 398 (20.9) | 173 (18.3) | 225 (23.6) | |
| Hispanic | 490 (25.8) | 246 (26) | 244 (25.5) | |
| Baseline Health/Behavior Characteristics | ||||
| Systolic BP [mmHg], mean (SD) | 124.8 (21.1) | 123.6 (19.2) | 125.9 (22.8) | 0.015 |
| Antihypertensive Use, n (%) | 778 (40.9) | 367 (38.8) | 411 (43.0) | 0.11 |
| Total Cholesterol [mg/dL], mean (SD) | 191.1 (35.2) | 184.0 (34.4) | 198.0 (34.7) | <0.001 |
| HDL Cholesterol [mg/dL], mean (SD) | 51.1 (15.0) | 45.8 (12.0) | 56.4 (15.8) | <0.001 |
| Statin Use, n (%) | 380 (20) | 183 (19.3) | 197 (20.6) | 0.52 |
| Diabetes, n (%) | <0.001 | |||
| Normal | 1380 (72.6) | 646 (68.3) | 734 (76.9) | |
| Impaired Fasting Glucose | 258 (13.6) | 152 (16.1) | 106 (11.1) | |
| Diabetes | 263 (13.8) | 148 (15.6) | 115 (12.0) | |
| Cigarette Use, n (%) | <0.001 | |||
| Never | 913 (48.0) | 362 (38.3) | 551 (57.7) | |
| Former | 763 (40.1) | 457 (48.3) | 306 (32.0) | |
| Current | 225 (11.9) | 127 (13.4) | 98 (10.3) | |
| Physical Activity [met-min/week], mean (SD) | 4,945.2 (4716.6) | 5,666.8 (5357.3) | 4,231.9 (3855.6) | <0.001 |
| Sedentary Time [hr/day], mean (SD) | 3.3 (2.1) | 3.2 (2.0) | 3.5 (2.2) | 0.004 |
| Baseline Body Composition Measures | ||||
| Abdominal Muscle Density [Hu], mean (SD) | 42.2 (5.5) | 44.5 (4.9) | 40.1 (5.2) | <0.001 |
| Abdominal Muscle Area [cm2/m2], mean (SD) | 98.3 (27.6) | 116.4 (23.9) | 80.4 (17.4) | <0.001 |
| Abdominal Visceral Fat Area [cm2], mean (SD) | 146.4 (68.0) | 161.7 (71.4) | 131.1 (60.8) | <0.001 |
| Body Mass Index [kg/m2], mean (SD) | 28.0 (5.1) | 27.6 (4.2) | 28.3 (5.7) | 0.003 |
| Abdominal Subcutaneous Fat Area [cm2], mean (SD) | 253.8 (117.8) | 211.6 (95.0) | 296.6 (122.9) | <0.001 |
| Waist Circumference [cm], mean (SD) | 95.7 (12.9) | 98.4 (11.5) | 97.1 (15.7) | 0.04 |
| Height [cm], mean (SD) | 166.3 (9.9) | 172.9 (7.6) | 159.7 (7.2) | <0.001 |
Calculated from ANOVA for continuous or Chi-square for categorical variables
Abbreviations: MESA, Multi-Ethnic Study of Atherosclerosis; SD, standard deviation; BP, blood pressure; HDL, high density lipoprotein.
Baseline characteristics stratified by muscle density quartiles are shown in Table 2 (men) and Table 3 (women). For both men and women, those with greater muscle density were younger, had lower systolic blood pressure, were less likely to use anti-hypertensives and statins, had lower rates of diabetes, and were more physically active and less sedentary (for all p-trend<0.01). Those with greater density also tended to have greater muscle area, less visceral and subcutaneous fat, lower BMI, and smaller waist circumference (for all p-trend <0.01).
Table 2.
Sample Characteristics by Muscle Density Quartiles in Men (n=946): MESA (2002–2005)
| 27.5–40.9 Hu | 40.9–45.0 Hu | 45.0–48.0 Hu | 48.0–56.8 Hu | ||
|---|---|---|---|---|---|
| n=236 | n=237 | n=236 | n=237 | ||
| Age [years], mean (SD) | 70.6 (9.0) | 65.7 (9.4) | 62.4 (9.2) | 58.0 (7.5) | <0.001 |
| Race/Ethnicity, n (%) | <0.001 | ||||
| Non-Hispanic White | 125 (53.0) | 95 (40.1) | 94 (39.8) | 80 (33.8) | |
| Chinese American | 21 (8.9) | 29 (12.2) | 44 (18.6) | 39 (16.5) | |
| Black | 26 (11.0) | 37 (15.6) | 39 (16.5) | 71 (30.0) | |
| Hispanic | 64 (27.1) | 76 (32.1) | 59 (25.0) | 47 (19.8) | |
| Baseline Health/Behavior Characteristics | |||||
| Systolic BP [mmHg], mean (SD) | 126.8 (19.5) | 125.3 (20.3) | 121.3 (18.5) | 121.7 (18.0) | 0.003 |
| Antihypertensive Use, n (%) | 114 (48.3) | 93 (39.2) | 84 (35.6) | 76 (32.1) | 0.002 |
| Total Cholesterol [mg/dL], mean (SD) | 177.8 (35.0) | 184.4 (34.5) | 185.9 (32.9) | 187.6 (34.9) | 0.011 |
| HDL Cholesterol [mg/dL], mean (SD) | 44.4 (12.2) | 45.8 (12.7) | 46.2 (12.3) | 46.4 (10.9) | 0.272 |
| Statin Use, n (%) | 59 (25.0) | 52 (21.9) | 37 (15.7) | 35 (14.8) | 0.011 |
| Diabetes, n (%) | 0.001 | ||||
| Normal | 142 (60.2) | 154 (65.0) | 165 (69.9) | 185 (78.1) | |
| Impaired Fasting Glucose | 46 (19.5) | 37 (15.6) | 44 (18.6) | 25 (10.5) | |
| Diabetes | 48 (20.3) | 46 (19.4) | 27 (11.4) | 27 (11.4) | |
| Cigarette Use, n (%) | 0.343 | ||||
| Never | 78 (33.1) | 95 (40.1) | 94 (39.8) | 95 (40.1) | |
| Former | 128 (54.2) | 111 (46.8) | 104 (44.1) | 114 (48.1) | |
| Current | 30 (12.7) | 31 (13.1) | 38 (16.1) | 28 (11.8) | |
| Physical Activity [met-min/week], mean (SD) | 4,308.7 (4,170.9) | 5,402.6 (4,768.3) | 6,043.8 (5,913.9) | 6,802.5 (6,039.1) | <0.001 |
| Sedentary Time [hr/day], mean (SD) | 3.7 (2.2) | 3.3 (2.2) | 3.1 (1.9) | 2.7 (1.6) | <0.001 |
| Baseline Body Composition Measures | |||||
| Abdominal Muscle Density [Hu], mean (SD) | 37.6 (2.5) | 43.3 (1.1) | 46.5 (0.9) | 50.2 (1.7) | <0.001 |
| Abdominal Muscle Area [cm2/m2], mean (SD) | 102.99 (20.95) | 112.70 (22.56) | 120.18 (21.67) | 130.38 (21.59) | <0.001 |
| Abdominal Visceral Fat Area [cm2], mean (SD) | 201.9 (80.9) | 171.6 (64.6) | 145.9 (61.4) | 128.1 (55.2) | <0.001 |
| Body Mass Index [kg/m2], mean (SD) | 29.2 (5.0) | 27.6 (4.2) | 26.9 (3.8) | 27.0 (3.6) | <0.001 |
| Abdominal Subcutaneous Fat Area [cm2], mean (SD) | 236.8 (102.2) | 218.3 (99.7) | 200.9 (92.9) | 195.2 (81.3) | <0.001 |
| Waist Circumference [cm], mean (SD) | 104.2 (12.8) | 99.1 (11.2) | 96.1 (10.6) | 94.9 (9.7) | <0.001 |
| Height [cm], mean (SD) | 172.4 (7.3) | 172.6 (7.9) | 173.2 (7.5) | 173.8 (7.7) | <0.001 |
Calculated from ANOVA for continuous or Chi-square for categorical variables
Abbreviations: MESA, Multi-Ethnic Study of Atherosclerosis; SD, standard deviation; BP, blood pressure; HDL, high density lipoprotein.
Table 3.
Sample Characteristics by Muscle Density Quartiles in Women (n=955): MESA (2002–2005)
| 25.9–35.3 Hu | 36.3–40.3 Hu | 40.3–43.9 Hu | 43.9–54.1 Hu | ||
|---|---|---|---|---|---|
| n=238 | n=239 | n=238 | n=240 | ||
| Age [years], mean (SD) | 71.2 (8.4) | 66.8 (8.6) | 63.8 (8.5) | 58.7 (7.3) | <0.001 |
| Race/Ethnicity, n (%) | <0.001 | ||||
| Non-Hispanic White | 92 (38.7) | 121 (50.6) | 93 (39.1) | 62 (25.8) | |
| Chinese | 28 (11.8) | 25 (10.5) | 33 (13.9) | 32 (13.3) | |
| Black | 38 (16.0) | 38 (15.9) | 56 (23.5) | 93 (38.8) | |
| Hispanic | 80 (33.6) | 55 (23.0) | 56 (23.5) | 53 (22.1) | |
| Baseline Health/Behavior Characteristics | |||||
| Systolic BP [mmHg], mean (SD) | 131.6 (23.8) | 128.2 (22.9) | 123.7 (21.5) | 120.7 (21.4) | <0.001 |
| Antihypertensive Use, n (%) | 139 (58.4) | 117 (49.0) | 84 (35.4) | 71 (29.6) | <0.001 |
| Total Cholesterol [mg/dL], mean (SD) | 196.1 (36.0) | 201.5 (33.7) | 197.0 (33.9) | 197.1 (35.2) | 0.328 |
| HDL Cholesterol [mg/dL], mean (SD) | 54.3 (13.7) | 56.7 (16.9) | 58.3 (16.5) | 56.3 (15.6) | 0.053 |
| Statin Use, n (%) | 66 (27.7) | 47 (19.7) | 49 (20.7) | 35 (14.6) | <0.001 |
| Diabetes, n (%) | 0.006 | ||||
| Normal | 166 (69.7) | 176 (73.6) | 193 (81.1) | 199 (82.9) | |
| Impaired Fasting Glucose | 34 (14.3) | 32 (13.4) | 17 (7.1) | 23 (9.6) | |
| Diabetes | 38 (16.0) | 31 (13.0) | 28 (11.8) | 18 (7.5) | |
| Cigarette Use, n (%) | 0.048 | ||||
| Never | 138 (58.0) | 142 (59.4) | 137 (57.6) | 134 (55.8) | |
| Former | 86 (36.1) | 76 (31.8) | 74 (31.1) | 70 (29.2) | |
| Current | 14 (5.9) | 21 (8.8) | 27 (11.3) | 36 (15.0) | |
| Physical Activity [met-min/week], mean (SD) | 3,577.2 (3,805.7) | 4,319.8 (4,297.3) | 4,107.6 (3,851.4) | 5,032.1 (3,787.7) | 0.001 |
| Sedentary Time [hr/day], mean (SD) | 3.8 (2.3) | 3.6 (2.2) | 3.5 (2.2) | 3.0 (2.0) | <0.001 |
| Baseline Body Composition Measures | |||||
| Abdominal Muscle Density [Hu], mean (SD) | 33.2 (2.5) | 38.3 (1.2) | 42.1 (1.0) | 46.5 (2.1) | <0.001 |
| Abdominal Muscle Area [cm2/m2], mean (SD) | 66.65 (12.66) | 78.79 (14.10) | 82.98 (15.03) | 93.26 (16.16) | <0.001 |
| Abdominal Visceral Fat Area [cm2], mean (SD) | 166.3 (65.0) | 142.6 (61.8) | 117.3 (52.0) | 99.2 (41.5) | <0.001 |
| Body Mass Index [kg/m2], mean (SD) | 30.5 (6.2) | 28.8 (5.8) | 27.1 (5.2) | 27.0 (4.9) | <0.001 |
| Abdominal Subcutaneous Fat Area [cm2], mean (SD) | 328.0 (136.5) | 299.5 (123.7) | 284.6 (114.4) | 281.0 (114.9) | <0.001 |
| Waist Circumference [cm], mean (SD) | 105.1 (16.3) | 99.2 (15.5) | 93.5 (13.5) | 91.0 (13.8) | <0.001 |
| Height [cm], mean (SD) | 157.6 (7.1) | 160.0 (7.4) | 160.4 (6.8) | 161.4 (6.9) | <0.001 |
Calculated from ANOVA for continuous or Chi-square for categorical variables
Abbreviations: MESA, Multi-Ethnic Study of Atherosclerosis; SD, standard deviation; BP, blood pressure; HDL, high density lipoprotein.
Pearson correlations between various body composition characteristics are shown overall and separately for men and women in Table 4. The strongest correlations were found between BMI, subcutaneous fat, and waist circumference (r > 0.8 for all pairs for both genders), while correlations between muscle measures and other measures of body composition were smaller (though still statistically significant). For both men and women, muscle density was positively correlated with muscle area (r = 0.43 and 0.51, respectively). Associations between muscle density and all other measures of body composition were inverse and moderate. In general, associations between muscle area and other measures of body composition were smaller than those with muscle density.
Table 4a-c.
Correlation Matrix for Abdominal Body Composition Characteristics (n= 1,901): MESA Body Composition (2002–2005)
| Density | Area | VF | BMI | WC | SF | H | |
|---|---|---|---|---|---|---|---|
| Density | 1 | 0.6 | −0.29 | −0.25 | −0.3 | −0.28 | 0.35 |
| Area | 1 | 0.18 | 0.12 | 0.11 | −0.13 | 0.59 | |
| VF | 1 | 0.56 | 0.67 | 0.32 | 0.15 | ||
| BMI | 1 | 0.87 | 0.79 | −0.03* | |||
| WC | 1 | 0.73 | 0.14 | ||||
| SF | 1 | −0.13 | |||||
| H | 1 | ||||||
| Density | Area | VF | BMI | WC | SF | H | |
| Density | 1 | 0.45 | −0.41 | −0.22 | −0.32 | −0.17 | 0.08 |
| Area | 1 | 0.10* | 0.31 | 0.21 | 0.21 | 0.28 | |
| VF | 1 | 0.57 | 0.67 | 0.45 | 0.06* | ||
| BMI | 1 | 0.89 | 0.83 | 0.07 | |||
| WC | 1 | 0.85 | 0.25 | ||||
| SF | 1 | 0.21 | |||||
| H | 1 | ||||||
| Density | Area | VF | BMI | WC | SF | H | |
| Density | 1 | 0.58 | −0.45 | −0.26 | −0.38 | −0.17 | 0.17 |
| Area | 1 | −0.04* | 0.14* | 0* | 0.1 | 0.25 | |
| VF | 1 | 0.64 | 0.71 | 0.48 | −0.06* | ||
| BMI | 1 | 0.87 | 0.85 | −0.02* | |||
| WC | 1 | 0.82 | 0.07 | ||||
| SF | 1 | 0.12 | |||||
| H | 1 |
Reported are Pearson correlations among non-missing observations. P-value < 0.05 unless indicated by *. Abbreviations: MESA, Multi-Ethnic Study of Atherosclerosis; MD, muscle density; MA, muscle area; VF, visceral fat; BMI, body mass index; SF, subcutaneous fat; WC, waist circumference; H, height
3.2. Muscle characteristics and mortality.
Mean follow-up time for all-cause mortality was 10.6 (2.5) years for men and 10.9 (2.2) years for women. Women had a lower overall mortality rate (12.5% vs. 19.9%, p < 0.01). Mortality rates varied markedly across quartiles of muscle area and density, with the highest mortality rate in the lowest quartiles for both area and density and the lowest mortality rate in the highest quartiles. This was true for both men (Table 5) and women (Table 6). Associations of muscle area and density and mortality by gender-specific quartiles and continuously by whole sample standard deviations (men and women together) are shown for men in Table 5 and for women in Table 6.
Table 5.
Multivariable Associations of Abdominal Muscle Density and Muscle Area with Total Mortality in Men (N=946): MESA Body Composition (2002–2015)
| Quartile 1 | Quartile 2 | Quartile 3 | Quartile 4 | p-trend | Continuous | ||
|---|---|---|---|---|---|---|---|
| Density (Hu) | 27.5–40.9 | 40.9–45.0 | 45.0–48.0 | 43.9–54.1 | Per SD* | p | |
| Area (cm2) | 15.9–33.3 | 33.3–38.3 | 38.3–44.1 | 44.1–75.6 | |||
| Unadjusted deaths, n (%) | |||||||
| Density | 98 (41.5) | 48 (20.3) | 27 (11.4) | 15 (6.3) | <0.001 | ||
| Area | 80 (34.2) | 39 (15.4) | 39 (15.3) | 30 (11.6) | <0.001 | ||
| Model 1 | |||||||
| Density | 1 (ref) | 0.58 (0.40–0.83) | 0.36 (0.23–0.57) | 0.25 (0.14–0.47) | <0.001 | 0.56 (0.47–0.67) | <0.001 |
| Area | 1 (ref) | 0.91 (0.63–1.32) | 0.99 (0.63–1.56) | 1.18 (0.73–1.93) | 0.580 | 1.14 (0.92–1.42) | 0.22 |
| Model 2 | |||||||
| Density | 1 (ref) | 0.59 (0.41–0.85) | 0.37 (0.23–0.59) | 0.29 (0.16–0.54) | <0.001 | 0.57 (0.47–0.69) | <0.001 |
| Area | 1 (ref) | 0.87 (0.59–1.28) | 0.88 (0.55–1.41) | 1.03 (0.62–1.72) | 0.960 | 1.09 (0.87–1.36) | 0.46 |
| Model 3 | |||||||
| Density | 1 (ref) | 0.60 (0.42–0.87) | 0.39 (0.24–0.62) | 0.32 (0.17–0.59) | <0.001 | 0.58 (0.48–0.71) | <0.001 |
| Area | 1 (ref) | 0.90 (0.61–1.32) | 0.85 (0.53–1.37) | 1.10 (0.66–1.83) | 0.945 | 1.13 (0.90–1.42) | 0.29 |
| Model 4 | |||||||
| Density | 1 (ref) | 0.57 (0.39–0.83) | 0.33 (0.20–0.55) | 0.27 (0.14–0.51) | <0.001 | 0.51 (0.41–0.64) | <0.001 |
| Area | 1 (ref) | 0.93 (0.63–1.39) | 0.91 (0.57–1.48) | 1.31 (0.77–2.22) | 0.515 | 1.25 (0.99–1.58) | 0.07 |
Table 6.
Multivariable Associations of Abdominal Muscle Density and Muscle Area with Total Mortality in Women (N=955): MESA Body Composition (2002–2015)
| Quartile 1 | Quartile 2 | Quartile 3 | Quartile 4 | Continuous | |||
|---|---|---|---|---|---|---|---|
| Density (Hu) | 25.9–36.3 | 36.3–40.3 | 40.3–43.9 | 43.9–54.1 | p-trend | Per SD* | p |
| Area (cm2) | 13.7–26.7 | 26.7–30.9 | 30.9–35.7 | 35.7–57.1 | |||
| Unadjusted deaths, n (%) | |||||||
| Density | 56 (23.1) | 30 (11.5) | 23 (8.6) | 10 (3.7) | <0.001 | ||
| Area | 44 (17.2) | 36 (13.9) | 21 (8.0) | 18 (6.7) | <0.001 | ||
| Model 1 | |||||||
| Density | 1 (ref) | 0.61 (0.38–0.98) | 0.56 (0.33–0.97) | 0.34 (0.15–0.74) | 0.004 | 0.72 (0.56–0.93) | 0.01 |
| Area | 1 (ref) | 1.03 (0.64–1.65) | 1.06 (0.59–1.91) | 1.38 (0.71–2.67) | 0.472 | 1.17 (0.78–1.75) | 0.45 |
| Model 2 | |||||||
| Density | 1 (ref) | 0.65 (0.40–1.07) | 0.62 (0.35–1.09) | 0.40 (0.18–0.91) | 0.020 | 0.80 (0.61–1.05) | 0.11 |
| Area | 1 (ref) | 0.95 (0.58–1.56) | 0.92 (0.50–1.69) | 1.07 (0.53–2.16) | 0.995 | 1.00 (0.65–1.53) | 0.99 |
| Model 3 | |||||||
| Density | 1 (ref) | 0.65 (0.39–1.06) | 0.60 (0.34–1.06) | 0.40 (0.18–0.91) | 0.018 | 0.79 (0.61–1.04) | 0.09 |
| Area | 1 (ref) | 0.97 (0.59–1.59) | 0.95 (0.51–1.74) | 1.13 (0.56–2.32) | 0.882 | 1.05 (0.68–1.62) | 0.84 |
| Model 4 | |||||||
| Density | 1 (ref) | 0.67 (0.40–1.10) | 0.63 (0.35–1.14) | 0.43 (0.18–1.01) | 0.042 | 0.79 (0.59–1.06) | 0.12 |
| Area | 1 (ref) | 0.97 (0.59–1.60) | 0.94 (0.51–1.73) | 1.11 (0.54–2.29) | 0.925 | 1.05 (0.67–1.63) | 0.85 |
Data are hazard ratio (95% confidence interval); Model 1 adjusts for age, race/ethnicity and height; Model 2 adjusts for Model 1 + diabetes, systolic blood pressure, antihypertensive medication, total cholesterol, HDL cholesterol, statin use, cigarette smoking, cancer history and kidney function; Model 3 adjusts for Model 2 + physical activity and sedentary time; Model 4 adjusts for Model 3 + visceral fat and BMI.
Whole sample standard deviation (men and women together)
3.3. Muscle characteristics and mortality in men.
For men, greater muscle density was associated with lower risk of mortality. This risk of mortality decreased across quartiles of muscle density (p-trend <0.001), with men in the highest quartile of density having one quarter the risk of death of those in the lowest quartile (HR= 0.27, 95% CI 0.14–0.51) in fully adjusted models. There was very little attenuation of this association after adjusting for other covariates. In continuous models per standard deviation, each SD increase in density was associated with approximately half the mortality risk in fully adjusted models (HR = 0.51, 95% CI 0.41–0.64; p <0.001).
Muscle area, conversely, showed little association with mortality. In fully adjusted models, men in the second and third quartiles showed slightly lower risk of mortality compared to those in the first quartile (HR = 0.93, 95% CI 0.63–1.39; 0.91, 95% CI 0.57–1.48, respectively) while those in the highest quartile showed an increase in mortality (HR = 1.31, 95% CI 0.77–2.22); however, none of these associations reached levels of statistical significance. Each SD increase in area was associated with approximately 25% increased risk of mortality in fully adjusted models (HR = 1.25, 95% CI 0.99–1.58), which approached significance (p-trend 0.07).
Figure 1a shows the continuous dose-response associations of muscle density and muscle area with all-cause mortality in men. The overall association for density was significant (p<0.001) and linear (p for non-linear = 0.52), with mortality risk decreasing with greater muscle density. The association for area was marginally significant (p=0.05), suggesting a threshold association (p for non-linear = 0.08) such that muscle area above the mean was associated with increasing risk of mortality.
Figure 1a. Associations of Abdominal Muscle Density and Area with Total Mortality in Men (n= 931): MESA Body Composition (2002–2015).
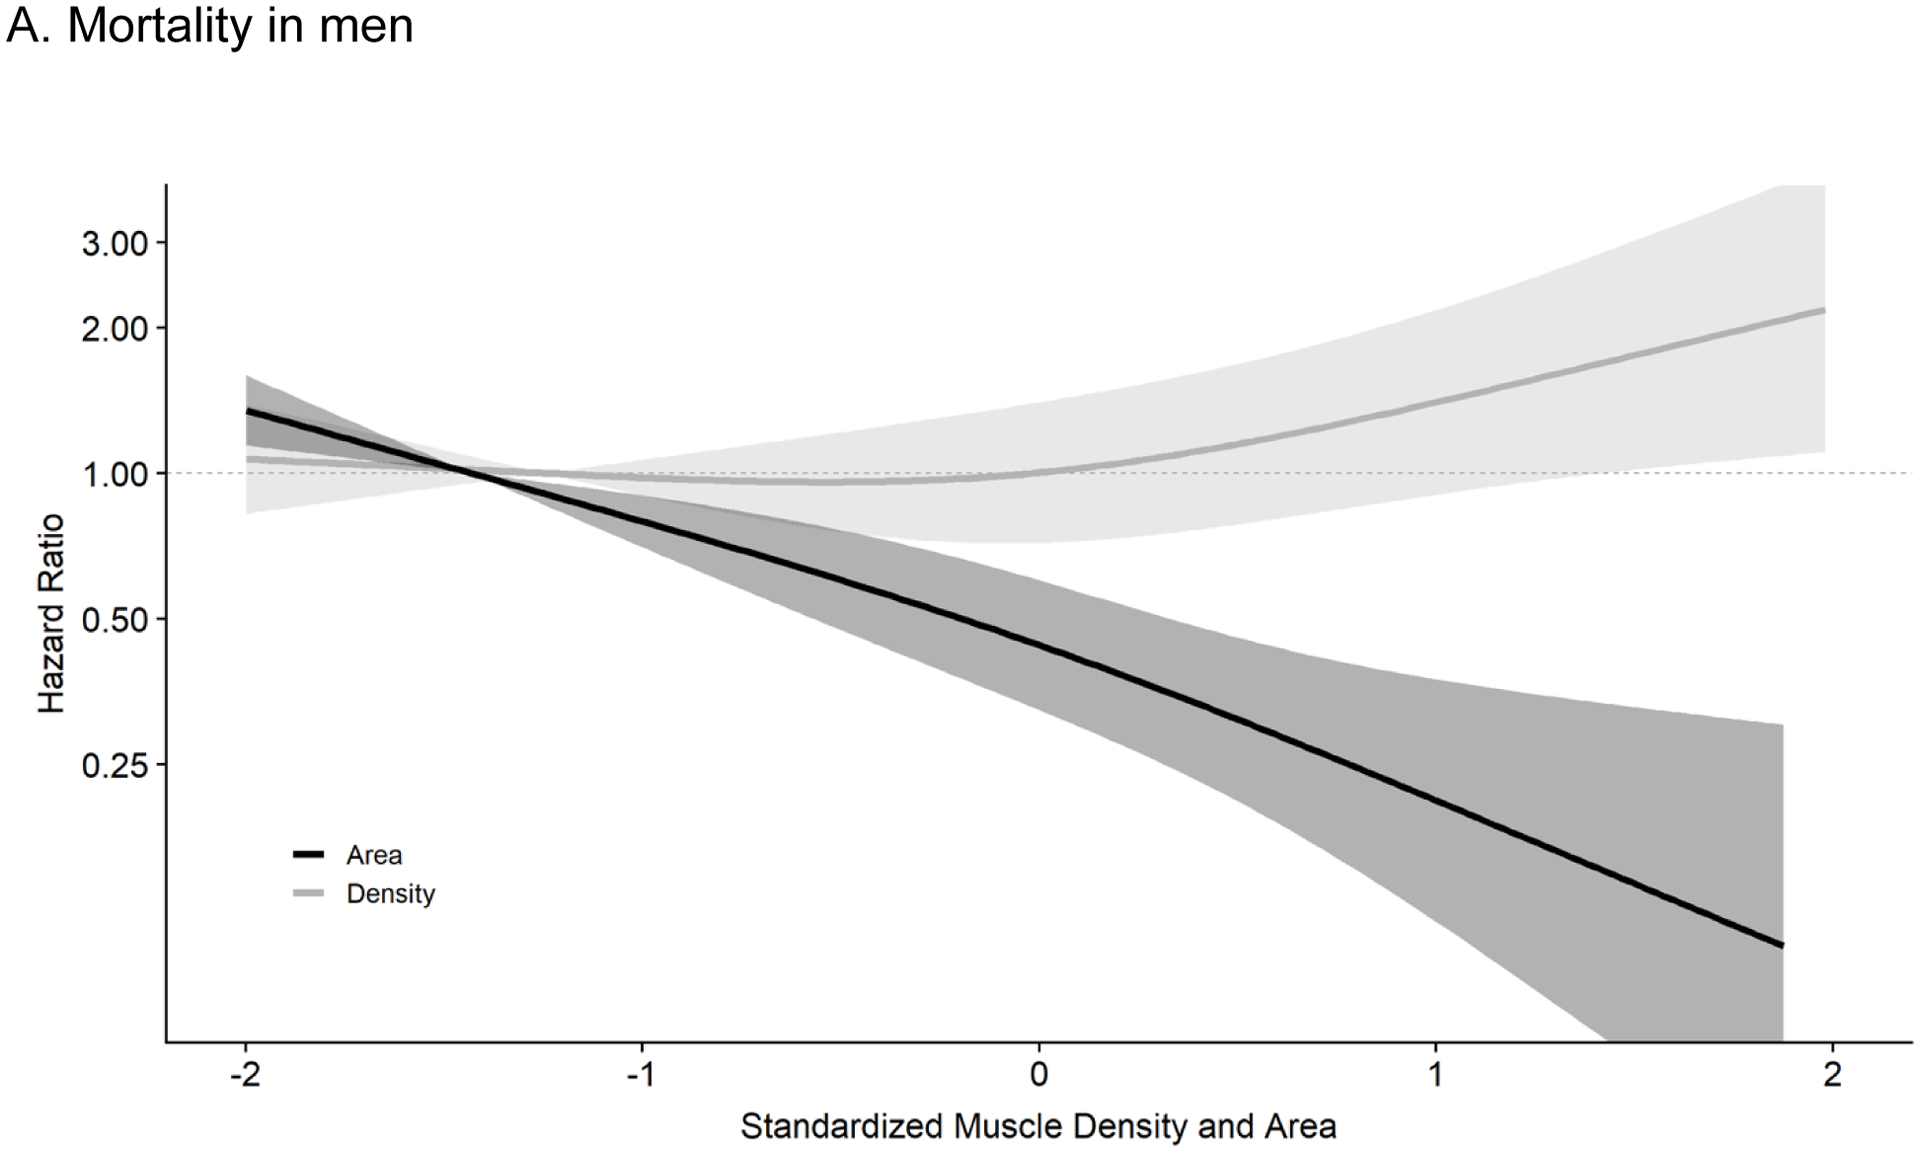
Results are from cox proportional hazard models mutually adjusting for muscle density and muscle area using restricted cubic splines with 3 knots controlling for age, race/ethnicity, height, systolic BP, antihypertensive use, total cholesterol, HDL cholesterol, statin use, diabetes, smoking history, cancer history, kidney function, physical activity, sedentary time, visceral fat and BMI. The reference was set at the 10th percentile for density (37.4 Hu) and area (86.6 cm2). Respective HRs and 95% CIs for the 25th (40.9 Hu), 50th (45.0 Hu), 75th (48.0 Hu), 90th (50.3 Hu) and 95th (51.5 Hu) percentile of muscle density (compared to reference) were 0.68 (0.56–0.82), 0.41 (0.29–0.56), 0.26 (0.16–0.41), 0.18 (0.09–0.35), and 0.15 (0.07–0.33). For muscle area (compared to reference), the HRs and 95% CIs for the 25th (99.1 cm2), 50th (115.2 cm2), 75th (132.9 cm2), 90th (148.1 cm2) and 95th (156.0 cm2) percentile were 0.96 (0.81–1.15), 0.99 (0.72–1.38), 1.23 (0.83–1.84), 1.62 (0.98–2.68), and 1.88 (1.05–3.39), respectively. Results were trimmed at the 1st and 99th percentiles. Density: p-overall <0.001, p-non-linear= 0.52, Area: p-overall= 0.05, p-non-linear= 0.08.
Abbreviations: MESA, Multi-ethnic Study of Atherosclerosis; BP, blood pressure; HDL, high density lipoprotein; BMI, body mass index; HR, hazard ratio; CI, confidence interval
3.4. Muscle characteristics and mortality in women.
Results for women were similar (Table 6). Specifically, mortality risk decreased over quartiles of greater muscle density, with those in the highest quartile experiencing one-third the risk of death in minimally adjusted models (HR = 0.34, 95% CI 0.15–0.74). This was only slightly attenuated after adjusting for other risk factors, physical activity, and body composition (HR = 0.43, 95% CI 0.18–1.01). Each SD increase in density was associated with approximately 20% reduction in mortality in fully adjusted models (HR = 0.79, 95% CI 0.59–1.06; p-trend 0.12).
Conversely, and similar to males, muscle area showed little association with mortality. The highest quartile of muscle area showed an increased mortality risk compared to the lowest (HR = 1.38, 95% CI 0.71–2.67); however, this was not statistically significant, and the effect was reduced when adjusting for other covariates (HR = 1.11, 95% CI 0.54–2.29).
Figure 1b shows continuous dose-response associations of muscle density and area in women. While the overall association for muscle density was not statistically significant (p-overall= 0.22), the shape of the association shows that increasing muscle density is associated with decreasing mortality risk. There was no association of muscle area with mortality in women (p-overall = 0.99).
Figure 1b. Associations of Abdominal Muscle Density and Area with Total Mortality in Women (n= 941): MESA Body Composition (2002–2015).
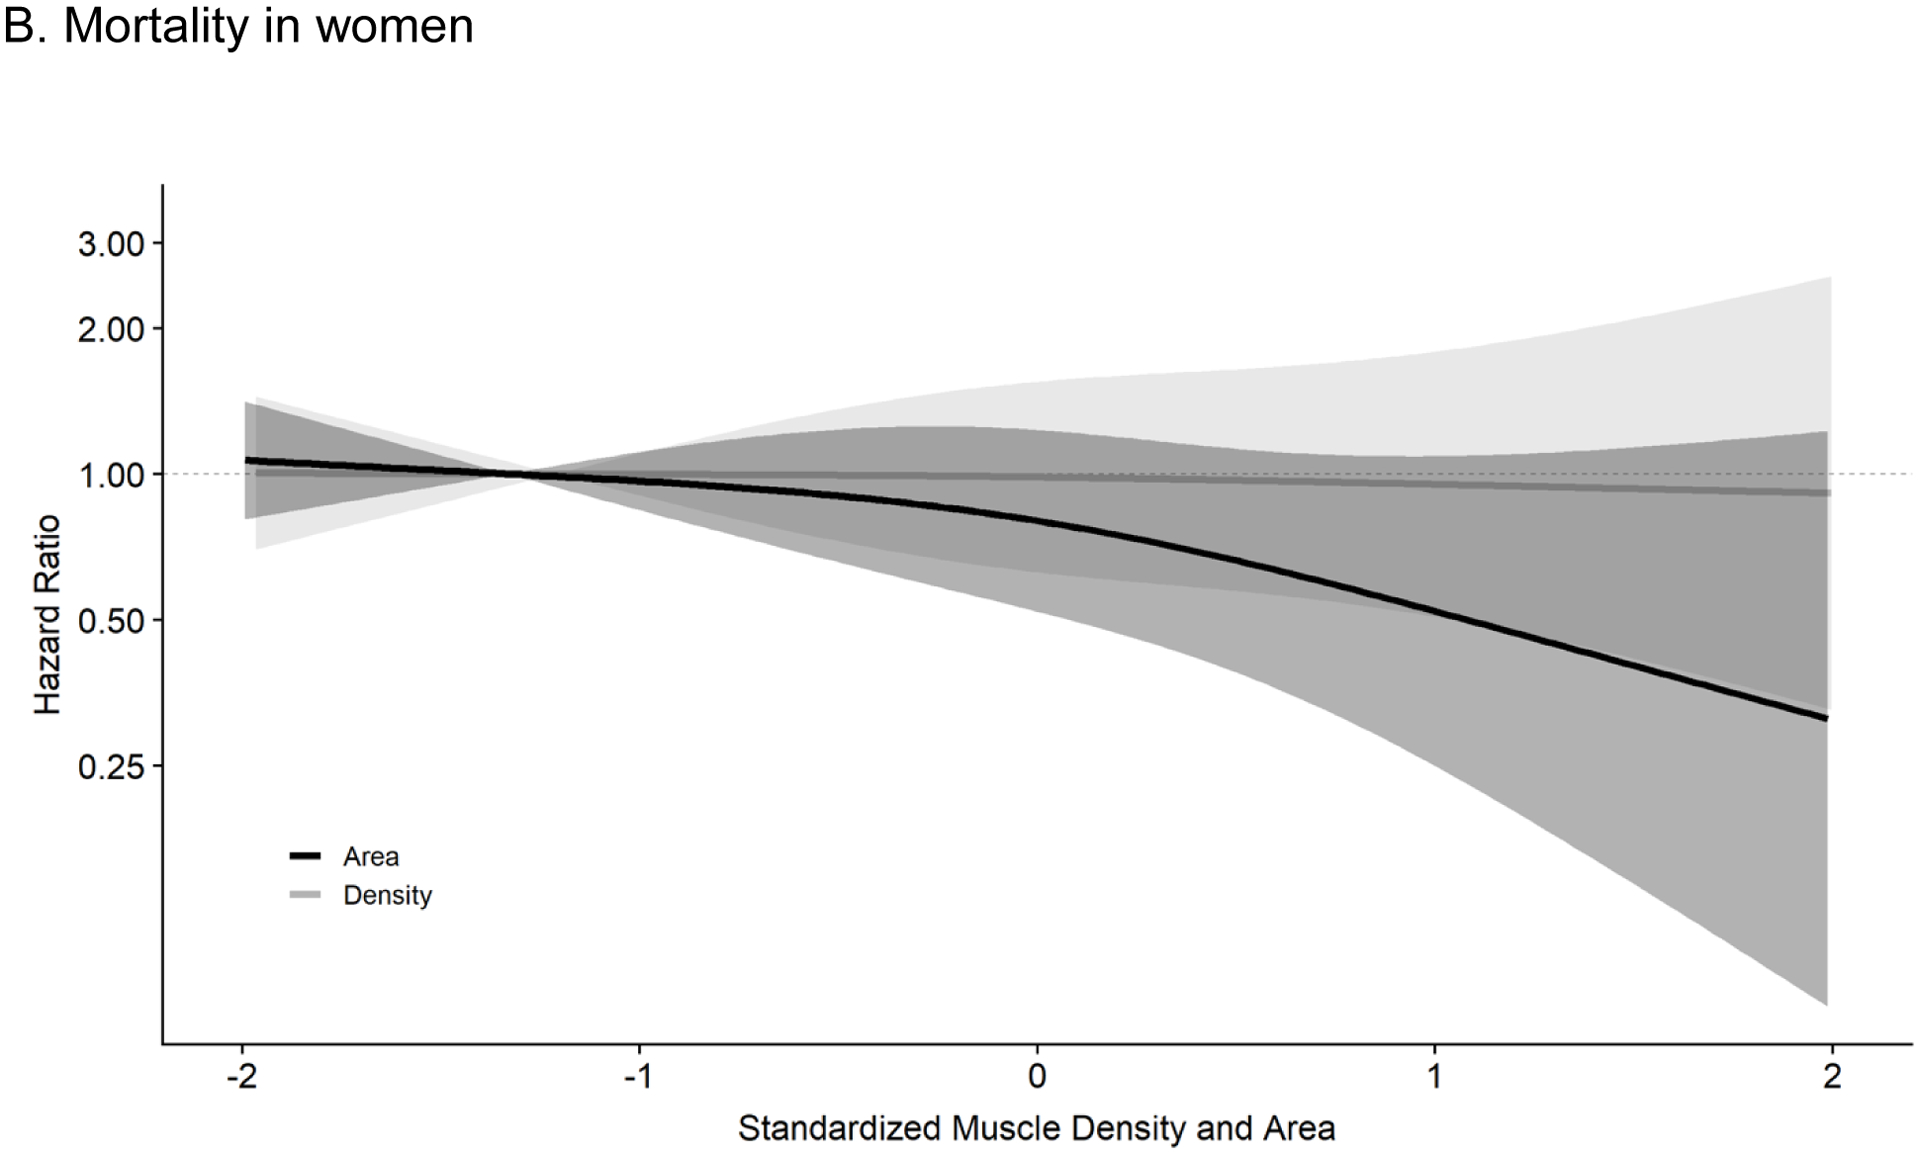
Results are from cox proportional hazard models mutually adjusting for muscle density and muscle area using restricted cubic splines with 3 knots controlling for age, race/ethnicity, height, systolic BP, antihypertensive use, total cholesterol, HDL cholesterol, statin use, diabetes, smoking history, cancer history, kidney function, physical activity, sedentary time, visceral fat and BMI. The reference was set at the 10th percentile for density (33.1 Hu) and area (59.3 cm2). Respective HRs and 95% CIs for the 25th (36.3 Hu), 50th (40.3 Hu), 75th (43.9 Hu), 90th (46.6 Hu) and 95th (48.3 Hu) percentile of muscle density (compared to reference) were 0.93 (0.73–1.19), 0.79 (0.51–1.22), 0.59 (0.32–1.09), 0.46 (0.19–1.10), and 0.38 (0.13–1.15). For muscle area (compared to reference), the HRs and 95% CIs for the 25th (67.7 cm2), 50th (79.1 cm2), 75th (92.0 cm2), 90th (103.8 cm2) and 95th (111.5 cm2) percentile were 1.00 (0.80–1.25), 0.99 (0.64–1.53), 0.97 (0.55–1.68), 0.94 (0.44–1.98), and 0.92 (0.36–2.35), respectively. Results were trimmed at the 1st and 99th percentiles. Density: p-overall= 0.22, p-non-linear= 0.41, Area: p-overall= 0.99, p-non-linear= 0.93.
Abbreviations: MESA, Multi-ethnic Study of Atherosclerosis; BP, blood pressure; HDL, high density lipoprotein; BMI, body mass index; HR, hazard ratio; CI, confidence interval
There were no significant interactions between quartiles of muscle area or density with age or race in either gender (for all p>0.2, data not shown).
4. Discussion
Consistent with our hypotheses, our results showed that greater muscle density was associated with lower risk of all-cause mortality across 10.6 years of follow up in a diverse cohort of adults. This association was remarkably robust in both men and women, and showed little to no attenuation after adjusting for demographics, cardiovascular risk factors, lifestyle, and other measures of body composition. Compared to those in the lowest quartile of muscle density, women in the highest quartile had less than half the risk of death (HR = 0.45) and men in the highest quartile had only one quarter the risk of death (HR = 0.26) in fully adjusted models. Moreover, there was a linear dose-dependent relationship among both men and women, with each quartile of muscle density being more protective. These results are consistent with recent studies showing an inverse association between muscle density and mortality in older Caucasian men(21) and older Caucasian men and women in Iceland(3). Importantly, as we did not find any significant statistical interaction by age or race/ethnicity, our findings show this association remains robust in a younger, healthier, and more ethnically diverse cohort, and over a longer follow-up period.
Contrary to our hypothesis, muscle area generally showed weak associations with mortality. However, in the continuous dose-response plot for males, we observed a threshold effect such that men with above median muscle area had an increased risk of mortality when fully adjusting for muscle density and other confounders. Consistent with this, Ye et al. found that greater upper extremity muscle mass predicted greater risk of hypertension,(5) and Larsen et al. showed that higher muscle area predicted greater risk of incident type 2 diabetes in older adults after adjusting for other measures of body composition.(4) Relatedly, there is evidence that athletes with large muscle mass, such as football players, have higher rates of hypertension than endurance athletes or non-athletes with a similar BMI.(22–24) Few of these analyses adjusted for muscle density, thus it is possible that higher muscle area in some individuals included large amounts of intramuscular fat. Muscle density and area are positively correlated (r=0.45 in males, 0.58 in women). Thus, individuals with higher muscle area tend to have higher muscle density. However, in our analyses, after adjustment for muscle density, higher amounts of muscle area in men showed increased mortality risk even after adjusting for measures of adiposity.
These results suggest that mortality may be more closely tied to muscle quality (density) than quantity. In a weight loss intervention with older men, Prior et al. showed that weight loss and exercise lead to reductions in low-density muscle, which in turn was tied to improved glucose metabolism.(25) It is possible that the greatest protective effects are seen not necessarily in having more muscle, but in having less intramuscular fat. Importantly, the study by Prior et al. shows that muscle density is modifiable with lifestyle change.(25) Multiple other studies have shown that increasing physical activity, including resistance training, not only improves strength and metabolic and cardiovascular risk factors, but does so independent of changes in muscle size.(6, 26) Despite this, however, a number of studies have identified muscle size as being protective against morbidity and mortality.(1, 3) Given that muscle area and density are positively correlated, it is possible that in some cases this association was driven more by density than area. The findings reported here emphasize the need to mutually adjust for muscle size and density to capture the independent effects of each of these components of muscle.
While results for men and women were generally in the same direction, associations were weaker for women. This may be due partially to a smaller range of values for women, resulting in narrower quartiles. However, in continuous analyses per whole sample SD, associations for women were still much weaker, with a 20% reduction in mortality per SD of density for women vs. 50% for men. This could suggest that muscle quality is less important for women; however, given the much lower mortality rate in women, it is likely that any associations with mortality would be smaller in women than men. Associations between muscle density and mortality also were mostly linear for men, while for women there appeared to be a threshold effect. Further exploration of gender differences is needed to more fully explore whether the different associations between muscle quality and mortality for men and women are qualitative or purely quantitative.
It is unclear at this point whether this negative association with mortality is unique to specific muscle groups. Previous studies linking muscle density and mortality have been limited, and have used different muscle groups including the legs(3, 21), abdomen (27), and chest.(18) It is uncertain whether associations with mortality are stronger for particular muscle groups as, to date, these measures have not been compared directly. It was previously reported that the association between skeletal muscle adiposity and insulin resistance is specific for particular abdominal muscle groups;(28) a next step in this line of research is to investigate whether the association with mortality also differs across muscle groups, and which mechanisms may be responsible. Relatedly, more work is needed exploring independent associations between mortality and various ectopic fat depots. Limited research has found associations between mortality and pericardial fat,(29) with mixed findings for liver fat and mortality.(30) However, most studies have been conducted in small and/or homogenous samples, and few have simultaneously considered the potential role of lean muscle or intramuscular fat.
The mechanisms linking muscle density with all-cause mortality are still unclear. As muscle density is a measure of both muscle and fat, it is uncertain whether this association is driven by changes to the muscle, to ectopic fat deposition, or a combination. Possible mechanisms between skeletal muscle adiposity and mortality may occur through numerous molecular pathways (31), and likely involve effects on inflammation and oxidative stress(31–33) and impaired insulin sensitivity. Increased fat accumulation in the myocytes may be responsible for the suppression of insulin signaling, or may disrupt mitochondrial function.(34, 35) As intramuscular fat and other ectopic fat depots have been linked to insulin resistance(36), hyperinsulinemia(28) and incident diabetes,(37) these mechanisms may have important clinical implications, particularly for metabolic health. Targeting muscle density may improve glucose metabolism (25, 26) and be an appropriate therapeutic target in the management of diabetes. It appears muscle density has important associations for physical health as well as endocrine function, though clearly more work is needed in this important area.
This study has a number of strengths, including a large, diverse cohort, gold standard CT measurements of body composition, and thorough measures of important confounders. The study sample was not only diverse but also free of clinical cardiovascular disease and younger at baseline than other cohorts examining muscle and mortality, which increases generalizability. Additionally, we were able to perform gender-stratified analyses, which is important given the differing distributions in muscle density and area in men and women as well as the potential influence of gender-specific hormones on mortality. Limitations include fewer deaths and a smaller range of muscle area and density in women compared to men, which may have reduced statistical precision and underestimated the effect for women. Additionally, some covariates, such as physical activity and sedentary behavior, were measured by self-report rather than objective measures, and no measure of fitness was available. Finally, while the sample was younger and free of known CVD at baseline, there was a relatively high baseline prevalence of diabetes and hypertension, which somewhat limits generalizability to completely healthy, non-clinical populations.
5. Conclusions
Muscle quality has been under-studied compared to other measures of body composition. We found that muscle density was robustly and strongly associated with all-cause mortality in a diverse cohort of men and women. Men and women with greater abdominal muscle density had significantly lower risk of mortality over 10.6 and 10.9 years of follow up (respectively), independent of muscle area. The magnitude of the associations seen here highlights muscle density as a particularly informative measure of risk in older adults. Future directions include evaluation of interventions designed to improve muscle density and exploring the feasibility of assessing muscle density as a mortality risk factor in clinical settings.
Acknowledgments
The MESA study was supported by The National Institutes of Health/National Heart, Lung and Blood Institute (N01-HC-95159 through N01-HC-95169).
Abbreviations:
- MESA
Multi-ethnic Study of Atherosclerosis
- BP
blood pressure
- HDL
high density lipoprotein
- BMI
body mass index
- HR
hazard ratio
- CI
confidence interval
Footnotes
Declarations of Interest: None.
References
- 1.Larsen BA, Allison MA, Laughlin GA, Araneta MR, Barrett-Connor E, Wooten WJ, et al. The association between abdominal muscle and type II diabetes across weight categories in diverse post-menopausal women. J Clin Endocrinol Metab. 2015;100(1):E105–9. [DOI] [PMC free article] [PubMed] [Google Scholar]
- 2.Lee K Muscle Mass and Body Fat in Relation to Cardiovascular Risk Estimation and Lipid-Lowering Eligibility. J Clin Densitom. 2017;20(2):247–55. [DOI] [PubMed] [Google Scholar]
- 3.Reinders I, Murphy RA, Brouwer IA, Visser M, Launer L, Siggeirsdottir K, et al. Muscle Quality and Myosteatosis: Novel Associations With Mortality Risk: The Age, Gene/Environment Susceptibility (AGES)-Reykjavik Study. Am J Epidemiol. 2016;183(1):53–60. [DOI] [PMC free article] [PubMed] [Google Scholar]
- 4.Larsen BA, Wassel CL, Kritchevsky SB, Strotmeyer ES, Criqui MH, Kanaya AM, et al. Association of Muscle Mass, Area, and Strength With Incident Diabetes in Older Adults: The Health ABC Study. J Clin Endocrinol Metab. 2016;101(4):1847–55. [DOI] [PMC free article] [PubMed] [Google Scholar]
- 5.Ye S, Zhu C, Wei C, Yang M, Zheng W, Gan D, et al. Associations of Body Composition with Blood Pressure and Hypertension. Obesity (Silver Spring). 2018;26(10):1644–50. [DOI] [PubMed] [Google Scholar]
- 6.Goodpaster BH, Chomentowski P, Ward BK, Rossi A, Glynn NW, Delmonico MJ, et al. Effects of physical activity on strength and skeletal muscle fat infiltration in older adults: a randomized controlled trial. J Appl Physiol (1985). 2008;105(5):1498–503. [DOI] [PMC free article] [PubMed] [Google Scholar]
- 7.Goodpaster BH, Kelley DE, Thaete FL, He J, Ross R. Skeletal muscle attenuation determined by computed tomography is associated with skeletal muscle lipid content. J Appl Physiol (1985). 2000;89(1):104–10. [DOI] [PubMed] [Google Scholar]
- 8.Anderson DE, Quinn E, Parker E, Allaire BT, Muir JW, Rubin CT, et al. Associations of Computed Tomography-Based Trunk Muscle Size and Density With Balance and Falls in Older Adults. J Gerontol A Biol Sci Med Sci. 2016;71(6):811–6. [DOI] [PMC free article] [PubMed] [Google Scholar]
- 9.Cawthon PM, Fox KM, Gandra SR, Delmonico MJ, Chiou CF, Anthony MS, et al. Do muscle mass, muscle density, strength, and physical function similarly influence risk of hospitalization in older adults? J Am Geriatr Soc. 2009;57(8):1411–9. [DOI] [PMC free article] [PubMed] [Google Scholar]
- 10.Yamashita M, Kamiya K, Matsunaga A, Kitamura T, Hamazaki N, Matsuzawa R, et al. Prognostic Value of Psoas Muscle Area and Density in Patients Who Undergo Cardiovascular Surgery. The Canadian journal of cardiology. 2017;33(12):1652–9. [DOI] [PubMed] [Google Scholar]
- 11.Hicks GE, Simonsick EM, Harris TB, Newman AB, Weiner DK, Nevitt MA, et al. Trunk muscle composition as a predictor of reduced functional capacity in the health, aging and body composition study: the moderating role of back pain. J Gerontol A Biol Sci Med Sci. 2005;60(11):1420–4. [DOI] [PubMed] [Google Scholar]
- 12.Perkisas S, De Cock AM, Verhoeven V, Vandewoude M. Intramuscular Adipose Tissue and the Functional Components of Sarcopenia in Hospitalized Geriatric Patients. Geriatrics (Basel). 2017;2(1). [DOI] [PMC free article] [PubMed] [Google Scholar]
- 13.Locke JE, Carr JJ, Nair S, Terry JG, Reed RD, Smith GD, et al. Abdominal lean muscle is associated with lower mortality among kidney waitlist candidates. Clin Transplant. 2017;31(3). [DOI] [PMC free article] [PubMed] [Google Scholar]
- 14.Teigen LM, John R, Kuchnia AJ, Nagel EM, Earthman CP, Kealhofer J, et al. Preoperative Pectoralis Muscle Quantity and Attenuation by Computed Tomography Are Novel and Powerful Predictors of Mortality After Left Ventricular Assist Device Implantation. Circulation Heart failure. 2017;10(9). [DOI] [PubMed] [Google Scholar]
- 15.Rossoff J, Platanias LC. Impact of myosteatosis in survivors of childhood acute lymphoblastic leukemia. Leuk Lymphoma. 2019;60(13):3097–8. [DOI] [PubMed] [Google Scholar]
- 16.Bild DE, Bluemke DA, Burke GL, Detrano R, Diez Roux AV, Folsom AR, et al. Multi-Ethnic Study of Atherosclerosis: objectives and design. Am J Epidemiol. 2002;156(9):871–81. [DOI] [PubMed] [Google Scholar]
- 17.Ainsworth BE, Irwin ML, Addy CL, Whitt MC, Stolarczyk LM. Moderate physical activity patterns of minority women: the Cross-Cultural Activity Participation Study. J Womens Health Gend Based Med. 1999;8(6):805–13. [DOI] [PubMed] [Google Scholar]
- 18.Lenchik L, Barnard R, Boutin RD, Kritchevsky SB, Chen H, Tan J, et al. Automated Muscle Measurement on Chest Computed Tomography (CT) Predicts All-cause Mortality in Older Adults from the National Lung Screening Trial. J Gerontol A Biol Sci Med Sci. 2020. [DOI] [PMC free article] [PubMed] [Google Scholar]
- 19.Mamane S, Mullie L, Piazza N, Martucci G, Morais J, Vigano A, et al. Psoas Muscle Area and All-Cause Mortality After Transcatheter Aortic Valve Replacement: The Montreal-Munich Study. The Canadian journal of cardiology. 2016;32(2):177–82. [DOI] [PubMed] [Google Scholar]
- 20.McGrath R, Vincent BM, Al Snih S, Markides KS, Peterson MD. The Association Between Muscle Weakness and Incident Diabetes in Older Mexican Americans. Journal of the American Medical Directors Association. 2017;18(5):452 e7–e12. [DOI] [PMC free article] [PubMed] [Google Scholar]
- 21.Miljkovic I, Kuipers AL, Cauley JA, Prasad T, Lee CG, Ensrud KE, et al. Greater Skeletal Muscle Fat Infiltration Is Associated With Higher All-Cause and Cardiovascular Mortality in Older Men. J Gerontol A Biol Sci Med Sci. 2015;70(9):1133–40. [DOI] [PMC free article] [PubMed] [Google Scholar]
- 22.Berge HM, Isern CB, Berge E. Blood pressure and hypertension in athletes: a systematic review. Br J Sports Med. 2015;49(11):716–23. [DOI] [PubMed] [Google Scholar]
- 23.Tucker AM, Vogel RA, Lincoln AE, Dunn RE, Ahrensfield DC, Allen TW, et al. Prevalence of cardiovascular disease risk factors among National Football League players. JAMA. 2009;301(20):2111–9. [DOI] [PubMed] [Google Scholar]
- 24.Karpinos AR, Roumie CL, Nian H, Diamond AB, Rothman RL. High prevalence of hypertension among collegiate football athletes. Circ Cardiovasc Qual Outcomes. 2013;6(6):716–23. [DOI] [PMC free article] [PubMed] [Google Scholar]
- 25.Prior SJ, Joseph LJ, Brandauer J, Katzel LI, Hagberg JM, Ryan AS. Reduction in midthigh low-density muscle with aerobic exercise training and weight loss impacts glucose tolerance in older men. J Clin Endocrinol Metab. 2007;92(3):880–6. [DOI] [PubMed] [Google Scholar]
- 26.Shaibi GQ, Cruz ML, Ball GD, Weigensberg MJ, Salem GJ, Crespo NC, et al. Effects of resistance training on insulin sensitivity in overweight Latino adolescent males. Medicine and Science in Sports and Exercise. 2006;38(7):1208–15. [DOI] [PubMed] [Google Scholar]
- 27.Murea M, Lenchik L, Register TC, Russell GB, Xu J, Smith SC, et al. Psoas and paraspinous muscle index as a predictor of mortality in African American men with type 2 diabetes mellitus. J Diabetes Complications. 2018;32(6):558–64. [DOI] [PMC free article] [PubMed] [Google Scholar]
- 28.Miljkovic I, Cauley JA, Wang PY, Holton KF, Lee CG, Sheu Y, et al. Abdominal myosteatosis is independently associated with hyperinsulinemia and insulin resistance among older men without diabetes. Obesity (Silver Spring). 2013;21(10):2118–25. [DOI] [PMC free article] [PubMed] [Google Scholar]
- 29.Larsen BA, Laughlin GA, Saad SD, Barrett-Connor E, Allison MA, Wassel CL. Pericardial fat is associated with all-cause mortality but not incident CVD: the Rancho Bernardo Study. Atherosclerosis. 2015;239(2):470–5. [DOI] [PMC free article] [PubMed] [Google Scholar]
- 30.Kuk JL, Katzmarzyk P, Nichaman MZ, Church TS, Blair SN, Ross R. Viscearl fat is an independent predictor of all-cause mortality in men. Obesity. 2006;14(2):336–41. [DOI] [PubMed] [Google Scholar]
- 31.Vettor R, Milan G, Franzin C, Sanna M, De Coppi P, Rizzuto R, et al. The origin of intermuscular adipose tissue and its pathophysiological implications. American journal of physiology Endocrinology and metabolism. 2009;297(5):E987–98. [DOI] [PubMed] [Google Scholar]
- 32.Arsenault BJ, Beaumont EP, Despres JP, Larose E. Mapping body fat distribution: a key step towards the identification of the vulnerable patient? Ann Med. 2012;44(8):758–72. [DOI] [PubMed] [Google Scholar]
- 33.Pou KM, Massaro JM, Hoffmann U, Vasan RS, Maurovich-Horvat P, Larson MG, et al. Visceral and subcutaneous adipose tissue volumes are cross-sectionally related to markers of inflammation and oxidative stress: the Framingham Heart Study. Circulation. 2007;116(11):1234–41. [DOI] [PubMed] [Google Scholar]
- 34.Miljkovic I, Zmuda JM. Epidemiology of myosteatosis. Curr Opin Clin Nutr Metab Care. 2010;13(3):260–4. [DOI] [PMC free article] [PubMed] [Google Scholar]
- 35.Schrauwen P High-fat diet, muscular lipotoxicity and insulin resistance. Proc Nutr Soc. 2007;66(1):33–41. [DOI] [PubMed] [Google Scholar]
- 36.McAuley PA, Hsu FC, Loman KK, Carr JJ, Budoff MJ, Szklo M, et al. Liver attenuation, pericardial adipose tissue, obesity, and insulin resistance: the Multi-Ethnic Study of Atherosclerosis (MESA). Obesity (Silver Spring). 2011;19(9):1855–60. [DOI] [PubMed] [Google Scholar]
- 37.Miljkovic I, Kuipers AL, Cvejkus R, Bunker CH, Patrick AL, Gordon CL, et al. Myosteatosis increases with aging and is associated with incident diabetes in African ancestry men. Obesity (Silver Spring). 2016;24(2):476–82. [DOI] [PMC free article] [PubMed] [Google Scholar]