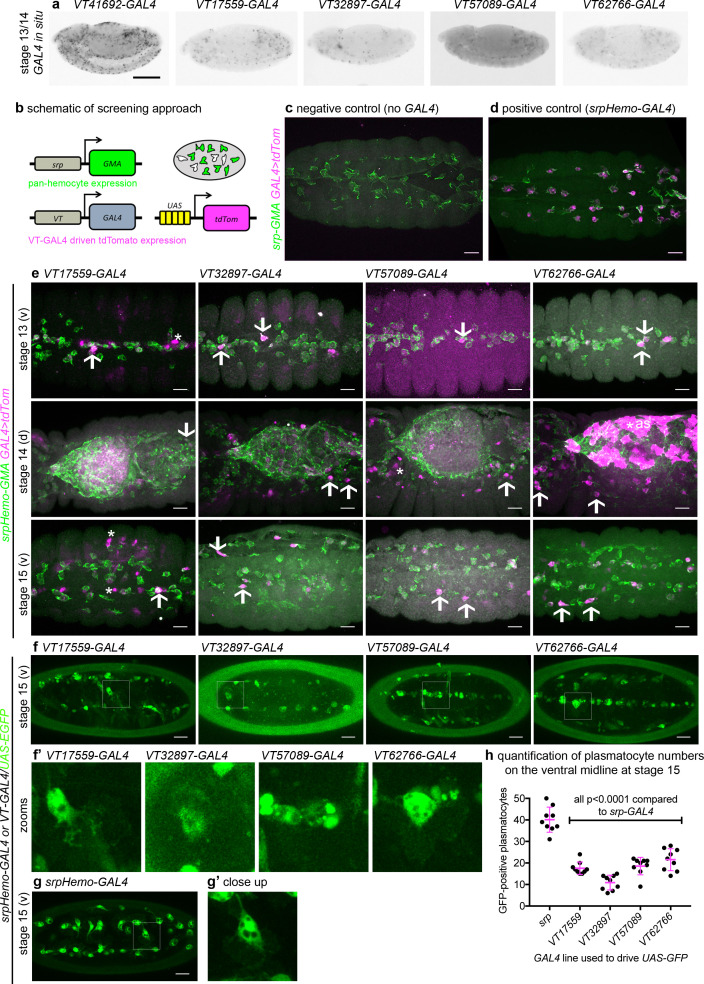
Figure 2. Identification of enhancers labelling discrete plasmatocyte subpopulations in Drosophila.
(a) Lateral views of stage 13/14 embryos with in situ hybridisation performed for GAL4 for indicated VT-GAL4 lines (anterior is left). Taken with permission from http://enhancers.starklab.org/ (n.b. these images are not covered by the CC-BY 4.0 licence and further reproduction of this panel would need permission from the copyright holder); VT41692-GAL4 represents an example in which the majority of plasmatocytes are labelled. (b) Schematic diagram showing screening approach to identify subpopulations of plasmatocytes: VT-GAL4-positive plasmatocytes will express both GMA (green) and tdTomato (magenta) – white cells in the schematic. (c–d) Images showing the ventral midline at stage 14 of negative control (no driver; w;UAS-tdTom/+;srpHemo-GMA) and positive control (w;srpHemo-GAL4/UAS-tdTom;srpHemo-GMA) embryos. (e) Images showing embryos containing VT-GAL4-labelled cells (via UAS-tdTomato, shown in magenta) at stage 13 (first row, ventral views), stage 14 (second row, dorsal views), and stage 15 (third row, ventral views). The entire hemocyte population is labelled via srpHemo-GMA (green); arrows indicate examples of VT-GAL4-positive plasmatocytes; asterisks indicate VT-GAL4-positive cells that are not labelled by srpHemo-GMA. N.b. VT62766-GAL4 image contrast enhanced to different parameters compared to other images owing to the very bright labelling of amnioserosal cells (cells on dorsal side of embryo destined to be removed during dorsal closure; labelled with an asterisk) in the stage 14 image. (f) Labelling of smaller numbers of plasmatocytes on the ventral midline at stage 15 using VT-GAL4 lines indicated and UAS-GFP (green); boxed regions show close-ups of VT-GAL4-positive plasmatocytes (f’). (g) Ventral view of positive control embryo (w;srpHemo-GAL4,UAS-GFP) and example plasmatocyte (g’) at stage 15. (h) Scatterplot showing numbers plasmatocytes labelled using VT-GAL4 lines to drive expression from UAS-GFP on the ventral midline at stage 15; lines and error bars represent mean and standard deviation, respectively. p-Values calculated via one-way ANOVA with a Dunnett’s multiple comparison post-test (all compared to srpHemo-GAL4 control); n = 9 embryos per genotype. Scale bars represent 150 μm (a) or 10 μm (c–g). See Supplementary file 1 for full list of genotypes; overlap of VT enhancer expression with known plasmatocyte markers can be found in Figure 2—figure supplements 1 and 2.


