

ABSTRACT
Objectives
Using a sample of pediatric chest radiographs (pCXR) taken to rule out pneumonia, we obtained diagnostic interpretations from physicians and used learning analytics to determine the radiographic variables and participant review processes that predicted for an incorrect diagnostic interpretation.
Methods
This was a prospective cross‐sectional study. A convenience sample of frontline physicians with a range of experience levels interpreted 200 pCXR presented using a customized online radiograph presentation platform. Participants were asked to determine absence or presence (with respective location) of pneumonia. The pCXR were categorized for specific image‐based variables potentially associated with interpretation difficulty. We also generated heat maps displaying the locations of diagnostic error among normal pCXR. Finally, we compared image review processes in participants with higher versus lower levels of clinical experience.
Results
We enrolled 83 participants (20 medical students, 40 postgraduate trainees, and 23 faculty) and obtained 12,178 case interpretations. Variables that predicted for increased pCXR interpretation difficulty were pneumonia versus no pneumonia (β = 8.7, 95% confidence interval [CI] = 7.4 to 10.0), low versus higher visibility of pneumonia (β = –2.2, 95% CI = –2.7 to –1.7), nonspecific lung pathology (β = 0.9, 95% CI = 0.40 to 1.5), localized versus multifocal pneumonia (β = –0.5, 95% CI = –0.8 to –0.1), and one versus two views (β = 0.9, 95% CI = 0.01 to 1.9). A review of diagnostic errors identified that bony structures, vessels in the perihilar region, peribronchial thickening, and thymus were often mistaken for pneumonia. Participants with lower experience were less accurate when they reviewed one of two available views (p < 0.0001), and accuracy of those with higher experience increased with increased confidence in their response (p < 0.0001).
Conclusions
Using learning analytics, we identified actionable learning opportunities for pCXR interpretation, which can be used to allow for a customized weighting of which cases to practice. Furthermore, experienced–novice comparisons revealed image review processes that were associated with greater diagnostic accuracy, providing additional insight into skill development of image interpretation.
Keywords: education, medical, learning analytics, radiographs
INTRODUCTION
Diagnostic images play an important role in everyday medical practice. To safely practice emergency medicine, physicians must accurately interpret diagnostic images. 1 As such, medical educators must teach front‐line physician learners how to interpret diagnostic images to an expert level before these learners graduate and are faced with making independent management decisions. Learning analytics is a method of understanding and optimizing learning in context. It involves measuring, collecting, analyzing, and reporting data about learners and their environments. In this way, learning analytics can improve on traditional instructor‐based curricular designs by using the learner's perspective to inform teaching. 2 , 3
The pediatric chest radiograph (pCXR) is one of the most ordered imaging tests in children. In emergency departments (EDs) approximately one CXR is ordered per eight pediatric visits, 4 and pCXR comprise about 25% of all ordered medical images. 5 Nevertheless, the pCXR is a difficult skill to learn because it is a two‐dimensional interpretation of three‐dimensional anatomy, and there is a limited range of gray scale superimposed on each area of a pCXR making it difficult to differentiate findings. 6 It is not surprising then that diagnostic error rates have been reported as high as 30% among frontline physicians. 4 , 5 , 7 , 8 Since there is a variable presentation of pneumonia on pCXR, diagnostic errors are particularly common for this subset of pCXR. 4 , 9 , 10 Unfortunately, interpretation skill does not necessarily improve with an increase in years of bedside practice as a frontline physician. 11 These diagnostic challenges may lead to missed pathology, an overprescribing of antibiotics, and litigation from patient harm related to these errors. 12 , 13 Considering that there are millions of pCXR done in children worldwide, the burden of these errors can be substantial. 14 To date, data on image interpretation diagnostic errors comes from expert opinion of observed errors in the clinical arena, 4 , 9 , 10 and this may provide an incomplete or biased view of sources of diagnostic challenges. This presents the potential for improvement with learner‐level analytic data.
Using a previously established digital environment, 15 the main objective of this study was to identify learning analytic‐derived variables that predict for an incorrect pCXR diagnostic interpretation. By determining the features associated with diagnostic error, one can more effectively teach the skill of pCXR interpretation. We also compared image review processes of participants with higher versus lower levels of clinical experience to better understand what more experienced clinicians do to yield a higher diagnostic accuracy.
METHODS
Study design
This was a prospective cross‐sectional study. Overall, after collecting a sample of 200 pCXR, we presented these images to study participants using customized software to collect data on their interpretation errors. We also categorized the pCXR for specific variables (details below) and determined variables and image review processes that were associated with diagnostic error. We then used regression modeling and heat map analyses to derive the image‐based variables and image review process associated with diagnostic interpretation error (Figure 1). This study was approved by the Research Ethics Board at the Hospital for Sick Children. The funder of this study, Hospital for Sick Children, had no role in the conduct or reporting of the study.
FIGURE 1.
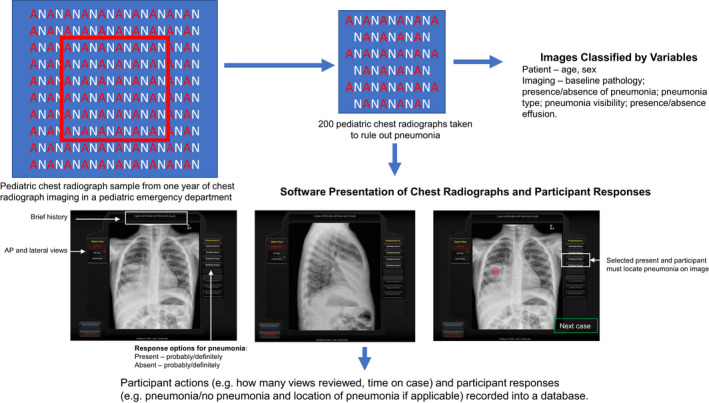
Study design. Chest radiographs (CXR) were collected from a 2‐year experience in a pediatric ED. A sample of 200 of these CXR were selected for this study. Each image was classified by specific variables. Images were also integrated into software that displayed the images, alongside a brief clinical history, and participants had to select if the pneumonia was present (and specific location) or absent, with degree of certainty. Participant image review process and responses were recorded into a database
Radiograph‐based case selection and development
The research group had amassed a consecutive sample of pCXR, representing two years (January 1, 2014, to December 31, 2015) of experience, from a pediatric ED’s picture archiving and communications system (Figure 1). From this set, pCXR were selected based on quality, ability to verify a diagnosis from a single set of pCXR (vs. those that required prior comparison radiographs to confirm a diagnosis), educational priorities, and an overall frequency of pathology representative of clinical practice. This resulted in a database of 434 pCXR with verified diagnoses. Of these, 200 were taken to rule out pneumonia and were used as the testing‐set of images for this research. Case solutions for the absence or presence of pathology, with respective location where applicable, were determined from the official radiology report and a second interpretation by a blinded study pediatric radiologist. If there was a discrepancy between the report and second read, this was resolved by a consensus discussion between the second‐read radiologist and a third pediatric radiologist. If a consensus could not be reached, these cases were excluded. A single standardized brief history (age, sex, and history of cough and fever) was created and presented for every case to minimize participant bias from historical information. 16
Radiograph variables
Variable classification
Based on a literature review and the consensus of the study team, we identified variables that may be associated with a difficult pCXR interpretation 4 , 9 , 10 , 17 , 18 , 19 : age in years, number of views (one vs. two), pneumonia (present vs. absent), baseline abnormal anatomy (present vs. absent), nonspecific pulmonary pathology (present vs. absent), location of pneumonia (not applicable, one location, multiple locations), type of pneumonia (not applicable, single lobar consolidation, vs. patchy/diffuse), visibility of pneumonia (not applicable, low, medium vs. high), and effusion (present vs. absent). Categorizing the variables in each of the 200 pCXR was done independently by a pediatric radiologist and pediatric emergency medicine physician and they were resolved by consensus. The inter‐rater reliability between the radiologist and pediatric emergency medicine physician in classifying these variables was 0.77 (95% confidence interval [CI] = 0.74 to 0.80). The properties of the final set are described in Table 1.
TABLE 1.
Chest radiographs variables
| Classification variable | |
|---|---|
| All images | N = 200 |
| Median age, years (IQR) | 3.1 (1.4, 6.3) |
| Two radiograph views, no. (%) | 186 (93.0) |
| Baseline abnormal anatomy, no. (%) | 20 (10.0) |
| Non‐specific findings, no. (%) | 133 (66.5) |
| Pneumonia, no. (%) | 116 (58.0) |
| Pneumonia images | N = 116 |
| Pneumonia Type, no. (%) a | |
| Consolidation | 59 (29.5) |
| Diffuse/patchy | 57 (28.5) |
| Pneumonia with effusion | 11 (5.5) |
| Location, no. (%) a | |
| Right upper lobe pneumonia | 21 (10.5) |
| Right lower lobe pneumonia | 38 (19.0) |
| Right middle lobe pneumonia | 42 (21.0) |
| Left upper lobe pneumonia | 10 (5.0) |
| Left lower lobe pneumonia | 53 (26.5) |
| Left lingular pneumonia | 15 (7.5) |
| Multiple locations to pneumonia | 47 (23.5) |
Totals equal greater than 116 since there was often more than one of these variables present in each CXR.
Definitions
The pCXR diagnosis of pneumonia present was based on the standardized World Health Organization definitions and included several radiological patterns, such as endpoint consolidation (presence of a dense, fluffy parenchymal opacity that obscures the underlying vasculature and occupies a portion or whole of a lobe, that may or not contain air bronchograms), and patchy pneumonic infiltrates that are of insufficient magnitude to constitute consolidation but are routinely diagnosed as pneumonia and treated with antibiotics. 20 , 21 If changes on the pCXR were indeterminate for pneumonia versus atelectasis, these cases were classified as pneumonia and study participants were informed to classify these ambiguous cases as pneumonia. We did not exclude these cases because it is a common conundrum and important for maintaining ecological validity of our sample. We defined a high‐visibility pneumonia as a conspicuous abnormality that had inherent high contrast to the normal aerated lung, medium visibility pneumonia as an abnormality more difficult to recognize due to its reduced opacity and contrast with adjacent interphases, and low visibility pneumonia as a subtle finding with very low intrinsic opacity and contrast. 21 Baseline abnormal anatomy was defined as nonpulmonary abnormal findings such as scoliosis, cardiomegaly, or surgical wires. Nonspecific pulmonary findings were defined as features that are not present on a completely normal pCXR but do not imply pneumonia, including isolated peribronchial cuffing or streaky atelectasis.
Software presentation of radiograph‐based cases
The 200 cases were integrated into a customized online radiograph presentation platform that had been previously developed using HTML, PHP, and Flash. 22 The software enabled participants to view each radiograph and declare whether pneumonia was present or absent and their degree of certainty (“definitely present,” “probably present,” “definitely absent,” or “probably absent”). The definitely/probably qualifiers acted as a measure of participant certainty of response and can be used to measure self‐monitoring ability. 23 If pneumonia was present, participants were asked to select where the pneumonia was located by clicking on the respective area on the pCXR. No feedback was provided about whether the answer was correct or incorrect (Figure 1). The software tracked participant progress through the cases and recorded responses to a mySQL database.
Participant recruitment
Between April 1 and September 30, 2019, an introductory email and recruitment notice was sent to emergency medicine division heads and pediatric and emergency medicine postgraduate trainee program directors in the United States and Canada. We also contacted medical student program leadership at two universities (University of Toronto and Western University) and asked that our research solicitation be forwarded to third‐ and fourth‐year medical students. Interested participants contacted the research team to request participation and were enrolled in the study.
Study interventions
Participant interpretation of pCXR and data collection
Secure entry to the cases was ensured via unique participant login credentials. Access to the system was available 24 hours per day, 7 days per week. Upon access, participants reviewed a document that detailed the study and provided assurances of confidentiality and voluntary participation. We collected demographic information on participants with regard to experience level (medical student, postgraduate trainee, faculty), most recently completed training where applicable (pediatrics, emergency medicine, pediatric emergency medicine, other), year of postgraduate training where applicable, faculty/medical student, postgraduate year of training, number of years of practice for nontrainees (0–5, 6–10, 11–15, 16–20, >20 years), radiology elective in your training (yes vs. no), and primary practice setting (university‐affiliated general hospital, university‐affiliated pediatric hospital, non–university‐affiliated general hospital, non–university‐affiliated pediatric hospital). Participant learning analytic data collected included case‐level participant accuracy, time spent reviewing each case, participant degree of certainty (probably versus definitely for each response), 23 and number of pCXR views reviewed prior to submission of response. Participants were required to complete a minimum of 50 cases and were given 4 weeks to complete the cases. Those who did not complete the cases by 2 weeks were provided with one reminder email. As a token of appreciation, participants who completed all 200 cases were granted free access to an online course on pCXR interpretation.
Descriptive review of heat maps
Heat maps were used to help visualize errors made by participants directly on diagnostic images. 24 A panel of three of the physicians (two pediatric emergency physicians and one pediatric radiologist) met to review the heat maps of 10 most difficult “pneumonia‐absent” images. Their impressions were recorded in field notes, which, correlated to the images, described themes relevant to errors in pCXR interpretation.
Outcomes
Variables associated with radiograph interpretation difficulty
The primary outcome of the study was the association of the aforementioned independent pCXR variables to the dependent variable of pCXR item interpretation difficulty. We also descriptively determined variable‐related themes in normal pCXR that demonstrated the highest frequency of errors.
Participant process measures
We compared image review processes (performance, time on case, certainty, number of views) in participants with higher versus lower levels of clinical experience. We also examined the interaction of experience level with different process measures (time on case, certainty, number of views) on case correctness.
Data analyses
Sample size
Sample size was determined in two respects: the number of persons rating each case to obtain a target precision of difficulty estimate and the number of cases per pediatric CXR variable for linear regression modeling. For the case ratings, we determined the sample size based on a target precision for each case difficulty estimate or a 95% CI of ±0.5 logits, requiring a minimal sample size of 50 interpretations per CXR, a standard that is commonly cited in other IRT applications. 25 , 26 , 27 For the linear regression analysis, we needed 15 cases/variable entered into the multivariate model to minimize overfitting the data. 28
Unit of analysis
Each set pCXR completed by a participant was considered one case. Pneumonia‐absent pCXR were scored dichotomously depending on the match between the participant's response and the reference standard diagnosis. Pneumonia‐present pCXR were scored correct if the participant had both classified it as pneumonia present and indicated the correct region of abnormality on at least one of the case radiograph views. A “correct case” given a score of 1 and an incorrect case was given a score of zero.
Learning analytics to determine variables associated with pCXR interpretation difficulty
CXR difficulty score
We used all available data for this analysis. One‐parameter item response theory was used to derive interpretation difficulty scores for each of the CXR; this technique is widely used in education to calibrate and evaluate items in tests to score subjects on their abilities, attitudes, or latent traits. 25 , 27 Item response theory models the response of each participant of a given ability to each radiograph case, and it is based on the idea that the probability of a correct response to an item is a function of the participant's ability and case parameters. Under item response theory, item difficulty is expressed using the unitless logit metric, the natural logarithm of the odds of answering the item correctly, akin to a logistic regression. The continuous logit scale is centered at zero such that an item of average difficulty has a logit value of 0, easier items take on negative values and more difficult items take on positive values. Item response theory is a kind of logistic regression whereby the logit transformation of a 0 (incorrect)/1 (correct) dependent variable is linearly related to a predictor variable, which in this case is the accuracy of the participant. The item response theory difficulty metric is a continuous variable that was used as the dependent variable in a stepwise multivariate linear regression to determine what was the best combination of the aforementioned radiograph variables that were independently associated with the interpretation difficulty score. 29 We reported beta‐coefficients and their respective 95% CIs, which measured the strength of the effect of each independent variable to the dependent variable. Of note, variables with a negative beta‐coefficient implied that a pCXR is easier to interpret with an increase in that variable, while variables with a positive beta‐coefficient represent items that were more difficult to interpret with an increase in that variable.
Heat maps
We generated heat maps to visually demonstrate the highest frequency of interpretation errors on pCXR without pneumonia. Specifically, heat map software recorded the locations that participants clicked to indicate where they thought the pneumonia was located. The size and color of each hot spot was determined by the frequency of click in a respective area. Red color represented a relatively higher frequency and blue represented a lower frequency of clicks in that area. 24 The unmarked radiographs were then compared to the overlaid image showing hot spots to derive image‐ or patient‐based variables that led to an incorrect diagnosis in pCXR without pneumonia.
Learning analytics to examine participant image review processes
Participant accuracy was measured as the proportion of cases correct over the 200 case‐set experience. The proportion of cases where the participant reviewed all available views was also calculated. For time on case, we plotted our data and found that only 1.4% of participants exceeded a 100‐second time on case, and these participants stayed idle on case for more than 300 seconds (5 minutes), suggesting that they left the case to do something else. Thus, we capped time on case at 100 seconds. We then reported the median time on case in seconds. Participant certainty was measured as the proportion of cases responded with “definitely.” Since participant process measures were not normally distributed and included nonparametric data, we used the Kruskal‐Wallis test to compare for differences among the three experience levels for these variables. We also used a multilevel logistic regression model to examine the effects of process variables (two views reviewed, participant certainty, and time on case) and experience level (medical student, postgraduate trainee, faculty) on the dependent binary outcome of case correctness. 29 This model allowed us to examine whether the probability of case correctness was independently associated with each process variable as well the extent to which the relationship changed with different levels of experience (i.e., the presence of an interaction effect). To visualize the effects, we present marginal effects plots. 30 We used a Bonferroni correction such that significance was set at < 0.02 (0.05/3).
Analyses were conducted using SPSS software analysis package (version 26), except for the interaction analyses, which were conducted using STATA (version 16) and one‐parameter item response theory, which were derived using Rasch Modeling in SAS (IBM, Version 9.3). 31
RESULTS
Study participants
We enrolled 83 participants who completed at least one case. Of these, 75 (90.4%) completed at least 50 cases, and 52 (62.7%) completed all 200 cases. There were no differences between participants who completed fewer than 50 cases versus 50 to 199 cases versus 200 cases with respect to the demographics practice setting or career level. Of the 83 participants, there were 20 (24.1%) medical students; 40 (48.2%) postgraduate trainees, of whom 23 were PGY‐3 to ‐6; and 23 (27.7%) faculty‐level participants (14 pediatricians, 12 general, and nine pediatric emergency physicians). Furthermore, 78.3% practiced in Canada (Data Supplement S1, Table S1, available as supporting information in the online version of this paper, which is available at http://onlinelibrary.wiley.com/doi/10.1002/aet2.10592/full).
CXR interpretation diagnostic errors and difficulty scores
We collected 12,178 case interpretations in total, with a median of 61 interpretations per pCXR. Of the 2,994 incorrect diagnostic interpretations, 2,431 (81.2%) were false negatives (under call of a pneumonia), while 563 (18.8%) were false positives (over call of a pneumonia; absolute difference = 62.4%, 95% CI = 58.6 to 65.8). On the item response theory logit scale, the median difficulty interpretation score of all pCXR images was –2.40 logits (95% CI = –3.87 to +0.10), with difficulty scores skewed toward easier interpretations (Figure S1). Cases with pneumonia absent (mean = –3.82 logits) were significantly easier to interpret than cases with pneumonia present (mean = –0.62 logits, mean difference = –3.21 logits, 95% CI = –3.84 to –2.57).
Variables associated with pCXR interpretation difficulty score
Linear regression analysis
The interpretation difficulty score increased with the presence of nonspecific pulmonary findings and a pneumonia that was low in visibility and in a single location. In contrast, the presence of two versus one view of pCXR for the participant to review decreased the interpretation difficulty score of a case (Table 2). The adjusted R2 of model was 0.65, and there was no evidence of collinearity (VIF < 5 and tolerance > 0.10 for all variables).
TABLE 2.
Variables associated with increased CXR interpretation difficulty
| Variable | Included variables | Excluded variables |
|---|---|---|
| Age (years) | — | –0.059 (–0.10 to 0.02) |
| One vs. two views | 0.95 (0.015 to 1.86) | — |
| Baseline abnormal anatomy absent vs. present | — | –0.05 (–0.83 to 0.73) |
| Nonspecific pathology–absent vs. present | 1.0 (0.48 to 1.54) | — |
| Pneumonia absent vs. present | 8.56 (7.41 to 9.71) | — |
| Visibility of pneumonia–low, medium, vs. high | –2.31 (–2.75 to –1.89) | — |
| Location of pneumonia–single vs. multiple | –0.42 (–0.75 to –0.10) | — |
| Type of pneumonia–lobar vs. diffuse/patchy | — | –0.28 (–0.97 to 0.41) |
| Effusion present vs. absent | — | 0.22 (–0.86 to 1.30) |
Data are reported as beta‐coefficient (95% CI).
Abbreviation: CXR, chest radiograph.
A negative beta‐coefficient implies a relationship that demonstrates that an increase in that variable's quantity results in an image that is easier to diagnose, while a positive beta‐coefficient demonstrates that an increased in that variable's number results in an image that is more difficult to diagnose. The first category of each variable was assigned the lowest numeric category (e.g., absent = 0).
Descriptive review of CXR heat maps
Four themes of diagnostic error emerged from review of the pCXR without pneumonia that demonstrated a high frequency of diagnostic error (Figure 2). Bony structures (i.e., ribs and scapula), vessels in the perihilar region, peribronchial thickening, and thymus were often mistaken for consolidation. Furthermore, nine of the 10 most difficult normal images were in patients less than 5 years of age.
FIGURE 2.
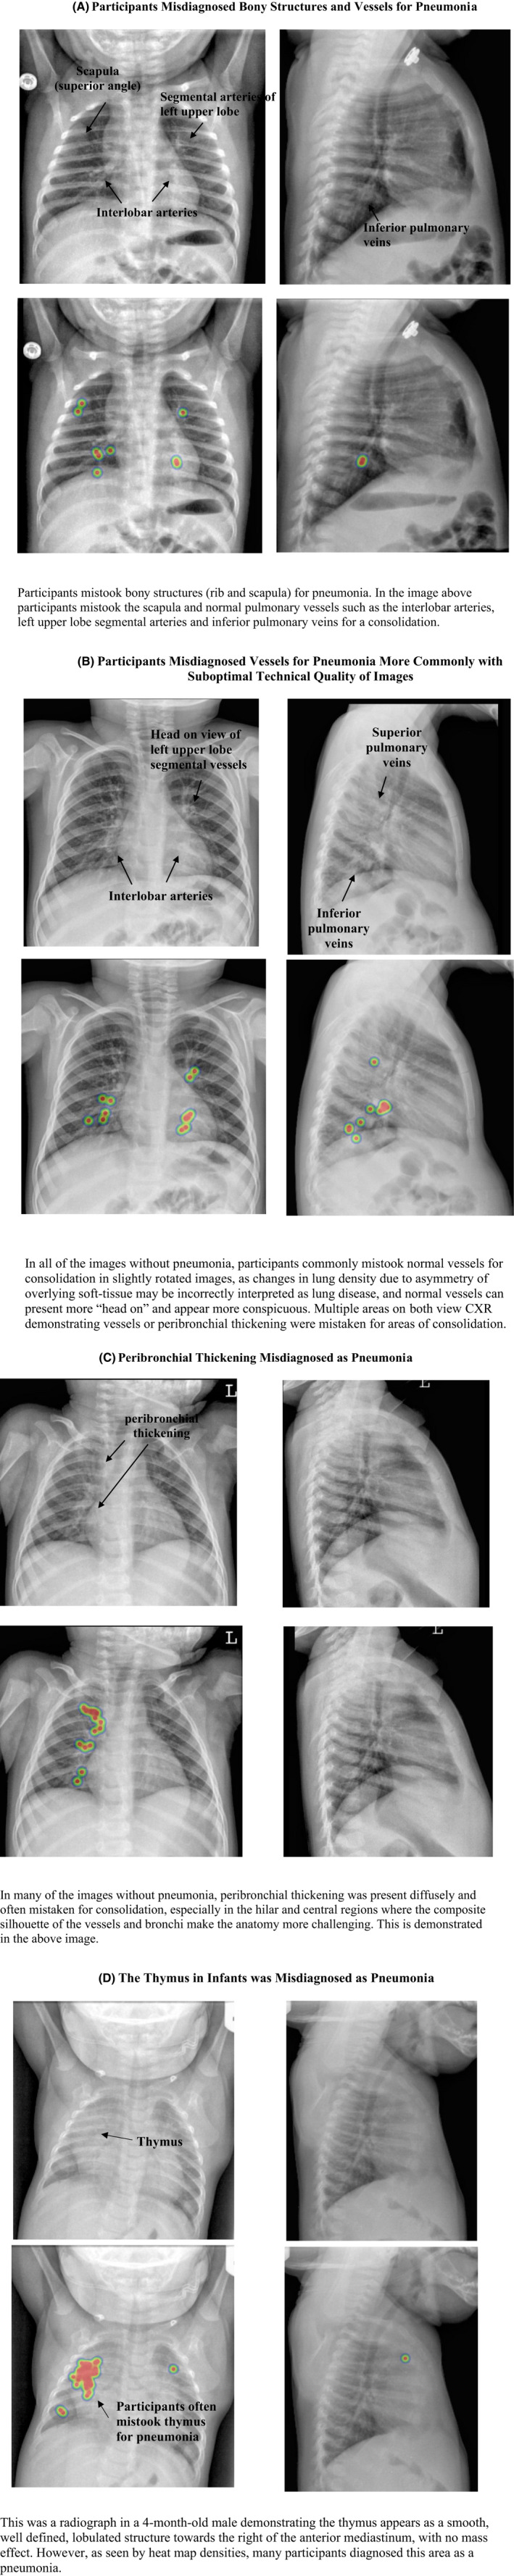
Variable‐related themes (A–D) identified during descriptive review of the most misdiagnosed normal pediatric CXR. Image examples present with respective heat map analyses, which demonstrate the relative frequency of areas that participants thought there was a pneumonia. The unmarked radiographs were compared to the overlaid image showing hot spots to derive themes. CXR, chest radiographs
Participant process measures
Image review process comparisons between career levels
There was no significant difference among career stages of participants with respect to frequency of two views reviewed (Table 3). However, in a significant interaction effect, the probability of case correctness increased for medical students when they examined both views but was significantly decreased in comparison to medical students when faculty (p = 0.003) examined both views (Figure S2A).
TABLE 3.
Image review processes across different experience levels
| Variable |
Medical students (n = 12) |
Postgraduate trainees (n = 22) |
Faculty (n = 18) |
p‐value |
|---|---|---|---|---|
| Median accuracy, % (IQR) | 65.0 (53.1–72.5) | 70.6 (64.5–75.5) | 75.5 (72.7–79.8) | 0.001 |
| Frequency of two radiograph views reviewed (where available), % (IQR) | 84.0 (8.6–95.7) | 96.2 (85.7–99.5) | 97.8 (68.8–100) | 0.09 |
| Frequency of participant “definite” response, % (IQR) | 22.0 (15.0–32.0) | 35.0 (21.5–45.2) | 52.0 (34.8–65.5) | 0.004 |
|
Median time on case, seconds (IQR) |
22.2 (10.8–36.1) | 23.1 (17.4–43.0) | 29.8 (20.2–55.8) | 0.17 |
We also observed a significant difference among career levels with respect to participant certainty (Table 3); in particular, faculty responded using “definitely” more frequently than medical students (p = 0.002). In addition, the probability of correct case was not different across the groups when they responded with “probably,” but differentially increased for faculty (p < 0.0001), compared to medical students, when they submitted a response with “definitely” (Figure S2B). However, 25.2% of incorrect faculty responses were still submitted with the “definitely” qualifier. Median time on case did not differ among groups (Table 3), but a longer time spent on a case was associated with a decreased probability of case correctness (p < 0.0001; Figure S2C).
DISCUSSION
Using learning analytics and a higher–lower experience participant comparison study, we prospectively identified actionable learning opportunities in a complex visual diagnosis domain, the pCXR. Specifically, we identified several image‐based variables that were associated with a difficult pCXR interpretation. Furthermore, the comparison across experience levels demonstrated that image review processes may impact resultant accuracy. Overall, these learning analytic data can be used to identify instructional priorities, methods, and assessments for the task of visual diagnosis.
Currently, most case difficulty assignments are derived using expert opinion and often on a relatively small sample of items. 32 , 33 In contrast, this study used a sample of radiographs that is representative of broad range of pCXR taken in clinical practice to rule out pneumonia. This provided a comprehensive and reliable stimulus sample upon which participant responses are measured to determine interpretation difficulty scores. 33 , 34 Furthermore, expert opinion of assigning difficulty to items has been found to correlate poorly with data‐driven estimates of item difficulty index across a variety of clinical skills. 35 , 36 Prior work has also a used an epidemiological approach to identify pCXR features that may add to diagnostic difficulty, 9 , 18 , 37 but this approach may be less efficient than the approach used in this research, where we were able to acquire over 10,000 pCXR interpretations across a range of physician interpretations that work in different settings in just a few months. Thus, the methods used in this research may provide a more efficient, reliable, and valid mechanism relative to other study methods for deriving in‐depth information on diagnostically challenging cases and opportunities for future research. 33 , 34 , 38
Participants made diagnostic errors with regular frequency in both pCXR with and without pneumonia, but most of the diagnostic errors were false negatives. Based on our data, the reasons for this may be related to diagnostic interpretation competency issues among our participants since the greatest challenges were in pCXR with low visibility and pneumonia in a single location. These types of errors may have also been represented more in this study since 60% of the pCXR demonstrated a pneumonia. Nevertheless, diagnostic errors in pCXR without pneumonia also occurred, especially in younger children, and these errors in clinical practice can lead to overuse of antibiotics and parental anxiety. 8 , 12 , 39 , 40 Of note, there is a relative paucity of literature examining the optimal case mix of diagnoses that should populate teaching sets with respect to base rate and spectrum of pathology. Prior work in image interpretation has focused on the proportions of normal and abnormal radiographs and how this impacts diagnostic sensitivity and specificity trade‐offs. Specifically, higher proportions of abnormal cases optimize sensitivity but compromise specificity and vice versa. 41 , 42 , 43 A high prevalence of abnormal cases can also overestimate the ability of observers to identify abnormalities and limits the opportunity to identify challenging radiographs without pathology. 41 Future research could explore the optimal case mix that also includes more specific variables found to contribute to diagnostic challenges such as those identified in this research (e.g., location, visibility, and type of pneumonia), and potentially weigh scoring differentially for difficult and/or clinically important errors. Importantly, similar data can be derived for other diagnostic image sets using our empirical methods to inform the optimal case mix and specific image presentations that should be included in teaching sets.
Image review processes by experienced versus novice participants may provide for a more multidimensional view of competency. Reviewing both views prior to committing to a diagnosis is in keeping with radiologist‐level image review patterns to optimize diagnostic accuracy 15 ; thus, efforts should be made to standardize this practice among more less experienced participants, especially since we also found that medical student accuracy increased when this was performed. Although there were no differences between experience levels with respect to time on case, this metric could also be used to assess a participant's competency in ensuring a sufficient time searching to identify pathology. 44 In contrast, we found that case correctness decreased as the review time increased, which may suggest that more difficult cases took longer to review, and even with a longer search, accuracy was lower in these harder cases. A clinician's ability to accurately self‐monitor the certainty of his or her response can reflect a clinician's ability to accurately question diagnoses at the bedside. 23 , 45 , 46 While faculty had a higher probability of case correctness when they expressed certainty of their diagnosis, faculty were also paradoxically certain for about one‐quarter of their incorrect responses. Thus, even faculty should be encouraged to keep an open mind about their diagnostic impressions, especially in pCXR without evident pneumonia. From an educational standpoint, analyzing image review processes across experience levels can identify those processes that can then be included alongside the more traditional medical education content of anatomy and pathology to enable the path to expertise.
LIMITATIONS
Image interpretations for the diagnosis of pneumonia were based on the expert opinion of pediatric radiologists; however, even these expert opinions may be subject to error. 10 Nevertheless, in the absence of an objective criterion standard, we adhered to the standards of using consensus readings since this is analogous to the clinical setting where a radiologist's interpretation is considered the reference standard for the diagnosis of pneumonia. 47 We dichotomized the scoring educational outcome, which results in less granularity of participant performance compared with a more extensive scale. However, the bedside task for clinicians is also dichotomous with respect to decision making, and therefore we favored ecological validity in our educational design at the marginal expense of internal validity. Only about half of our enrolled participants completed all 200 cases; thus, some of our secondary outcomes may be biased by data from more motivated participants. The ratings of the CXR may not have been entirely independent, which may have led to underpowered analyses. However, we point out that participants did not receive feedback on the correctness of their response after each case minimizing opportunity of one pCXR influencing future interpretations. Furthermore, we randomized the presentation order of the cases so that any given case would be just likely to be seen early as late. Finally, the issue of underpowered analyses would only come into play for Type II errors. This study was completed in an electronic platform that does not provide the same viewing experience as a radiology workstation in the hospital setting, and thus participant performance found that this study may not translate to performance in clinical practice. This study was conducted using participants located in Canada and the United States; thus, these results may not be generalizable to other practice settings.
CONCLUSIONS
Using a digital platform, mixed methods, and experienced–novice participant comparisons, we identified actionable learning opportunities in a common but diagnostically challenging radiograph. Specifically, we identified imaging features that increased diagnostic difficulty, which can inform a customized weighting of which cases to include in an education intervention. Furthermore, the experienced‐novice participant comparisons permitted for a more multidimensional view of competency, which includes skill development in image review processes as well as performance outcomes.
CONFLICT OF INTEREST
Dr. Kathy Boutis is married to Dr. Martin Pecaric, who owns Contrail Consulting Services Inc. Contrail Consulting Services Inc. provides software development and support services for this education research study under a formal contract and relationship management agreement with the Hospital for Sick Children and University of Toronto. Dr. Boutis is also the academic director for ImageSim, and participants were provided free access to the pediatric chest radiograph course on this learning platform if they completed all 200 cases. She is not paid for her role as academic director. The other authors have no potential conflicts to disclose.
AUTHOR CONTRIBUTIONS
Elana Thau, Kathy Boutis, Martin Pecaric, Manuela Perez, David Rizzuti, and Martin V. Pusic conceived the study and obtained research funding. Elana Thau, Kathy Boutis, Martin Pecaric, Manuela Perez, and David Rizzuti were involved in study implementation. Kathy Boutis and Martin V. Pusic were responsible for the biostatistical design and performed all analyses. Elana Thau drafted the manuscript, and all authors contributed substantially to its revision.
Supporting information
Data Supplement S1. Supplemental material.
Supplemental Table 1: Participant Demographics
Supplemental Figure 1: A Histogram of Interpretation Difficulty of Chest Radiographs. The y‐axis represents the frequency of items with a particular item difficulty score. The x‐axis represents the item difficulty score calculated using one‐parameter item response theory, from easiest (negative numbers) to hardest (positive numbers). Panel (A) is all CXR items, while panel (B) represent the CXR without pneumonia and panel (C) represents the items with pneumonia. For purposes of comparison, the vertical black line on each panel delineates where difficulty = 0 logits.
Supplemental Figure 2: These data represent the effect of the interaction of career level (medical student, post‐graduate trainee or faculty) with image review process variables on the dependent variable of case correctness. In Figure 4A, case correctness increased with looking at both views for medical students but decreased for post‐graduate trainees and faculty. In Figure 4B, case correctness was not different between the groups when there was participant uncertainty (“probably”) but faculty and post‐graduate trainee case correctness significantly increased relative to medical students when they were certain (“definitely”) of their response. In 4C, case correctness decreased similarly for all the groups the longer cases were reviewed.
ACKNOWLEDGEMENTS
The authors thank the study participants for taking their time to complete cases for this research.
Thau E, Perez M, Pusic MV, Pecaric M, Rizzuti D, Boutis K. Image interpretation: Learning analytics–informed education opportunities. AEM Educ Train. 2021; 5: e10592. 10.1002/aet2.10592
Funding information
This study was funded by the Hospital for Sick Children Pediatric Consultants Medical Education Research Grant.
Supervising Editor: Sam Clarke
REFERENCES
- 1. Graber ML, Wachter RM, Cassel CK. Bringing diagnosis into the quality and safety equations. JAMA. 2012;308(12):1211‐1212. [DOI] [PubMed] [Google Scholar]
- 2. Cirigliano M, Guthrie CD, Pusic MV. Click‐level learning analytics in an online medical education earning platform. Teach Learn Med. 2020;32(4):410‐421. [DOI] [PubMed] [Google Scholar]
- 3. LAK 2011: 1st International Conference Learning Analytics and Knowledge. 2011. Accessed February 11, 2021. http://www.wikicfp.com/cfp/servlet/event.showcfp?eventid=11606
- 4. Taves J, Skitch S, Valani R. Determining the clinical significance of errors in pediatric radiograph interpretation between emergency physicians and radiologists. CJEM. 2018;20(3):420‐424. [DOI] [PubMed] [Google Scholar]
- 5. Castro D, Yang J, Greer ML, et al. Competency based medical education—towards the development of a standardized pediatric radiology testing module. Acad Radiol. 2020;27(11):1622‐1632. [DOI] [PubMed] [Google Scholar]
- 6. Kelly BS, Rainford LA, Darcy SP, Kavanagh EC, Toomey RJ. The development of expertise in radiology: in chest radiograph interpretation, “expert” search pattern may predate “expert” levels of diagnostic accuracy for pneumothorax identification. Radiology. 2016;280(1):252‐260. [DOI] [PubMed] [Google Scholar]
- 7. Al aseri Z. Accuracy of chest radiograph interpretation by emergency physicians. Emerg Radiol. 2009;16(2):114‐124. [DOI] [PubMed] [Google Scholar]
- 8. Kramer MS, Roberts‐Bräuer R, Williams RL. Bias and ‘overcall’ in interpreting chest radiographs in young febrile children. Pediatrics. 1992;90:11‐13. [PubMed] [Google Scholar]
- 9. Williams GJ, Macaskill P, Kerr M, et al. Variability and accuracy in interpretation of consolidation on chest radiography for diagnosing pneumonia in children under 5 years of age. Pediatr Pulmonol. 2013;48(12):1195‐2000. [DOI] [PubMed] [Google Scholar]
- 10. Albaum MN, Hill LC, Murphy M, et al. Interobserver reliability of the chest radiograph in community‐acquired pneumonia. PORT Investigators. Chest. 1996;110(2):343‐350. [DOI] [PubMed] [Google Scholar]
- 11. Margolis SA, Nilsson KA, Reed RL. Performance in reading radiographs: does level of education predict skill? J Contin Educ Health Prof. 2003;23(1):48‐53. [DOI] [PubMed] [Google Scholar]
- 12. Schuh S, Lalani A, Manson D, et al. Evaluation of the utitlity of radiography in acute bronchiolitis. J Pediatrics. 2007;150(4):429‐433. [DOI] [PMC free article] [PubMed] [Google Scholar]
- 13. Waite S, Grigorian A, Alexander RG, et al. Analysis of perceptual expertise in radiology ‐ current knowledge and a new perspective. Front Hum Neurosci. 2019;13:272. [DOI] [PMC free article] [PubMed] [Google Scholar]
- 14. Itri JN, Patel SH. Heuristics and cognitive error in medical imaging. AJR Am J Roentgenol. 2018;210(5):1097‐1105. [DOI] [PubMed] [Google Scholar]
- 15. Pecaric MR, Boutis K, Beckstead J, Pusic MV. A big data and learning analytics approach to process‐level feedback in cognitive simulations. Acad Med. 2017;92(2):175‐184. [DOI] [PubMed] [Google Scholar]
- 16. Leblanc VR, Brooks LR, Norman GR. Believing is seeing: the influence of a diagnostic hypothesis on the interpretation of clinical features. Acad Med. 2002;77(10 Suppl):S67‐S69. [DOI] [PubMed] [Google Scholar]
- 17. Raoof S, Feigin D, Sung A, Raoof S, Irugulpati L, Rosenow EC 3rd. Interpretation of plain chest roentgenogram. Chest. 2012;141(2):545‐558. [DOI] [PubMed] [Google Scholar]
- 18. Elemraid MA, Muller M, Spencer DA, et al. Accuracy of the interpretation of chest radiographs for the diagnosis of paediatric pneumonia. PLoS One. 2014;9(8):e106051. [DOI] [PMC free article] [PubMed] [Google Scholar]
- 19. Lynch T, Gouin S, Larson C, Patenaude Y. Does the lateral chest radiograph help pediatric emergency physicians diagnose pneumonia? A randomized clinical trial. Acad Emerg Med. 2004;11(6):625‐629. [PubMed] [Google Scholar]
- 20. Jana M, Bhalla AS, Gupta AK. Approach to pediatric chest radiograph. Indian J Pediatrics. 2016;83:533‐542. [DOI] [PubMed] [Google Scholar]
- 21. Cherian T, Mulholland EK, Carlin JB, et al. Standardized interpretation of paediatric chest radiographs for the diagnosis of pneumonia in epidemiological studies. Bull World Health Organ. 2005;83:353‐359. [PMC free article] [PubMed] [Google Scholar]
- 22. Boutis K, Pecaric M, Seeto B, Pusic M. Using signal detection theory to model changes in serial learning of radiological image interpretation. Adv Health Sci Educ Theory Pract. 2010;15:647‐658. [DOI] [PubMed] [Google Scholar]
- 23. Pusic MV, Chiaramonte R, Gladding S, Andrews JS, Pecaric MR, Boutis K. Accuracy of self‐monitoring during learning of radiograph interpretation. Med Educ. 2015;49(8):838‐846. [DOI] [PubMed] [Google Scholar]
- 24. Rutgers DR, van der Gijp A, Vincken KL, Mol CP, van der Schaaf MF, Cate TJ. Heat map analysis in radiological image interpretation: an exploration of its usefulness for feedback about image interpretation skills in learners. Acad Radiol. 2021;28(3):414–423. [DOI] [PubMed] [Google Scholar]
- 25. Bond TG, Fox CM. Applying the Rasch Model: Fundamental Measurement in the Health Sciences. . 2nd ed. Mahwah, NJ: Lawrence Erlbaum Associates Inc; 2007. [Google Scholar]
- 26. Boutis K, Cano S, Pecaric M, et al. Interpretation difficulty of normal versus abnormal radiographs using a pediatric example. CMEJ. 2016;7(1):e68‐77. [PMC free article] [PubMed] [Google Scholar]
- 27. Downing SM. Item response theory: applications of modern test theory in medical education. Med Educ. 2003;37(8):739‐745. [DOI] [PubMed] [Google Scholar]
- 28. Cohen J. Statistical Power Analysis for the Behavioral Sciences. Mahwah, NJ: Lawrence Erlbaum Associates; 1988. [Google Scholar]
- 29. Singer JD, Willett JB. Applied Longitudinal Data Analysis: Modeling Change and Event Occurrence. New York, NY: Oxford University Press; 2003. [Google Scholar]
- 30. Norton EC, Dowd BE, Maciejewsk ML. Marginal effects—quantifying the effect of changes in risk factors in logistic regression models. JAMA. 2019;321(13):1304‐1305. [DOI] [PubMed] [Google Scholar]
- 31. An X, Yung YF. Item Response Theory: What It Is and How You Can Use the IRT Procedure to Apply It. SAS. 2014. Accessed February 11, 2021. https://support.sas.com/resources/papers/proceedings14/SAS364‐2014.pdf
- 32. John‐Matthews JS, Wallace MJ, Robinson L. The Delphi technique in radiography education research. Radiography. 2017;1:S53‐S57. [DOI] [PubMed] [Google Scholar]
- 33. Wells GL, Windschitl PD. Stimulus sampling and social psychological experimentation. Pers Soc Psychol Bull. 1999;25(9):1115‐1125. [Google Scholar]
- 34. Maher BA. Stimulus sampling in clinical research: representative design reviewed. J Consult Clin Psychol. 1978;46(4):643‐647. [DOI] [PubMed] [Google Scholar]
- 35. Bourque J, Skinner H, Dupré J, et al. Performance of the Ebel standard‐setting method for the spring 2019 Royal College of Physicians and Surgeons of Canada internal medicine certification examination consisting of multiple‐choice questions. J Educ Eval Health Prof. 2020;17:12. [DOI] [PMC free article] [PubMed] [Google Scholar]
- 36. Mu EW, Pusic M, Coneybeare M, Meehan SA. Learning analytics to enhance dermatopathology education among dermatology residents. J Drugs Dermatol. 2019;18(12):1231‐1236. [PubMed] [Google Scholar]
- 37. Higginson I, Vogel S, Thompson J, Aickin R. Do radiographs from a pediatric emergency department in New Zealand need reporting? Emerg Med Australas. 2004;16:288‐294. [DOI] [PubMed] [Google Scholar]
- 38. Smith EV Jr, Stone GE. Criterion Referenced Testing: Practice Analysis to Score Reporting Using Rasch Measurement. Maple Grove, MN: JAM Press; 2009. [Google Scholar]
- 39. Lipsett SC, Monuteaux MC, Bachur RG, Finn N, Neuman MI. Negative chest radiography and risk of pneumonia. Pediatrics. 2018;142(3):e20180236. [DOI] [PubMed] [Google Scholar]
- 40. Parkinson GW, Gordon KE, Camfield CS, Fitzpatrick EA Anxiety in parents of young febrile children in a pediatric emergency department. Clin Pediatr. 1999;38(4):219‐226. [DOI] [PubMed] [Google Scholar]
- 41. Hardy M, Flintham K, Snaith B, Lewis EF. The impact of image test bank construction on radiographic interpretation outcomes: a comparison study. Radiography (Lond). 2016;22(166):e170. [Google Scholar]
- 42. Pusic MV, Andrews JS, Kessler DO, et al. Determining the optimal case mix of abnormals to normals for learning radiograph interpretation: a randomized control trial. Med Educ. 2012;46(3):289‐298. [DOI] [PubMed] [Google Scholar]
- 43. van Geel K, Kok EM, Aldekhayel AD, Robben SG, van Merriënboer JJ. Chest X‐ray evaluation training: impact of normal and abnormal image ratio and instructional sequence. Med Educ. 2019;53:153‐164. [DOI] [PMC free article] [PubMed] [Google Scholar]
- 44. Boutis K, Pecaric M, Ridley J, Andrews J, Gladding S, Pusic M. Hinting strategies for improving the efficiency of medical student learning of deliberately practiced web‐based radiographs. Med Educ. 2013;47(9):877‐887. [DOI] [PubMed] [Google Scholar]
- 45. Cavalcanti RB, Sibbald M. Am i right when i am sure? Data consistency influences the relationship between diagnostic accuracy and certainty. Acad Med. 2014;89(1):107‐113. [DOI] [PubMed] [Google Scholar]
- 46. Eva KW, Regehr G. “I'll never play professional football" and other fallacies of self‐assessment. J Contin Educ Health Prof. 2008;28(1):14‐19. [DOI] [PubMed] [Google Scholar]
- 47. Bankier AA, Levine D, Halpern EF, Kressel HY. Consensus interpretation in imaging research: is there a better way? Radiology. 2010;257(1):14‐17. [DOI] [PubMed] [Google Scholar]
Associated Data
This section collects any data citations, data availability statements, or supplementary materials included in this article.
Supplementary Materials
Data Supplement S1. Supplemental material.
Supplemental Table 1: Participant Demographics
Supplemental Figure 1: A Histogram of Interpretation Difficulty of Chest Radiographs. The y‐axis represents the frequency of items with a particular item difficulty score. The x‐axis represents the item difficulty score calculated using one‐parameter item response theory, from easiest (negative numbers) to hardest (positive numbers). Panel (A) is all CXR items, while panel (B) represent the CXR without pneumonia and panel (C) represents the items with pneumonia. For purposes of comparison, the vertical black line on each panel delineates where difficulty = 0 logits.
Supplemental Figure 2: These data represent the effect of the interaction of career level (medical student, post‐graduate trainee or faculty) with image review process variables on the dependent variable of case correctness. In Figure 4A, case correctness increased with looking at both views for medical students but decreased for post‐graduate trainees and faculty. In Figure 4B, case correctness was not different between the groups when there was participant uncertainty (“probably”) but faculty and post‐graduate trainee case correctness significantly increased relative to medical students when they were certain (“definitely”) of their response. In 4C, case correctness decreased similarly for all the groups the longer cases were reviewed.