

Summary
Disturbed neuronal activity in neuropsychiatric pathologies emerges during development and might cause multifold neuronal dysfunction by interfering with apoptosis, dendritic growth, and synapse formation. However, how altered electrical activity early in life affects neuronal function and behavior in adults is unknown. Here, we address this question by transiently increasing the coordinated activity of layer 2/3 pyramidal neurons in the medial prefrontal cortex of neonatal mice and monitoring long-term functional and behavioral consequences. We show that increased activity during early development causes premature maturation of pyramidal neurons and affects interneuronal density. Consequently, altered inhibitory feedback by fast-spiking interneurons and excitation/inhibition imbalance in prefrontal circuits of young adults result in weaker evoked synchronization of gamma frequency. These structural and functional changes ultimately lead to poorer mnemonic and social abilities. Thus, prefrontal activity during early development actively controls the cognitive performance of adults and might be critical for cognitive symptoms in neuropsychiatric diseases.
Keywords: prefrontal cortex, development, gamma oscillations, excitation/inhibition, working memory
Graphical abstract
Highlights
-
•
Increasing neonatal coordinated activity causes transient dendritic surge in mPFC
-
•
Increasing neonatal activity disrupts gamma synchrony in adult prefrontal circuits
-
•
Increasing neonatal activity causes excitation/inhibition imbalance in adult mPFC
-
•
Increasing neonatal prefrontal activity disrupts adult cognitive abilities
Bitzenhofer et al. manipulate early activity in the prefrontal cortex of neonatal mice, resulting in disruption of coordinated patterns of electrical activity, excitation-inhibition imbalance, and impaired cognitive abilities at adult age. Thus, prefrontal activity during development is critical for adult network function and behavioral performance.
Introduction
The prefrontal cortex acts as a hub of cognitive processing indispensable for daily life (Frith and Dolan, 1996; Miller, 2000). Disruption of prefrontal cortex-dependent short-term memory and executive performance is a major burden with neuropsychiatric diseases such as schizophrenia and autism spectrum disorders (Baron-Cohen, 2004; van Os and Kapur, 2009; Stuchlik and Sumiyoshi, 2014). These diseases are associated with a large variety of genes and environmental risk factors that increase susceptibility (Clifton et al., 2019; Sahin and Sur, 2015). The absence of a clear understanding of their pathophysiology has resulted in primarily symptom-based treatments with low response rates (Marín, 2016). Many of the genes and risk factors associated with neuropsychiatric diseases regulate brain development, leading to the hypothesis that abnormal maturation causes impaired network function and, ultimately, poor cognitive abilities later in life (Geschwind, 2011; Hall et al., 2015; Marín, 2016; Schmitt et al., 2014). Indeed, rhythmic network activity of cortical and particularly prefrontal circuits is already compromised in prodromal patients (Leicht et al., 2016; Mikanmaa et al., 2019) and during early postnatal development in mouse models of schizophrenia and autism (Chini et al., 2020; Hartung et al., 2016a; Peixoto et al., 2016; Richter et al., 2019).
Neuronal activity regulates the development of cortical networks in many ways, from controlling neuronal differentiation, migration, and apoptosis to shaping establishment of sensory maps and local and large-scale networks (Blanquie et al., 2017; Katz and Shatz, 1996; Kirischuk et al., 2017; Kirkby et al., 2013). Early in life, activity in the prefrontal cortex is coordinated in oscillatory patterns, but, in line with delayed structural maturation and emergence of cognitive abilities, these patterns appear later than in other cortical areas (Brockmann et al., 2011; Chini and Hanganu-Opatz, 2020). Inputs from cortical and subcortical areas boost activation of local prefrontal circuits (Ahlbeck et al., 2018; Brockmann et al., 2011; Hartung et al., 2016b; Janiesch et al., 2011). Moreover, intracortical interactions lead to emergence of oscillatory activity at fast frequencies (Bitzenhofer et al., 2015, 2017a, 2020). However, whether early activity is necessary for maturation of prefrontal function and cognitive abilities is still unknown. Conversely, whether altered activity during development actively contributes to adult miswiring instead of simply reflecting pathological maturation remains to be elucidated.
To address these questions, we manipulated cortical activity during early development and monitored the long-term consequences for network activity and behavioral abilities. The manipulation was performed by transient light stimulation of a subset of pyramidal neurons (PYRs) in layer (L) 2/3 of the mouse medial prefrontal cortex (mPFC) from post-natal day 7 (P7) to P11, the developmental time window corresponding to the second/third trimester of gestation in humans (Workman et al., 2013). This light stimulation induces rhythmic activity in beta/low gamma frequency in the developing PFC (Bitzenhofer et al., 2017a). Throughout the neocortex, at the age of stimulation, migration of cortical neurons is largely finished, and activity-dependent formation of synaptic connections is fully in progress (Anastasiades and Butt, 2012; Van Eden and Uylings, 1985; Lim et al., 2018). We focused on this developmental period of cortical network formation, when mouse models of psychiatric diseases start to show altered prefrontal activity caused by L2/3 PYR dysfunction (Chini and Hanganu-Opatz, 2020; Chini et al., 2020). We demonstrate that the transient increase in prefrontal activity during early development is sufficient to disrupt prefrontal function and cognitive performance at adult age.
Results
Stimulation of L2/3 PYRs induces coordinated activity in the neonatal mPFC
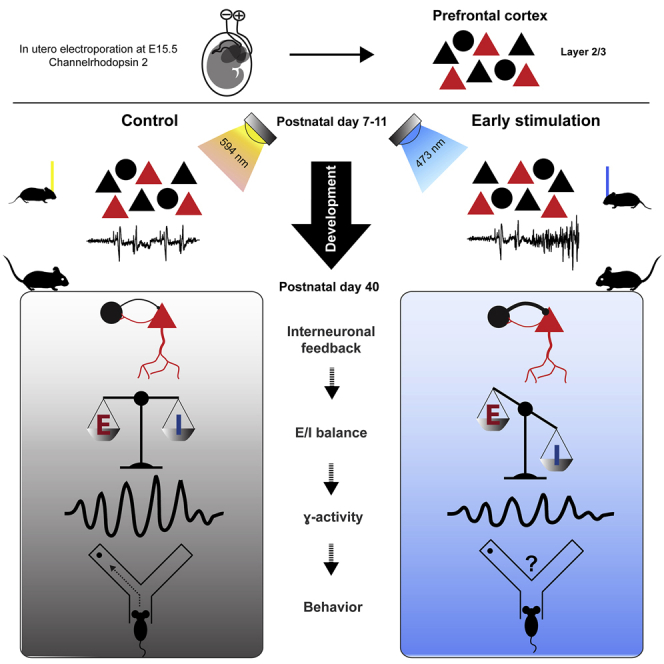
To uncover the role of early activity in adult prefrontal function, we first established a protocol to optically manipulate the activity of L2/3 PYRs from P7–P11, a developmental time window of high relevance for formation of synaptic contacts in the mPFC (Figure 1A). A subset of precursor cells of L2/3 PYRs in the prelimbic subdivision of the mPFC was transfected with channelrhodopsin 2 E123T/T159C (ChR2(ET/TC)) by in utero electroporation (IUE) at embryonic day 15.5 (E15.5) (STAR methods). As reported previously, the IUE protocol yields unilateral expression of ChR2(ET/TC) in 20%–30% of PYRs confined to L2/3 in the mPFC (Figure 1B; Bitzenhofer et al., 2017b).
Figure 1.

Light stimulation of L2/3 PYRs in the neonatal mPFC
(A) Schematic of the protocol for early light stimulation and long-lasting monitoring of structural, functional, and behavioral effects during development.
(B) Representative image showing ChR2(ET/TC)-2A-RFP expression in L2/3 PYRs after IUE at E15.5 in a DAPI-stained coronal slice, including the mPFC, from a P11 mouse. RFP, red fluorescent protein
(C) Representative extracellular recording with a corresponding wavelet spectrum at an identical timescale during transcranial ramp light stimulation (473 nm, 3 s) of L2/3 PYRs in the mPFC of a P10 mouse.
(D) Modulation index of local field potential (LFP) power in response to ramp light stimulation at 473 nm (blue) and 594 nm (yellow) averaged for P7–P11 mice (n = 13 mice).
(E) Peak strength for transcranial ramp light stimulation at different intensities and durations for P7–P11 mice (n = 11 mice).
(F) Firing rates of single units (n = 180 units from 13 mice) in response to transcranial ramp light stimulation Z scored to the pre-stimulation period at P7–P11.
(G) Percentage of significantly modulated units (p < 0.01) during ramp light stimulation.
(H) Average single-unit firing rate in response to ramp light stimulation at 473 nm and 594 nm averaged for P7–P11 mice (n = 180 units from 13 mice).
(I) Power of single-unit autocorrelations during ramp light stimulation at 473 nm and 594 nm averaged for P7–P11 mice (n = 180 units from 13 mice).
In (D) and (I), data are presented as mean ± SEM. In (H), data are presented as median with 25th and 75th percentiles; the shaded area represents the probability distribution of the variable. Asterisks (∗p < 0.05, ∗∗p < 0.01, ∗∗∗p < 0.001) indicate significant differences. See also Figure S1 and Table S1 for detailed statistics.
Ramp stimulation of linearly increasing light power (473 nm, 3 s) was used to transcranially activate transfected L2/3 PYRs from P7–P11. In line with previous data (Bitzenhofer et al., 2017a), prefrontal network activity tended to organize itself rhythmically in the beta frequency range at 15–20 Hz upon ramp stimulation (Figures 1C and 1D). Control light stimulation (594 nm, ramp, 3 s) that did not activate ChR2(ET/TC) did not change the network activity in the mPFC. Transcranial ramp light stimulation was titrated in power and duration to reliably induce oscillatory bursts that resemble those occurring spontaneously in the neonatal mPFC (Figures 1E and S1; Brockmann et al., 2011; Lindemann et al., 2016). Transcranial ramp light stimulation transiently increased neuronal firing in a subset of neurons (20.6% of units activated significantly, 0.0% of units inactivated significantly) (Figures 1F and 1G). Control light stimulation (594 nm, ramp, 3 s) did not change the firing activity in the mPFC. The average firing rate increased during stimulation and continued to be increased significantly 2 s after stimulation before dropping back to pre-stimulation levels (Figure 1H). Induced firing was not random but peaked at 15–20 Hz for individual units, in line with the induced beta band network activity (Figure 1I).
A transient increase in prefrontal activity during neonatal development disrupts cognitive performance of young adults
To transiently increase neuronal firing and network activation in the developing mPFC, we performed a transcranial stimulation protocol, which induced fast oscillatory discharges, daily from P7–P11. This developmental period has been identified as being critical for altered prefrontal activity in a mouse model of neuropsychiatric diseases (Chini et al., 2020). On each of the 5 days of manipulation, mice received 180 transcranial ramp light stimulations (3 s long, 7-s intervals) at 594 nm (control) or 473 nm (early stimulation, ES) to activate ChR2(ET/TC)-transfected L2/3 PYRs in the mPFC.
Subsequently, we tested the behavioral abilities of control and ES mice, focusing on tasks that require prefrontal function. Data from mice of both sexes were pooled because their performance was comparable in all tasks (Table S2). Transient ES did not affect overall somatic and reflex development (Figure S2A). First we monitored recognition memory as a form of short-term memory that emerges at pre-juvenile age (P16–P22), as soon as sensory and motor abilities are fully mature (Le Roy et al., 2001). In contrast to control mice, ES mice were not able to distinguish a novel from a familiar object (novel object recognition [NOR]) as well as an object they interacted with more recently (recency recognition [RR]) (Figures S2C and S2E). However, because of the large variability of behavioral performance at juvenile age, group differences did not reach the significance threshold. The novel position of an object (object location recognition [OLR]) was distinguished by control and ES mice (Figure S2D). In contrast to NOR and RR, OLR depends more on the hippocampus (HP) than the mPFC (Barker and Warburton, 2011). Social interactions were impaired significantly in pre-juvenile ES mice. Their preference for interaction with the dam-containing container over an empty container was reduced significantly compared with control mice (Figure 2A).
Figure 2.

Transient ES impairs the cognitive abilities of juvenile and young adult mice
(A) Schematic of the maternal interaction task and violin plot displaying the discrimination ratio of interaction time with the mother versus empty bin for control (n = 19) and ES (n = 21) mice at P21 (Wilcoxon rank; control, p < 0.001; ES, p = 0.045; control ES, p < 0.001).
(B) Representative tracking of a control (left) and an ES mouse (right) in an 8-arm radial maze memory task with 4 baited arms at P36–P38.
(C) Plots displaying the relative reference (left) and working-memory errors (right) in the 8-arm radial maze memory task over 10 trials on 3 consecutive days for control (n = 12) and ES (n = 12) mice. (Kruskal-Wallis; relative reference memory errors, p < 0.001; relative working memory errors, p < 0.001).
(D) Photograph illustrating a spontaneous alternation task in a Y maze (left) and violin plot displaying the percentage of spontaneous alternations (right) for control (n = 12) and ES (n = 12) mice at P39. (Wilcoxon rank, p = 0.006).
(E) Photograph illustrating a delayed non-match-to-sample task in a Y maze (left) and dot plot displaying the percentage of correct choices over 12 consecutive trials (6 trials/day) (right) for control (n = 12) and ES (n = 12) mice at P39–P40.
In (A) and (D), data are presented as median with 25th and 75th percentiles; the shaded area represents the probability distribution of the variable. In (C), data are presented as median ± median absolute deviation (MAD). Black lines and asterisks (∗p < 0.05, ∗∗p < 0.01, ∗∗∗p < 0.001) indicate significant differences. See also Figure S2 and Tables S1 and S2 for detailed statistics.
Second, we tested the mPFC-dependent working memory of young adult (P36–P40) control and ES mice. We used an 8-arm radial maze test with 4 baited arms, a Y-maze test for spontaneous alternations, and a delayed non-match-to-sample task. ES mice showed working memory and reference memory deficits in the 8-arm radial maze test (Figures 2B, 2C, and S2F). Moreover, compared with controls, ES mice showed poorer performance during spontaneous alternation (Figures 2D and S2G) and in the delayed non-match-to-sample task (Figure 2E). The deficits identified in ES mice are not due to impaired motor abilities or enhanced anxiety because neither the behavior in an open field nor the interactions with objects and mazes were different between groups (Figures S2B, 2F, and 2G). Thus, transient elevation of prefrontal activity at neonatal age caused long-lasting impairment of mPFC-dependent short-term and working memory as well as social behavior.
A transient increase in neonatal prefrontal activity induces premature dendritic growth in L2/3 PYRs
To test whether impaired cognitive abilities of juvenile and adult ES mice resulted from permanent structural disruption of the mPFC after a transient increase in neonatal activity, we monitored the structural development of PYRs in control and ES mice. The density of Ca2+/calmodulin-dependent protein kinase II (CaMKII)-positive neurons and ChR2(ET/TC)-transfected neurons in the prelimbic subdivision of the mPFC did not differ between control and ES mice at any of the investigated developmental time points (P11–P12, P23–P25, and P38–P40) (Figure S3). Investigation of the dendritic morphology of L2/3 PYRs after transient stimulation at P7–P11 revealed that, immediately after this time window, the dendritic arborization of these neurons was increased in ES compared with control mice (Figures 3A–3C). However, the exuberant arborization was transient, and from P23–P25 onward, the dendritic arbors of L2/3 PYRs in the mPFC of ES mice were similar to controls. A comparison across age revealed that the dendritic length increased with age for control (linear mixed effect model [LMEM]; P11–P12 to P23–P25, ∗∗p = 0.002; P11–P12 to P38–P40, ∗∗∗p = 0.0002), but not for ES mice (LMEM; P11–P12 to P23–P25, p = 0.79; P11–P12 to P38–P40, p = 0.07).The dendritic length of L2/3 PYRs in ES mice at P11–P12 was comparable with that in control mice at P23–P25 (LMEM, p = 0.33). In-depth analysis of dendritic spines showed that the spine density was larger in P11–P12 ES mice (Figures 3D and 3E). These results suggest that increased activity in the neonatal mPFC relates to premature dendritic maturation of L2/3 PYRs.
Figure 3.

Transient ES induces premature dendritic growth in prefrontal L2/3 PYRs
(A) Representative photographs and corresponding average heatmaps of ChR2(ET/TC)-transfected L2/3 PYRs in the mPFC of P11–P12, P23–P25 and P38–P40 control (left) and ES mice (right).
(B) Line plots of dendritic intersections of L2/3 PYRs with concentric circles (0- to 250-μm radius) centered around the soma, averaged for control (18 cells of 3 mice/age group) and ES mice (18 cells of 3 mice/age group) at P11–P12, P23–P25, and P38–P40 (LMEM; P11–P12, p < 0.001; P23–P25, p < 0.001; P38–P40, p < 0.001).
(C) Violin plots displaying the dendritic length and soma area of L2/3 PYRs for control (18 cells from 3 mice/age group) and ES (18 cells from 3 mice/age group) mice for different age groups (LMEM; dendritic length: P11–P12, p = 0.007; P23–P25 p = 0.631; P38–P40, p = 0.161).
(D) Representative photographs of dendritic segments of ChR2(ET/TC)-transfected L2/3 PYRs in the mPFC of P11–P12 mice.
(E) Violin plots of dendritic spine density for control (124 dendrites, 17 cells, 3 mice) and ES mice (110 dendrites, 15 cells, 3 mice) at P11–P12 (LMEM; apical, p = 0.106; oblique, p = 0.013; basal, p = 0.001; secondary apical, p = 0.016).
In (B), data are presented as mean ± SEM. In (C) and (E), data are presented as median with 25th and 75th percentiles; the shaded area represents the probability distribution of the variable. Black lines and asterisks (∗p < 0.05, ∗∗p < 0.01, ∗∗∗p < 0.001) indicate significant differences. See Table S1 for detailed statistics. Black lines and asterisks (∗p < 0.05, ∗∗p < 0.01, ∗∗∗p < 0.001) indicate significant differences. See also Figure S3 and Table S1 for detailed statistics.
A transient increase in neonatal prefrontal activity reduces gamma power and network synchrony in the adult mPFC
Transient alteration of neonatal activity might perturb the function of prefrontal circuits, ultimately leading to abnormal behavior. To test this hypothesis, we monitored spontaneous neuronal and network activity of the mPFC across development. We performed extracellular recordings from head-fixed control and ES mice immediately after transient ES (P11–P12) as well as at juvenile (P23–P26) and young adult (P38–P40) age (Figures 4A and 4B). With increasing age, spontaneous oscillatory activity in the mPFC of control and ES mice increased in power, and fast oscillations within 12–100 Hz became more prominent and faster (Figure 4C), consistent with the recently described acceleration of gamma activity during mPFC development (Bitzenhofer et al., 2020). At P11–P12, the power of these fast oscillations was higher in the mPFC of ES mice compared with control mice, potentially because of premature growth of L2/3 PYRs dendrites. At later stages of development, no differences were detected between control and ES mice. In contrast, the firing rates of single units were similar in control and ES mice during development, but, in adulthood, ES mice showed decreased firing in the mPFC (Figure 4D). Even though spontaneous (i.e., task/input-unrelated) activity is largely unaffected by the transient increase in activity at neonatal age, the mPFC might be engaged in tasks abnormally, reflecting disrupted processing and, ultimately, behavior. To test this hypothesis, we recorded prefrontal activity of control and ES mice during a social preference task when they could navigate freely in a mobile home cage at P38–P40 (Figure 4E). In contrast to controls, ES mice did not prefer interacting with another mouse over an object (Figures 4F and 4G). Although fast oscillations in the mPFC were similar for control and ES mice during periods of no interaction, gamma power quantified in the range of 40–80 Hz was reduced significantly for ES mice during interaction with another mouse (Figure 4H).
Figure 4.

Transient ES has minor effects on spontaneous network activity but impairs task-related gamma oscillations in the mPFC
(A) Top: schematic illustrating the recording setups used for young mice with limited motor abilities (head fixed, no movement) and for juvenile and young adult mice (head fixed, moving freely on a spinning disk). Bottom: schematic of the recording configuration in the developing mPFC.
(B) Representative extracellular recordings in the mPFC at P12, P24, and P40.
(C) Left: average power spectra of spontaneous network activity in the mPFC of control and ES mice at P11–P12 (control, n = 11 recordings, 11 mice; ES, n = 10 recordings, 10 mice; inset at a different scale), P23–P26 (control, n = 13 recordings, 6 mice; ES, n = 14 recordings, 5 mice), and P38–P40 (control, n = 12 recordings, 5 mice; ES, n = 12 recordings, 5 mice). Right: scatterplots displaying peak strength and peak frequency of LFP power for control and ES mice (Wilcoxon rank, P11–P12, peak frequency p = 0.245, peak strength p = 0.015, LMEM, P23–P26, peak frequency p = 0.643, peak strength p = 0.665, P38–P40, peak frequency p = 0.856, peak strength p = 0.750).
(D) Violin plots displaying the firing rates of single units in the mPFC, averaged for control and ES mice at P11–P12, P23–P26, and P38–P40. (Wilcoxon rank, P11–P12 p = 0.275, LMEM, P23–P25 p = 0.072, P38–P40 p = 0.041).
(E) Schematic illustrating the setup used for in vivo extracellular recordings in P38–P40 mice during a social preference task in a mobile home cage.
(F) Heatmaps showing the preferred position of control (15 trials of 8 mice) and ES mice (13 trials of 7 mice) during a social preference task in a mobile home cage (15-min duration).
(G) Violin plots displaying the discrimination ratio of mouse versus object (LMEM, p < 0.001), no interaction versus mouse (LMEM, p < 0.001), and no interaction versus object (LMEM, p = 0.492) for control (15 trials of 8 mice) and ES mice (13 trials of 7 mice).
(H) Average power spectra of network activity in the mPFC (top) and power in the gamma frequency (bottom, 40–80 Hz) of control (14 recordings from 8 mice) and ES (12 recordings from 7 mice) mice at P38–P40 in the mobile home cage during no interaction (LMEM, p = 0.353), interaction with another mouse (LMEM, p = 0.019) and interaction with an object (LMEM, p = 0.052).
In (C) and (H) data are presented as mean ± SEM. In (D), (G), and (H), data are presented as median with 25th and 75th percentiles; the shaded area represents the probability distribution of the variable. Asterisks (∗p < 0.05, ∗∗p < 0.01, ∗∗∗p < 0.001) indicate significant differences. See Table S1 for detailed statistics.
To corroborate the hypothesis that task/input-related mPFC activity is disturbed after transient ES, we used two additional approaches. The first approach relies on optogenetics to acutely stimulate ChR2(ET/TC)-transfected L2/3 PYRs in control and ES mice. Acute light stimulation (ramp, 473 nm, 3 s) triggered fast rhythmic activity with peak frequencies increasing from 15–20 Hz (beta frequency range) at P11–P12 to 50–60 Hz (gamma frequency range) at P23–P26 and P38–P40 in the mPFC of control and ES mice (Figure 5A), in line with the recently described acceleration of fast frequency oscillations during prefrontal development (Bitzenhofer et al., 2020). However, at P38–P40, the magnitude of light-induced gamma activity was significantly smaller in ES mice compared with controls.
Figure 5.

Transient ES decreases evoked network and neuronal gamma rhythmicity in the adult mPFC
(A) Left: modulation index of LFP power in response to acute ramp light stimulation (473 nm, 3 s) for control and ES mice at P11–P12 (control, n = 11 recordings, 11 mice; ES, n = 10 recordings, 10 mice), P23–P26 (control, n = 13 recordings, 6 mice; ES n = 14 recordings, 15 mice) and P38–P40 (control, n = 12 recordings, 5 mice; ES, n = 12 recordings, 5 mice). Right: scatterplots displaying the peak strength and peak frequency of the power modulation index for control and ES mice (Wilcoxon rank, P11–P12, peak frequency p = 0.307, peak strength p = 0.307, LMEM, P23–P26, peak frequency p = 0.136, peak strength p = 0.419, P38–P40, peak frequency p = 0.913, peak strength p = 0.043).
(B) Z-scored autocorrelograms of single units during acute ramp light stimulation, arranged by magnitude for control and ES mice at P11–P12 (control, n = 213 units, 11 mice; ES, n = 185 units, 10 mice), P23–P26 (control, n = 470 units, 6 mice; ES, n = 519 units, 5 mice), and P38–P40 (control, n = 327 units, 5 mice; ES, n = 341 units, 5 mice).
(C) Left: average power of single-unit autocorrelograms during acute ramp light stimulation for control and ES mice at different ages. Right: oscillation score of single units before (pre) and during (stim) acute ramp light stimulation (LMEM, oscillation score, P11–P12, pre p = 0.406, stim p = 0.156, P23–P26, pre p = 0.272, stim p = 0.478, P38–P40, pre p = 0.428, stim p = 0.030).
(D) Schematic of the protocol for early light stimulation and hippocampal ChR2 transfection.
(E) Representative image showing ChR2(ET/TC)-2A-RFP expression in L2/3 PYRs after IUE at E15.5 and ChR2(H134R)-eYFP expression after hippocampal injection at P22 in a DAPI-stained coronal slice, including the mPFC from a P40 mouse. Note the hippocampal axons in the mPFC, visible at high exposure and magnification. eYFP, enhanced yellow fluorescent protein.
(F) Representative wavelet spectra of extracellular recordings in the HP and mPFC at identical timescales during ramp light stimulation (473 nm, 3 s) in the HP of a P39 mouse.
(G) Left: modulation index of hippocampal LFP power in response to hippocampal ramp light stimulation at 473 nm (blue), averaged for P38–P40 control (13 recordings from 6 mice) and ES mice (n = 12 recordings from 5 mice). Right: average modulation index of hippocampal LFP power in the gamma frequency (40–80 Hz) upon hippocampal ramp stimulation at P38–P40 (LMEM, p = 0.846).
(H) Left: modulation index of prefrontal LFP power in response to hippocampal ramp light stimulation at 473 nm (blue), averaged for P38–P40 control (13 recordings from 6 mice) and ES mice (n = 12 recordings from 5 mice). Right: average modulation index of prefontal LFP power in the gamma frequency (40–80 Hz) upon hippocampal ramp stimulation at P38–P40 (LMEM, p = 0.0328).
In (A); (C); (G), left; and (H), left, data are presented as mean ± SEM. In (G), right, and (H), right, data are presented as median with 25th and 75th percentiles; the shaded area represents the probability distribution of the variable. Asterisks (∗p < 0.05, ∗∗p < 0.01, ∗∗∗p < 0.001) indicate significant differences. See also Figures S4 and S5 and Table S1 for detailed statistics.
The weaker prefrontal activation of fast oscillatory rhythms upon acute stimulation observed in young adult ES mice was replicated in a separate cohort of anesthetized head-fixed mice stimulated similarly from P7 to 11 (Figures S4A–S4C). Furthermore, young adult ES mice had weaker synchrony within and between hemispheres during evoked activity. Coherence between L2/3 and L5/6 of the stimulated hemisphere and coherence between L2/3 across hemispheres was reduced in ES mice at P38–P40 but was normal at a younger age (Figures S4D and S4E).
We analyzed single-unit firing to assess the response of prefrontal neurons to acute light stimulation in control and ES mice across development. Calculation of autocorrelation for prefrontal units showed that, independent of age and group, neurons fire rhythmically in response to acute light stimulation (Figure 5B). Similar to network oscillations, the strength and frequency of the rhythmicity of neuronal firing increased with age, but the magnitude of the increase was lower for ES mice, reaching significance at P38–P40 (Figure 5C). To assess the effect of ES on synchrony within the prefrontal network during development, we calculated pairwise correlations of single units. During ramp light stimulation, pairwise correlations were reduced significantly at the third quartile in young adult ES mice compared with controls but comparable between groups at P11–P12 and P23–P26 (Figure S5). These data show that the synchrony of the highest correlated units in the mPFC is reduced in young adult ES mice.
The second approach relies on mPFC activation through stimulation of one of its major excitatory drives, the intermediate and ventral HP (Ahlbeck et al., 2018). Mice manipulated by transient ES of prefrontal L2/3 PYRs from P7–P11 were injected with a virus encoding for ChR2(H134R) in the intermediate HP at P22 (Figures 5D and 5E). Hippocampal activity was similar in control and ES mice at P38–P40. Acute light stimulation (473 nm, 3 s) of the intermediate HP at P38–P40 induced oscillatory activity in the HP that boosted gamma activity in the mPFC of control but not ES mice (Figures 5F–5H). Thus, the mPFC of ES mice lacks the ability to synchronize its activity in gamma frequency in response to incoming inputs, such as from the HP.
These data show that a normal level of coordinated activity during early development is critical for normal behavior and mPFC function at adulthood, but the specificity of the chosen age window (P7–P11) for stimulation remains to be tested. To address this question, we performed transient ES of L2/3 PYRs at a later developmental stage: P12–P16 (oES). Similar to stimulation from P7–P11, transcranial stimulation at P12–P16 induced fast rhythmic activity at about 20 Hz, detectable in the local field potential power and in the autocorrelation power of single units (Figures 6A–6C and S6). Of note, early transient stimulation induced activation (21.4%) as well as inactivation (19.3%) of single units (Figure S6C), reflecting maturation of the inhibitory network. As reported for stimulation at P7–P11, oES did not affect task non-related spontaneous activity in the mPFC at P38–P40 (Figure 6D). Differences between the output of ES at P7–P11 versus P12–P16 were detected when analyzing adult mPFC activation upon light stimulation. In contrast to transient ES at P7–P11, oES only mildly affected the peak frequency, but not the peak strength, of light-induced fast oscillatory activity or multi-unit activity (MUA) at P38–P40 (Figures 6E and 6F). Thus, we suggest that the outcome of manipulation of early activity depends on the time window of manipulation and propose that time windows of particular sensitivity, such as P7–P11, are present during mPFC development.
Figure 6.

Transient ES at P12–P16 weakly affects activity in the adult mPFC
(A) Schematic of the protocol for early light stimulation at P12–P16.
(B) Representative extracellular recording with the corresponding wavelet spectrum at an identical timescale during transcranial ramp light stimulation (473 nm, 3 s) of L2/3 PYRs in the mPFC of a P16 mouse.
(C) Modulation index of LFP power in response to ramp light stimulation at 473 nm (blue) and 594 nm (yellow), averaged for P12–P16 mice (n = 8 mice).
(D) Top: average power spectra of spontaneous network activity in the mPFC of control and oES mice at P38–P40 (control, n = 11 recordings, 5 mice; oES n = 12 recordings, 6 mice). Bottom, scatterplot displaying peak strength and peak frequency of LFP power for control and oES mice. (LMEM, peak frequency p = 0.073, peak strength p = 0.250).
(E) Top: modulation index of LFP power in response to acute ramp light stimulation (473 nm, 3 s) for control and oES mice at P38–P40 (control, n = 11 recordings, 5 mice; oES, n = 12 recordings, 6 mice). Bottom: scatterplots displaying the peak strength and peak frequency of the power modulation index for control and oES mice (LMEM; peak frequency, p = 0.025; peak strength, p = 0.217).
(F) Top: MUA in response to acute ramp light stimulation (473 nm, 3 s) for control and oES mice at P38–P40 (control, n = 11 recordings, 5 mice; oES, n = 12 recordings, 6 mice). Bottom: MUA firing rate before (pre) and during (stim) acute ramp light stimulation for control and oES mice (LMEM; control pre versus stim, p = 0.018; control pre versus stim, p < 0.001; pre control versus oES, p = 0.364; stim control versus oES, p = 0.922).
In (C)–(F), top, data are presented as mean ± SEM. In (F), bottom, data are presented as median with 25th and 75th percentiles; the shaded area represents the probability distribution of the variable. Asterisks (∗p < 0.05, ∗∗p < 0.01, ∗∗∗p < 0.001) indicate significant differences. See also Figure S6 and Table S1 for detailed statistics.
These results show that transiently increased activity during a defined time window at neonatal age diminishes task/input-related gamma band synchronization in the adult mPFC.
A transient increase in neonatal activity alters the excitation/inhibition balance in the adult mPFC
Network synchronization in the gamma frequency results from interactions between excitatory and inhibitory units (Atallah and Scanziani, 2009; Chen et al., 2017). To elucidate the mechanisms of abnormal network synchronization upon stimulation in ES mice, we analyzed the response of individual units in L2/3 of the mPFC to acute ramp light stimulation. At P11–P12, 25.3% of units in control mice and 20.3% of units in ES mice significantly increased their firing rate during ramp light stimulation. Only few units (control, 0.9%; ES, 3.4%) decreased their firing rates. In older mice, units with significantly increased (P23–P26: control 31.2%, ES 32.7%; P38–P40: control 33.7%, ES 25.5%) and decreased (P23–P26: control 27.0%, ES 23.6%; P38–P40: control 24.5%, ES 30.6%) firing rates were detected (Figures 7A and 7B). The ratio of activated versus inactivated neurons per mouse was similar across groups at P11–P12 and P23–P26 but reduced significantly in ES mice at P38–P40 compared with controls.
Figure 7.

Transient ES alters the excitation/inhibition balance in the adult mPFC during acute light stimulation
(A) Single unit firing rates Z scored to pre-stimulation in response to acute ramp light stimulation (473 nm, 3 s) displayed for control (left) and ES mice (right) at P11–P12 (control, n = 455 units, 11 mice; ES, n = 556 units, 10 mice), P23–P26 (control, n = 1,332 units, 6 mice; ES, n = 1,371 units, 5 mice), and P38–P40 (control, n = 901 units, 5 mice; ES, n = 1,101 units, 5 mice).
(B) Line plots displaying average firing rates during acute light stimulation (top left), bar diagrams of the percentage of significantly activated and inactivated units (p < 0.01, bottom left), and violin plots showing the index of significantly activated versus inactivated units (right) for control and ES mice at P11–P12, P23–P26, and P38–P40 (P11–P12, LMEM, firing rate p < 0.001, Wilcoxon rank, activated/inactivated index p = 0.982, LMEM, P23–26, firing rate p = 0.004, activated/inactivated index p = 0.317, P38–P40, firing rate p < 0.001, activated/inactivated index p = 0.033).
(C) Schematic showing the protocol for in vitro whole-cell patch-clamp recordings from non-transfected L2/3 PYRs (black) during optogenetic stimulation of neighboring transfected cells (red) in the mPFC and representative examples.
(D) Violin plots displaying the EPSC/IPSC index during acute light stimulation (473 nm, square pulse, 1 s) for control and ES mice at P23–P26 (control, n = 35 neurons, 5 mice; ES, n = 30 neurons, 5 mice) and P37–P40 (control, n = 41 neurons, 6 mice; ES, n = 33 neurons, 4 mice) (LMEM; P23–P26, p = 0.840; P37–P40, p = 0.030).
In (B), left, data are presented as mean ± SEM. In (B), right, and (D), data are presented as median with 25th and 75th percentiles; the shaded area represents the probability distribution of the variable. Black lines and asterisks (∗p < 0.05, ∗∗p < 0.01, ∗∗∗p < 0.001) indicate significant differences. See also Figure S7 and Table S1 for detailed statistics.
Decreased gamma synchrony and reduced activation versus inactivation in P38–P40 ES mice suggest that the transient increase in prefrontal activity at neonatal age causes long-term alterations of the balance between excitation and inhibition in the prefrontal circuitry. To test this hypothesis, we performed whole-cell patch-clamp recordings from non-transfected prefrontal L2/3 PYRs in coronal slices from control and ES mice (Figure 7C). During acute light stimulation of ChR2(ET/TC)-transfected L2/3 PYRs (473 nm, square pulse, 1 s), the ratio of excitatory postsynaptic currents (EPSCs) to inhibitory postsynaptic currents (IPSCs) in non-transfected L2/3 PYRs was shifted toward inhibition for P37–P40 ES mice compared with controls (Figure 7D). In contrast, the ratio was similar between groups at P23–P26. Basic active and passive membrane properties as well as spontaneous inputs were not affected in ES mice (Figure S7).
Stronger inhibition might result from altered interneuron functionality after a transient activity increase during neonatal age (Wong et al., 2018). To test this hypothesis, we performed immunohistochemical staining for parvalbumin (PV) and somatostatin (SOM) and quantified the distribution of these two distinct subsets of inhibitory interneurons in the mPFC of control and ES mice during development (Figure 8A). The density of SOM-positive neurons was reduced slightly in ES mice at P11–P12 and P38–P40, whereas the density of PV-positive neurons was increased significantly at P38–P40 (Figure 8B). This increase could also reflect an activity-dependent upregulation of PV expression (Caballero et al., 2020). In-depth morphological analysis showed increased dendritic arborization of PV-positive neurons in the L2/3 of the mPFC of P38–P40 ES mice (Figures 8C–8E). Thus, transient ES alters the maturation of PV interneurons.
Figure 8.

Transient ES alters inhibitory feedback from FS units in the mPFC
(A) Representative images showing PV and SOM immunostaining in the mPFC of control and ES mice at P11–P12, P23–P25, and P38–P40.
(B) Violin plots displaying the density of PV-positive and SOM-positive neurons in L2/3 and L5/6 of the mPFC of control and ES mice at P11–P12 (control: PV n = 54 slices, 12 mice; SOM n = 59 slices, 12 mice; ES: PV n = 38 slices, 9 mice; SOM n = 43 slices, 9 mice), P23–P25 (control: PV n = 25 slices, 5 mice; SOM n = 25 slices, 5 mice; ES: PV n = 27 slices, 6 mice; SOM n = 25 slices, 6 mice), and P38–P40 (control: PV n = 36 slices, 9 mice; SOM n = 36 slices, 9 mice; ES: PV n = 40 slices, 10 mice; SOM n = 43 slices, 11 mice) (LMEM, L2/3, P11–P12, PV p = 0.296, SOM p = 0.044, P23–P25, PV p = 0.403, SOM p = 0.390, P38–P40, PV p = 0.012, SOM p = 0.012).
(C) Average heatmaps of PV interneurons in the mPFC of P38–P40 control (left) and ES mice (right).
(D) Line plots of dendritic intersections of PV interneurons with concentric circles (0–150 μm radius) centered around the soma averaged for control (23 cells of 3 mice) and ES mice (28 cells of 3 mice) at P38–P40 (LMEM p < 0.001).
(E) Violin plots displaying the dendritic length and soma area of PV interneurons for control (23 cells of 3 mice) and ES mice (28 cells of 3 mice) at P38–P40 (LMEM; dendritic length, p = 0.016).
(F) Scatterplots displaying half-width and trough-to-peak duration (top left) and average waveforms for RS and FS units (bottom) as well as violin plots displaying average firing rates (right) for control and ES mice at P38–P40 (control, 814 RS and 84 FS units, 5 mice; ES, 992 RS and 104 FS units, 5 mice) (Wilcoxon rank, P38–P40, RS firing rate p = 0.040, FS firing rate p = 0.575).
(G) Average firing rate during acute ramp light stimulation (473 nm, 3 s) for control and ES mice at P38–P40. (LMEM, P38–P40, RS firing rate p < 0.001, FS firing rate p < 0.001).
(H) Average firing rate during acute pulse light stimulation (473 nm, 3 ms) for control and ES mice at P38–P40. (LMEM, P38–P40, RS firing rate p < 0.001, FS firing rate p < 0.001).
(I) Representative image of a P37 mouse showing L2/3 PYRs ChR2(ET/TC)-2A-RFP expression from IUE and BiPOLES-mCerulean expression in PV interneurons after viral injection at P16 into the mPFC.
(J) Schematic showing the protocol for in vitro whole-cell patch-clamp recordings from non-transfected L2/3 PYRs (black) during optogenetic stimulation of neighboring transfected PYRs (red) and/or PV interneurons (green) in the mPFC.
(K) Violin plot displaying IPSC amplitude in response to acute light stimulation of PV interneurons (595 nm, square pulse, 10 ms) for control and ES mice at P37–P40 (control, n = 32 neurons, 6 mice; ES, n = 31 neurons, 5 mice) (LMEM, p = 0.056).
(L) Violin plot displaying the EPSC/IPSC index during acute light stimulation of L2/3 PYRs and inhibition of PV interneurons (473 nm, square pulse, 1 s) for control and ES mice at P37–P40 (control, n = 35 neurons, 6 mice; ES: n = 30 neurons, 5 mice) (LMEM, p = 0.785).
In (B), (E), (F), (K), and (L), data are presented as median with 25th and 75th percentiles; the shaded area represents the probability distribution of the variable. In (D), (G), and (H), data are presented as mean ± SEM. Black lines and asterisks (∗p < 0.05, ∗∗p < 0.01, ∗∗∗p < 0.001) indicate significant differences. See also Figure S8 and Table S1 for detailed statistics.
Fast-spiking (FS) PV-expressing interneurons that mature toward the end of the developmental period are critical for generation of adult cortical gamma activity (Cardin et al., 2009; Chen et al., 2017; Gour et al., 2021). Therefore, the late-emerging decrease in gamma synchrony in adult ES mice may result from altered maturation of these neurons. To test this hypothesis, we distinguished regular-spiking (RS) and FS units in extracellular recordings from control and ES mice based on their spike waveform (Figures 8F and S8A). Moreover, we photo-tagged PV-expressing interneurons in the mPFC of PV-cre mice after viral transfection with cre-dependent ChR2(ET/TC) to confirm that FS units at P23–P26 and P38–P40 correspond to PV interneurons. We found that 84.9% of photo-tagged PV neurons fit our criteria for FS units (Figure S8E). The spontaneous firing rate of RS units is altered in ES mice at P23–P26 and P38–P40 compared with controls, whereas no changes were detected for FS units (Figures 8F and S8B). In contrast, evoked activity during acute ramp light stimulation was reduced for RS and FS units in ES mice at P38–P40 but normal earlier during development (Figures 8G and S8C). Reduced evoked activity of FS units seems to be in opposition with the increased numbers of PV-positive neurons in adult ES mice. However, the FS firing rate is mainly reduced during the late phase of the ramp, whereas the initial peak is not altered. Taking into account that PV neurons inhibit PYRs but also other PV neurons (Pfeffer et al., 2013), we hypothesized that FS putative PV neurons might provide more potent inhibition and thereby reduce RS and FS firing rates after initial activation in ES mice.
Gamma synchronization in the adult cortex results from a temporally coordinated excitatory drive and inhibitory feedback (Atallah and Scanziani, 2009; Cardin et al., 2009). To investigate the timing of RS and FS firing, we performed acute stimulation with short light pulses of 3-ms duration. RS and FS units showed a pronounced peak in their firing rate for 5–10 ms in response to short light pulses (Figures 8H and S8D). The similar peak latency of RS and FS units indicates that the RS clusters contain a substantial number of non-transfected, indirectly activated units, in agreement with the sparse transfection achieved with IUE. FS units in control mice showed a second peak in their firing rate about 20 ms after the light pulse in P23–P26 and P37–P40 mice. The delay of 20 ms suggests a contribution of these units to gamma oscillations, which have a typical cycle duration of 20 ms at 50 Hz. This second peak was reduced significantly in ES mice at P23–P26 and P38–P40. Of note, similar to ramp-induced activity, the first peak was not affected in FS units, suggesting that FS units provide stronger inhibition after initial activation in ES mice.
To test this hypothesis, we performed transient ES of prefrontal L2/3 PYRs from P7–P11 in PV-cre mice, followed by viral transfection with a cre-dependent, bidirectional, dual-color optogenetic tool, BiPOLES (bidirectional pair of opsins for light-induced excitation and silencing) (Vierock et al., 2020), into the mPFC at P16 (Figure 8I). Red light (585 nm) activated PV neurons, whereas blue light (473 nm) activated L2/3 PYRs and inactivated PV neurons in the same mouse (Figure 8J). We performed whole-cell patch-clamp recordings from non-transfected prefrontal L2/3 PYRs in coronal slices, including the mPFC, of control and ES mice at P37–P40. Brief stimulation of PV interneurons (10-ms pulses, 585 nm) induced IPSCs in the recorded L2/3 PYRs of control and ES mice. The IPSCs had a slightly larger but not significant (p = 0.056) amplitude in ES mice, suggesting increased inhibition in ES compared with control mice (Figure 8K). Simultaneous activation of L2/3 PYRs and inhibition of PV neurons (1 s, 473 nm) removed the EPSC/IPSC imbalance in ES mice (compare Figure 8L with Figure 7D).
Thus, transiently increased activity at neonatal age alters the development of inhibitory feedback from FS interneurons and reduces evoked gamma synchronization of adult prefrontal circuits.
Discussion
Seminal research identified electrical activity as a major contributor to development of the mammalian cerebral cortex. Early activity influences neuronal migration, differentiation, and apoptosis (Blanquie et al., 2017; Katz and Shatz, 1996; Kirkby et al., 2013) as well as establishment of synaptic connections (Clause et al., 2014; Huberman et al., 2006). In clinical settings, patterns of electroencephalographic activity of preterm infants provide prognostic value for neurodevelopmental outcome (Iyer et al., 2015). Several neuropsychiatric diseases have been proposed to be related to alterations in neuronal activity early in life (Marín, 2016; Robertson and Baron-Cohen, 2017). However, fundamental questions still need to be addressed. How does electrical activity during early development affect adult cortical function? Does altered prefrontal activity during early development contribute to cognitive deficits later in life? Here we address these questions and demonstrate that a transient increase in activity in the mouse mPFC during a short period of neonatal development critical for network formation causes long-lasting changes in inhibitory feedback and excitation/inhibition balance, leading to weaker evoked gamma band synchronization and, ultimately, poorer cognitive abilities.
To manipulate developmental activity, we optogenetically stimulated the mPFC, inducing discontinuous activity patterns with similar dynamics as ones occurring spontaneously. During early development, the mammalian cortex shows discontinuous activity, with neuronal discharges organized in oscillatory rhythms alternating with electrically silent periods (Hanganu et al., 2006; Khazipov et al., 2004). In the mPFC of neonatal mice, these 1- to 3 s-long oscillatory events with frequencies alternating between theta (4–12 Hz) and beta-low gamma (12–40 Hz) occur every 20–30 s (Bitzenhofer et al., 2015; Brockmann et al., 2011). The fast oscillations emerge as a result of L2/3 PYRs activation (Bitzenhofer et al., 2017a). Therefore, we used repeated ramp light stimulation (3 s duration, 6/min for 30 min per day) to activate L2/3 PYRs transfected with ChR2(ET/TC) by IUE and induced fast oscillatory discharges. At the age of transient ES (P7–P11), neurons have reached their final location in the cortical layers and are in the process of establishing synaptic connections (Van Eden and Uylings, 1985). Our stimulation protocol was designed to cause a modest increase in activity in the mPFC during this period critical for network formation. This type of stimulation not only augments the level of activity but coordinates the prefrontal networks in fast oscillatory rhythms evolving from beta to gamma frequencies with age (Bitzenhofer et al., 2020).
How does the transient increase in neuronal activity at neonatal age influence prefrontal development and, ultimately, behavior? The present data demonstrate that early manipulation triggers a cascade of structural and functional changes in the mPFC, leading to impairment of cognitive and social abilities. On the morphological level, increased neonatal activity induced premature growth of dendrites and spines in stimulated L2/3 PYRs. This is consistent with the activity-dependent growth of dendrites (Wayman et al., 2006) and reminiscent of the growth dynamics (i.e., initially excessive followed by arrested growth) during development in humans with autism spectrum disorders (Courchesne, 2004). Activity of PYRs from P5–P8 has been shown to regulate the survival of cortical interneurons (Denaxa et al., 2018; Wong et al., 2018). Accordingly, we found an increased number of PV-expressing interneurons in ES mice. In contrast to previous studies (Denaxa et al., 2018; Lim et al., 2018; Wong et al., 2018), this effect was specific for PV-expressing neurons, whereas the number of SOM-expressing neurons was reduced. Several differences in experimental settings might explain this disparity. (1) Stimulation a few days later during developmental (P7–P11 versus P5–P8) is expected to have a stronger effect on late-maturing, PV-expressing interneurons (Lim et al., 2018). (2) Increased activity of a subset of PYRs (20%–30% of L2/3 PYRs versus all PYRs) might cause different activation of interneuron subtypes. (3) Optogenetic (versus chemogenetic) stimulation triggering fast oscillatory network activity might specifically engage PV-expressing interneurons.
Premature growth of dendrites and spines likely affects the connectivity of stimulated neurons. Together with altered interneuron numbers, these structural changes might have contributed to the shift in the excitation/inhibition balance in the mPFC of ES mice toward inhibition. In addition to the general increase in inhibition, the timing of FS, presumably PV-expressing interneurons was altered. In juvenile and adult control mice, brief activation of L2/3 PYRs induced a sharp peak in the firing rate of FS interneurons, followed by a second peak about 20 ms later. This second peak, supposedly critical for synchronization in the gamma frequency, was absent in ES mice. Accordingly, the transient increase of neuronal activity at neonatal age (but not later) led to impaired synchronization of the prefrontal network in the gamma frequency in young adults. This is consistent with the importance of PV-expressing FS interneurons for generation of cortical gamma activity (Atallah and Scanziani, 2009; Cardin et al., 2009). Late maturation of PV-expressing interneurons (Lim et al., 2018) and gamma activity in the mPFC (Bitzenhofer et al., 2020) most likely underlie the delayed onset of these physiological effects. These effects were only evident during evoked or task-related activity, whereas spontaneous activity in the mPFC was largely normal, reflecting the moderate effects of the stimulation protocol. This is consistent with alterations in evoked activity related to early emergence of sensory symptoms in humans with autism spectrum disorders (Robertson and Baron-Cohen, 2017).
Abnormal FS interneuron development impairs prefrontal gamma activity and cognitive flexibility in adults (Cho et al., 2015). Accordingly, a transient increase of neuronal activity at neonatal age ultimately resulted in impaired cognitive abilities in juvenile and young adult mice. Gamma activity in prefrontal L2/3 is particularly important for maintenance of information during working memory tasks (Bastos et al., 2018). This is consistent with the specific impairment of ES mice in short-term memory and working memory tasks as well as reduced social preference.
These data demonstrate that altered neuronal activity during early development induces structural and functional changes in the mPFC, ultimately resulting in impaired cognitive abilities. Even though cognitive symptoms are not the core deficits, they are a devastating burden in several neuropsychiatric diseases (Baron-Cohen, 2004; van Os and Kapur, 2009; Stuchlik and Sumiyoshi, 2014). An altered cortical excitation/inhibition balance and impaired gamma activity are critical for cognitive dysfunctions (Gallinat et al., 2004; Sohal and Rubenstein, 2019; Uhlhaas and Singer, 2010). Early prefrontal activity is reduced in mouse models of schizophrenia (Chini et al., 2020; Hartung et al., 2016a) and increased in mouse models of autism (Peixoto et al., 2016; Richter et al., 2019), but both show similar cognitive deficits, supporting the relevance of a balanced level of early activity. Thus, altered developmental activity of cortical circuits might actively contribute to cognitive symptoms in neuropsychiatric diseases (Chini and Hanganu-Opatz, 2020).
STAR★Methods
Key resources table
| REAGENT or RESOURCE | SOURCE | IDENTIFIER |
|---|---|---|
| Antibodies | ||
| Alexa Fluor-488 goat anti-rabbit IgG secondaryantibody | Merck Millipore | Cat# A-11008; RRID: AB_143165 |
| Rabbit polyclonal primary antibody against CamKII | Thermo Fisher Scientific | Cat# PA5-29648; RRID:AB_2547123 |
| Rabbit monoclonal primary antibody against parvalbumin | Swant | Cat# 235; RRID:AB_10000343 |
| Rabbit polyclonal primary antibody against somatostatin | Santa Cruz | Cat# sc-13099; RRID:AB_2195930 |
| Deposited data | ||
| Extracellular recording data and sorted single unit data | This paper | https://gin.g-node.org/Jastyn/Early_activity_is_critical_for_prefrontal_development |
| Chemicals, peptides, and recombinant proteins | ||
| Urethane | Sigma-Aldrich | U2500 |
| Isoflurane | Abbott | B506 |
| Ketamine | Richter Pharma AG | Ketamidor |
| Xylazine | Bayer | Rompun |
| Experimental models: organisms/strains | ||
| Mouse: C57BL/6J | Universitätsklinikum Hamburg-Eppendorf – Animal facility | Mouse: C57BL/6J |
| Mouse: PV-Cre knock-in (B6.129P2-Pvalbtm1(cre)Arbr/J) | Jackson Laboratory | Jax-mice: #008069 |
| Recombinant DNA | ||
| pAAV-CAG-ChR2(E123T/T159C)-2AtDimer2 | Berndt et al., 2011 | https://www.addgene.org/85399/ |
| AAV9-Ef1alpha-DIO-hChR2(ET/TC)-eYFP | Mattis et al. 2011 | https://www.addgene.org/35507/ |
| AAV9-hSyn-DIO-SomBiPOLES-mCerulean | Vierock et al., 2020 | Donated by Simon Wiegert |
| pAAV-CaMKIIa-hChR2(H134R)-eYFP | Lee et al., 2010 | https://www.addgene.org/26969/ |
| Software and algorithms | ||
| MATLAB R2016a | MathWorks | https://www.mathworks.com |
| MATLAB R2019a | MathWorks | https://www.mathworks.com |
| ImageJ 2.0.0 | ImageJ | https://imagej.nih.gov/ij/ |
| R Statistical Software 3.5.1 | RStudio | http://www.rstudio.com/ |
| Cheetah 6 | Neuralynx | https://neuralynx.com/ |
| Anaconda 1.9.6 | Anaconda | https://www.anaconda.com |
| Jupyter 6.0.0 | Jupyter | https://jupyter.org/ |
| Video Mot2 | TSE Systems | https://www.tse-systems.com/product-details/videomot |
| uEye Cockpit | iDS Imaging | https://en.ids-imaging.com/ids-software-suite.html |
| Phy | https://github.com/cortex-lab | https://github.com/cortex-lab/phy |
| OASIS toolbox | https://github.com/zhoupc | https://github.com/zhoupc/OASIS_matlab |
| Other | ||
| Arduino Uno SMD | Arduino | A000073 |
| Digital Lynx 4SX | Neuralynx | https://neuralynx.com/ |
| Diode laser (473 nm) | Omicron | LuxX® 473-100 |
| Diode laser (594 nm) | Omicron | SOLE® 594-100 |
| Electroporation device | BEX | CUY21EX |
| Electroporation tweezer-type paddles | Protech | CUY650-P5 |
| Recording optrode (1 shank, 16 channels) | Neuronexus | A1x16-5mm-100-703-OA16LP |
| Recording optrode (1 shank, 16 channels) | Neuronexus | A1x16-5mm-50-703-OA16LP |
| Recording optrode (4 shanks, 16 channels) | Neuronexus | A4x4-3mm-100-125-703-OA16LP |
| Confocal microscope | Zeiss | LSM 700 |
| Confocal microscope | Leica | DM IRBE |
| Mobile HomeCage® | Neurotar | Mobile HomeCage Large® with tracking capability |
| Floating foam maze | Neurotar | Assembled foam sociability cage |
| Lightweight stainless-steel head plates | Neurotar | Model 3, round 6,2 mm opening |
| Headpost stand | Luigs & Neumann | 200-200 500 1100 |
| Head post - S (for mice) | Luigs & Neumann | 200-100 500 2203 |
Resource availability
Lead contact
Further information and requests for resources and reagents should be directed to and will be fulfilled by the Lead Contact, Ileana L. Hanganu-Opatz (hangop@zmnh.uni-hamburg.de).
Materials availability
The study did not generate new unique reagents.
Data and code availability
LFP and SUA data for all recordings are available at the following open-access repository: https://gin.g-node.org/Jastyn/Early_activity_is_critical_for_prefrontal_development. Further data and code supporting the findings of this study are available from the corresponding authors on request.
Experimental model and subject details
All experiments were performed in compliance with the German laws and the guidelines of the European Community for the use of animals in research and were approved by the local ethical committee (G132/12, G17/015, N18/015). Experiments were carried out on C57BL/6J and PV-cre (B6.129P2-Pvalbtm1(cre)Arbr/J, #008069) mice of both sexes. Timed-pregnant mice from the animal facility of the University Medical Center Hamburg-Eppendorf were housed individually at a 12 h light/12 h dark cycle and were given access to water and food ad libitum. The day of vaginal plug detection was considered E0.5, the day of birth was considered P0.
Method details
In utero electroporation
Pregnant mice received additional wet food daily, supplemented with 2-4 drops Metacam (0.5 mg/ml, Boehringer-Ingelheim, Germany) one day before until two days after IUE. At E15.5, pregnant mice were injected subcutaneously with buprenorphine (0.05 mg/kg body weight) 30 min before surgery. Surgery was performed under isoflurane anesthesia (induction 5%, maintenance 3.5%) on a heating blanket. Eyes were covered with eye ointment and pain reflexes and breathing were monitored to assess anesthesia depth. Uterine horns were exposed and moistened with warm sterile phosphate-buffered saline (PBS). 0.75-1.25 μl of opsin- and fluorophore-encoding plasmid (pAAV-CAG-ChR2(E123T/T159C)-2A-tDimer2 (RFP), 1.25 μg/μl) purified with NucleoBond (Macherey-Nagel, Germany) in sterile PBS with 0.1% fast green dye was injected in the right lateral ventricle of each embryo using pulled borosilicate glass capillaries. Electroporation tweezer paddles of 5 mm diameter were oriented at a rough 20° leftward angle from the midline of the head and a rough 10° downward angle from the anterior to posterior axis to transfect precursor cells of medial prefrontal L2/3 PYRs with 5 electroporation pulses (35 V, 50 ms, 950 ms interval, CU21EX, BEX, Japan). Uterine horns were placed back into the abdominal cavity that was filled with warm sterile PBS. Abdominal muscles and skin were sutured with absorbable and non-absorbable suture thread, respectively. After recovery from anesthesia, mice were returned to their home cage, placed half on a heating blanket for two days after surgery. Fluorophore expression in pups was detected at P2 with a portable fluorescence flashlight (Nightsea, MA, USA) through the intact skin and skull and confirmed in brain slices postmortem.
Transient early stimulation
A stimulation window was made at P7 for chronic transcranial optogenetic stimulation in mice transfected by in utero electroporation. Mice were placed on a heating blanket and anesthetized with isoflurane (5% induction, 2% maintenance). Breathing and pain reflexes were monitored to assess anesthesia depth. The skin above the skull was cut along the midline at the level of the mPFC and gently spread with forceps. The exposed skull was covered with transparent tissue adhesive (Surgibond, SMI, Belgium). Mice were returned to the dam in the home cage after recovery from anesthesia. From P7-11 mice were stimulated daily under isoflurane anesthesia (5% induction, 2% maintenance) with ramp stimulations of linearly increasing light power (473 nm wavelength, 3 s duration, 7 s interval, 180 repetitions, 30 min total duration). Light stimulation was performed using an Arduino uno (Arduino, Italy) controlled laser system (Omicron, Austria) coupled to a 200 μm diameter light fiber (Thorlabs, NJ, USA) positioned directly above the tissue adhesive window. Light power attenuation was set to 30 mW to reach 10 mW in the brain, adjusted for measured light attenuation by the tissue adhesive (∼30%) and the thin skull at young age (∼25%). Control animals were treated identical but stimulated with light of 594 nm wavelength that does not activate the expressed opsin ChR2(ET/TC). The same protocol was used for transient early stimulation at P12-16. At this age, the skull was etched and thinned before covering with transparent tissue adhesive.
Virus injections
Prefrontal cortex
At P12, virus encoding cre-dependent AAV9-Ef1alpha-DIO-hChR2(ET/TC)-eYFP was injected into the mPFC (0.5 mm anterior to bregma, 0.1-0.5 mm lateral to the midline, 1.6 mm deep) of PV-cre mice for opto-tagging experiments. At P16, virus encoding cre-dependent AAV9-hSyn-DIO-SomBiPOLES-mCerulean was injected into the mPFC (0.5 mm anterior to bregma, 0.1-0.5 mm lateral to the midline, 1.6 mm deep) of PV-cre mice for in vitro experiments.
Hippocampus
At P22, virus encoding pAAV-CaMKIIa-hChR2(H134R)-eYFP was injected into the intermediate HP (0.7 mm anterior to lambda, 2.3 mm lateral to the midline, 1.5 mm deep) of C57BL/6J mice for light stimulation.
Electrophysiology and optogenetics in vivo
Acute extracellular recordings
Multi-site extracellular recordings were performed unilaterally or bilaterally in the mPFC of non-anesthetized and anesthetized P7-40 mice. Under isoflurane anesthesia (induction: 5%; maintenance: 2.5%), a craniotomy was performed above the mPFC (0.5 mm anterior to bregma, 0.1-0.5 mm lateral to the midline). Mice were head-fixed into a stereotaxic apparatus using two plastic bars mounted on the nasal and occipital bones with dental cement. Multi-site electrodes (NeuroNexus, MI, USA) were inserted into the mPFC (four-shank, A4x4 recording sites, 100 μm spacing, 125 μm shank distance, 1.8-2.0 mm deep). A silver wire was inserted into the cerebellum and served as ground and reference. Pups were allowed to recover for 30 min prior to recordings. For recordings in anesthetized mice, urethane (1 mg/g body weight) was injected intraperitoneally prior to the surgery. Extracellular signals were band-pass filtered (0.1-9,000 Hz) and digitized (32 kHz) with a multichannel extracellular amplifier (Digital Lynx SX; Neuralynx, Bozeman, MO, USA). Electrode position was confirmed in brain slices postmortem.
Chronic extracellular recordings
Multi-site extracellular recordings were performed in the mPFC of P23-26 and P38-40 mice. Under isoflurane anesthesia (5% induction, 2.5% maintenance), a metal head-post for head fixation (Luigs and Neumann, Germany) was implanted at least 5 days before recordings. Above the mPFC (0.5-2.0 mm anterior to bregma, 0.1-0.5 mm right to the midline) and the intermediate HP (3.5 mm posterior to bregma, 3.5 mm lateral to the midline) a craniotomy was performed and protected by a customized synthetic window. A silver wire was implanted between skull and brain tissue above the cerebellum and served as ground and reference. 0.5% bupivacaine / 1% lidocaine was locally applied to cutting edges. After recovery from anesthesia, mice were returned to their home cage. Mice were allowed to recover from the surgery, accustomed to head-fixation and trained to run on a custom-made spinning disc. For recordings, craniotomies were uncovered and a multi-site electrode (NeuroNexus, MI, USA) was inserted into the mPFC (one-shank, A1x16 recording sites, 100 μm spacing, 2.0 mm deep) and, in some experiments, into the intermediate HP (one-shank, A1x16 recording sites, 50 μm spacing, 1.6 mm deep). Extracellular signals were band-pass filtered (0.1-9000 Hz) and digitized (32 kHz) with a multichannel extracellular amplifier (Digital Lynx SX; Neuralynx, Bozeman, MO, USA). Electrode position was confirmed in brain slices postmortem.
Acute light stimulation
Ramp (i.e., linearly increasing light power) light stimulation and 3 ms light pulses were performed using an Arduino uno (Arduino, Italy) controlled laser system (473 nm / 594 nm wavelength, Omicron, Austria) coupled to a 50 μm (4 shank electrodes) or 105 μm (1 shank electrodes) diameter light fiber (Thorlabs, NJ, USA) glued to the multisite electrodes, ending 200 μm above the top recording site. Acute ramp stimulations were repeated 30 times and acute pulse stimulations 360 times.
Photo-tagging
ChR2(ET/TC) expressing PV interneurons were stimulated with 3 ms light pulses at 473 nm wavelength. Firing rate increase at 2-6 ms after stimulation onset was compared to pre-stimulus firing rate for 720 single pulses to detect significantly activated units (p < 0.001 and MI > 0.2).
Electrophysiology and optogenetics in vitro
Patch-clamp recordings
Whole-cell patch-clamp recordings were performed from tDimer-negative L2/3 PYRs in the mPFC of P23-26 and P37-40 mice. Under anesthesia, mice were decapitated, brains were removed and sectioned coronally at 300 mm in ice-cold oxygenated high sucrose-based artificial cerebral spinal fluid (ACSF) (in mM: 228 sucrose, 2.5 KCl, 1 NaH2PO4, 26.2 NaHCO3, 11 glucose, 7 MgSO4; 310 mOsm). Slices were incubated in oxygenated ACSF (in mM: 119 NaCl, 2.5 KCl, 1 NaH2PO4, 26.2 NaHCO3, 11 glucose, 1.3 MgSO4; 310 mOsm) at 37°C for 45 min before cooling to room temperature. Slices were superfused with oxygenated ACSF in the recording chamber. Neurons were patched under optical control using pulled borosilicate glass capillaries (tip resistance of 3-7 MΩ) filled with pipette solution (in mM: 130 D-glucononic acid 49%–53%, 130 Cesium-OH 50%, 10 HEPES, 0.5 EGTA, 4 Mg-ATP, 0.3 Na2-GTP, 8 NaCl, 5 QX-314-Cl; 285 mOsm, pH 7.3). Data was acquired using PatchMaster (HEKA Elektronik, MA, USA). Capacitance artifacts and series resistance were minimized using the built-in circuitry of the patch-clamp amplifier (EPC 10; HEKA Elektronik, MA, USA). Responses of neurons were digitized at 10 kHz in voltage-clamp mode.
Light stimulation
Square light stimuli of 473 nm or 585 nm wavelength and 10 ms or 1 s duration were delivered with the pE-2 LED system (CoolLED, Andover, UK). Experiments were performed blind to the group identity (transient early stimulation at 473 nm or 585 nm) of mice.
Histology
P7-40 mice were anesthetized with 10% ketamine (aniMedica, Germanry) / 2% xylazine (WDT, Germany) in 0.9% NaCl (10 μg/g body weight, intraperitoneal) and transcardially perfused with 4% paraformaldehyde (Histofix, Carl Roth, Germany). Brains were removed and postfixed in 4% paraformaldehyde for 24 h. Brains were sectioned coronally with a vibratome at 50 μm for immunohistochemistry or 100 μm for examination of dendritic complexity and electrode reconstruction.
Immunohistochemistry
Free-floating slices were permeabilized and blocked with PBS containing 0.8% Triton X-100 (Sigma-Aldrich, MO, USA), 5% normal bovine serum (Jackson Immuno Research, PA, USA) and 0.05% sodium azide. Slices were incubated over night with primary antibody rabbit-anti-Ca2+/calmodulin-dependent protein kinase II (1:200, #PA5-38239, Thermo Fisher, MA, USA; 1:500, #ab52476, Abcam, UK), rabbit-anti-parvalbumin (1:500, #ab11427, Abcam, UK) or rabbit-anti-somatostatin (1:250, #sc13099, Santa Cruz, CA, USA), followed by 2 h incubation with secondary antibody goat-anti-rabbit Alexa Fluor 488 (1:500, #A11008, Invitrogen-Thermo Fisher, MA, USA). Sections were transferred to glass slides and covered with Fluoromount (Sigma-Aldrich, MO, USA).
Cell quantification
Images of immunostainings and IUE-induced tDimer2 expression in the right mPFC were acquired on a confocal microscope (DM IRBE, Leica, Germany) using a 10x objective (numerical aperture 0.3). tDimer2-positive and immunopositive cells were automatically quantified with custom-written algorithms in ImageJ environment. The region of interest (ROI) was manually defined over L2/3 of the mPFC. Image contrast was enhanced before applying a median filter. Local background was subtracted to reduce background noise and images were binarized and segmented using the watershed function. Counting was done after detecting the neurons with the extended maxima function of the MorphoLibJ plugin. Experiments were performed blind to the group identity (transient early stimulation at 473 nm or 585 nm) of mice.
Dendritic complexity and spine quantification
Image stacks of tDimer2-positive PYRs or immune-positive PV neurons were acquired on a confocal microscope (LSN700, Zeiss, Germany) using a 40x objective. Stacks of 6 neurons per animal were acquired as 2048x2048 pixel images (voxel size 156∗156∗500 nm). Dendritic complexity was quantified by Sholl analysis in ImageJ environment. Images were binarized using auto threshold function and the dendrites were traced using the semi-automatic simple neurite tracer plugin. The geometric center was identified, and the traced dendritic tree was analyzed with the Sholl analysis plugin. Analysis was performed blind to the group identity (transient early stimulation at 473 nm or 585 nm) of mice. For spine quantification, spines on dendrite of interest (apical, basal, proximal oblique or secondary apical) were measured (line tool) and manually counted using the point picker tool in ImageJ environment.
Behavior
Mice were handled and adapted to the investigation room two days prior to behavioral examination. Arenas and objects were cleaned with 0.1% acetic acid before each trial. Animals were tracked online using video Mot2 software (Video Mot2, TSE Systems GmbH, Germany) or offline using the python-based tracking system ezTrack (Pennington et al., 2019).
Developmental milestones
Somatic and reflex development was examined every third day in P2-20 mice. Weight, body length, and tail length were measured. Grasping reflex was assessed by touching front paws with a toothpick. Vibrissa placing was measured as head movement in response to gently touching the vibrissa with a toothpick. Auditory startle was assessed in response to finger snapping. The days of pinnae detachment and eye opening were monitored. Surface righting was measured as time to turn around after being positioned on the back (max 30 s). Cliff avoidance was measured as time until withdrawing after being positioned with forepaws and snout over an elevated edge (max 30 s). Bar holding was measured as time hanging on a toothpick grasped with the forepaws (max 10 s).
Open field
At P16, Mice were positioned in the center of a circular arena (34 cm in diameter) and allowed to explore for 10 min. Behavior was quantified as discrimination index of time spent in the center and the border of the arena ((time in surround - time in center) / (time in surround + time in center)), grooming time, average velocity and number of rearing, wall rearing and jumping.
Object recognition
Novel object recognition (NOR, P17), object location recognition (OLR, P18) and recency recognition (RR, P21) were performed in the same arena as the open field examination. Mouse center, tail and snout position were tracked automatically. Object interaction was defined as the snout being within < 1 cm distance from an object. For NOR, each mouse explored two identical objects for 10 min during the sample phase. After a delay period of 5 min in a break box, the mouse was placed back in the arena for the test phase, where one of the objects was replaced by a novel object. Behavior was quantified as discrimination index of time spent interacting with the novel and familiar object ((time novel object - time familiar object) / (time novel object + time familiar object)). OLR was performed similarly, but one object was relocated for the test phase instead of being exchanged. For RR, each mouse explored two identical objects during the first sample phase for 10 min, followed by a delay phase of 30 min, and a second sample phase of 10 min with two novel identical objects. After a second break of 5 min, the interaction time with an object of the first sample phase (old) and an object from the second sample phase (recent) was assessed during the test phase for 2 min. Behavior was quantified as discrimination index of time spent interacting with the novel and familiar object ((time old object – time recent object) / (time old object + time recent object)).
Maternal interaction
Maternal interaction was performed at P21 in the same arena as the open field examination. Two plastic containers were added to the arena, one empty and one containing the dam of the investigated mouse. Small holes in the containers allowed the mouse and the dam to interact. Behavior was quantified as discrimination index of time spent interacting with the empty container and the container containing the dam ((time dam container – time empty container) / (time dam container + time empty container)).
Spatial working memory
At P36-38, mice were positioned in the center of an elevated 8-arm radial maze. 4 arms contained a food pellet at the distal end (baited). On the first day, mice were allowed to examine the maze for 20 min or until all arms were visited. During the following 10 trials (2 trials on day 1 and 4 trials on day 2 and 3), mice were allowed to examine the maze until all baited arms were visited (for max 20 min) and arm entries were assessed. Visit of a non-baited arm was considered as reference memory error, repeated visit of the same arm in one trial as working memory error.
Spontaneous alteration
At P39, each mouse was positioned in the start arm of an elevated Y-maze. Visited arms during free exploration were monitored for 10 min. Percentage of alternations was calculated as (number of alternations / (entries - 2)). The test was used as habituation for delayed non-match-to-sample task.
Delayed non-match-to-sample task
At P39-40, mice were positioned in the start arm of an elevated Y-maze with access to the other arms containing a food pellet. After entering one arm, a central door was closed (sample choice). After the food pellet was consumed the mice were placed in the start arm for a second run (test choice) after a 30 s break. Each mouse performed 6 trials / day. Test choice was considered correct when visiting the arm not explored during sample phase.
Social preference
At P38-40, chronically implanted and trained mice were head fixed in the Mobile Home Cage system (Neurotar, Finland) for electrophysiological recordings during a social preference task. Two chambers attached to opposite sides of the mobile home cage contained a familiar or novel mouse and an object. Animals were free to move the mobile home cage for 20 min. After attaching a novel or familiar mouse and an object to the opposite sites of the home cage the recording was continued for 15 min and the position was monitored. Since no differences were found for interactions with a novel or a familiar mouse, the data were pooled. For power spectral density analysis, the first 6 s after interaction onset (mouse or object) of first 15 min of interaction were concatenated, and the power was calculated using Welch’s method with non-overlapping windows. Spectra were multiplied with squared frequency.
Quantification and statistical analysis
Data from in vivo and in vitro recordings were analyzed with custom-written algorithms in MATLAB environment. In vivo data were band-pass filtered (500-9000 Hz for spike analysis or 1-100 Hz for LFP) using a third-order Butterworth filter forward and backward to preserve phase information before down-sampling to analyze LFP. For in vitro data, all potentials were corrected for liquid junction potentials (−10 mV). The resting membrane potential was measured immediately after obtaining the whole-cell configuration. To assess input resistance and membrane properties, 600 ms long hyperpolarizing current pulses were applied.
Power spectral density
For power spectral density analysis 2-6 s-long windows of LFP signal were concatenated and the power was calculated using Welch’s method with non-overlapping windows. Spectra were multiplied with squared frequency.
Imaginary coherence
The imaginary part of complex coherence, which is insensitive to volume conduction, was calculated by taking the absolute value of the imaginary component of the normalized cross-spectrum.
Modulation index
For optogenetic stimulations, modulation index was calculated as (value stimulation - value pre stimulation) / (value stimulation + value pre stimulation).
Peak frequency and strength
Peak frequency and peak strength were calculated for the most prominent peak in the spectrum defined by the product of peak amplitude, peak half width and peak prominence.
Single unit analysis
Single unit activity (SUA) was detected and clustered using klusta (Rossant et al., 2016) and manually curated using phy (https://github.com/cortex-lab/phy). Modulation index of SUA firing rate was calculated on 3 s long windows pre- and during stimulation. Significance level was set at p < 0.01 and calculated using Wilcoxon signed rank test for zero median for single stimulation trials. Single unit autocorrelation histogram was calculated using 0.5 ms bins followed by frequency spectrum computation using discrete Fourier transform. Oscillation score was calculated by dividing peak magnitude of detected peak frequency by average spectrum magnitude for pre- and during stimulation periods. For pairwise neuronal correlation SUA spike trains were convolved using a Gaussian window with a standard deviation of 20 ms. Correlation of convolved spike trains was computed using Spearman’s rho. Cumulative distribution functions from before and during stimulations were compared using the two-sample Kolmogorov-Smirnov test. RS and FS units were distinguished by manually setting a threshold based on spike half width and trough-to-peak duration (FS, P11-12 half width < 0.31 ms, trough to peak < 1.28 ms, P23-25 and P38-40 half width < 0.31 ms, trough to peak < 0.64 ms).
EPSCs and IPSCs extraction
Voltage-clamp traces were demeaned and detrended with a median filter (mdefilt1). Traces were then deconvolved using a double exponential kernel using the OASIS toolbox (https://github.com/zhoupc/OASIS_matlab; Friedrich et al., 2017). After manual optimization of two separate kernels for EPSCs and IPSCs, the software was run with the “foopsi” model and a regularization parameter “lambda” set at the value of 10−11. The parameters “smin” and “b” were automatically optimized, separately for each trace. The deconvolved traces were then used to compute the integral of EPSCs and IPSCs for baseline and stimulation periods.
Statistics
Statistical analyses were performed in the MATLAB environment or in R Statistical Software (Foundation for Statistical Computing, Austria). Data were tested for significant differences (∗p < 0.05, ∗∗p < 0.01 and ∗∗∗p < 0.001) using non-parametric Wilcoxon rank sum test for unpaired and Wilcoxon signed rank test for paired data or Kruskal-Wallis test with Bonferroni corrected post hoc analysis or Fisher’s exact test for binary data analysis. Nested data were analyzed with linear mixed-effect models with animal as fixed effect and Turkey multi comparison correction for post hoc analysis. See Tables S1 and S2 for detailed statistics.
Acknowledgments
We thank Drs. T. Oertner and S. Wiegert for providing optogenetic tools; Dr. X. Xu for help with hippocampal injections; M. Hnida for help with early stimulation; and P. Putthoff, A. Dahlmann, and K. Titze for excellent technical assistance. This work was funded by grants from the European Research Council (ERC-2015-CoG 681577 to I.L.H.-O.) and the German Research Foundation (Ha 4466/10-1, Ha4466/11-1, Ha4466/12-1, SPP 1665, and SFB 936 B5 to I.L.H.-O.).
Author contributions
S.H.B., J.A.P., and I.L.H.-O. designed the experiments. S.H.B., J.A.P., M.C., and A.M. carried out the experiments. S.H.B., J.A.P., and M.C. analyzed the data. S.H.B., J.A.P., M.C., and I.L.H.-O. interpreted the data and wrote the manuscript. All authors discussed and commented on the manuscript.
Declaration of interests
The authors declare no competing interests.
Published: March 5, 2021
Footnotes
Supplemental information can be found online at https://doi.org/10.1016/j.neuron.2021.02.011.
Contributor Information
Sebastian H. Bitzenhofer, Email: sbitzenhofer@ucsd.edu.
Ileana L. Hanganu-Opatz, Email: hangop@zmnh.uni-hamburg.de.
Supplemental information
References
- Ahlbeck J., Song L., Chini M., Bitzenhofer S.H., Hanganu-Opatz I.L. Glutamatergic drive along the septo-temporal axis of hippocampus boosts prelimbic oscillations in the neonatal mouse. eLife. 2018;7:e33158. doi: 10.7554/eLife.33158. [DOI] [PMC free article] [PubMed] [Google Scholar]
- Anastasiades P.G., Butt S.J.B. A role for silent synapses in the development of the pathway from layer 2/3 to 5 pyramidal cells in the neocortex. J. Neurosci. 2012;32:13085–13099. doi: 10.1523/JNEUROSCI.1262-12.2012. [DOI] [PMC free article] [PubMed] [Google Scholar]
- Atallah B.V., Scanziani M. Instantaneous modulation of gamma oscillation frequency by balancing excitation with inhibition. Neuron. 2009;62:566–577. doi: 10.1016/j.neuron.2009.04.027. [DOI] [PMC free article] [PubMed] [Google Scholar]
- Barker G.R.I., Warburton E.C. When is the hippocampus involved in recognition memory? J. Neurosci. 2011;31:10721–10731. doi: 10.1523/JNEUROSCI.6413-10.2011. [DOI] [PMC free article] [PubMed] [Google Scholar]
- Baron-Cohen S. The cognitive neuroscience of autism. J. Neurol. Neurosurg. Psychiatry. 2004;75:945–948. doi: 10.1136/jnnp.2003.018713. [DOI] [PMC free article] [PubMed] [Google Scholar]
- Bastos A.M., Loonis R., Kornblith S., Lundqvist M., Miller E.K. Laminar recordings in frontal cortex suggest distinct layers for maintenance and control of working memory. Proc. Natl. Acad. Sci. USA. 2018;115:1117–1122. doi: 10.1073/pnas.1710323115. [DOI] [PMC free article] [PubMed] [Google Scholar]
- Berndt A., Schoenenberger P., Mattis J., Tye K.M., Deisseroth K., Hegemann P., Oertner T.G. High-efficiency channelrhodopsins for fast neuronal stimulation at low light levels. Proc. Natl. Acad. Sci. USA. 2011;108:7595–7600. doi: 10.1073/pnas.1017210108. [DOI] [PMC free article] [PubMed] [Google Scholar]
- Bitzenhofer S.H., Sieben K., Siebert K.D., Spehr M., Hanganu-Opatz I.L. Oscillatory activity in developing prefrontal networks results from theta-gamma-modulated synaptic inputs. Cell Rep. 2015;11:486–497. doi: 10.1016/j.celrep.2015.03.031. [DOI] [PubMed] [Google Scholar]
- Bitzenhofer S.H., Ahlbeck J., Wolff A., Wiegert J.S., Gee C.E., Oertner T.G., Hanganu-Opatz I.L. Layer-specific optogenetic activation of pyramidal neurons causes beta-gamma entrainment of neonatal networks. Nat. Commun. 2017;8:14563. doi: 10.1038/ncomms14563. [DOI] [PMC free article] [PubMed] [Google Scholar]
- Bitzenhofer S.H., Ahlbeck J., Hanganu-Opatz I.L. Methodological Approach for Optogenetic Manipulation of Neonatal Neuronal Networks. Front. Cell. Neurosci. 2017;11:239. doi: 10.3389/fncel.2017.00239. [DOI] [PMC free article] [PubMed] [Google Scholar]
- Bitzenhofer S.H., Pöpplau J.A., Hanganu-Opatz I. Gamma activity accelerates during prefrontal development. eLife. 2020;9:e56795. doi: 10.7554/eLife.56795. [DOI] [PMC free article] [PubMed] [Google Scholar]
- Blanquie O., Yang J.-W., Kilb W., Sharopov S., Sinning A., Luhmann H.J. Electrical activity controls area-specific expression of neuronal apoptosis in the mouse developing cerebral cortex. eLife. 2017;6:e27696. doi: 10.7554/eLife.27696. [DOI] [PMC free article] [PubMed] [Google Scholar]
- Brockmann M.D., Pöschel B., Cichon N., Hanganu-Opatz I.L. Coupled oscillations mediate directed interactions between prefrontal cortex and hippocampus of the neonatal rat. Neuron. 2011;71:332–347. doi: 10.1016/j.neuron.2011.05.041. [DOI] [PubMed] [Google Scholar]
- Caballero A., Flores-Barrera E., Thomases D.R., Tseng K.Y. Downregulation of parvalbumin expression in the prefrontal cortex during adolescence causes enduring prefrontal disinhibition in adulthood. Neuropsychopharmacology. 2020;45:1527–1535. doi: 10.1038/s41386-020-0709-9. [DOI] [PMC free article] [PubMed] [Google Scholar]
- Cardin J.A., Carlén M., Meletis K., Knoblich U., Zhang F., Deisseroth K., Tsai L.-H., Moore C.I. Driving fast-spiking cells induces gamma rhythm and controls sensory responses. Nature. 2009;459:663–667. doi: 10.1038/nature08002. [DOI] [PMC free article] [PubMed] [Google Scholar]
- Chen G., Zhang Y., Li X., Zhao X., Ye Q., Lin Y., Tao H.W., Rasch M.J., Zhang X. Distinct Inhibitory Circuits Orchestrate Cortical beta and gamma Band Oscillations. Neuron. 2017;96:1403–1418.e6. doi: 10.1016/j.neuron.2017.11.033. [DOI] [PMC free article] [PubMed] [Google Scholar]
- Chini M., Hanganu-Opatz I.L. Prefrontal Cortex Development in Health and Disease: Lessons from Rodents and Humans. Trends Neurosci. 2020;24 doi: 10.1016/j.tins.2020.10.017. S0166-2236(20)30250-2. [DOI] [PubMed] [Google Scholar]
- Chini M., Pöpplau J.A., Lindemann C., Carol-Perdiguer L., Hnida M., Oberländer V., Xu X., Ahlbeck J., Bitzenhofer S.H., Mulert C., Hanganu-Opatz I.L. Resolving and Rescuing Developmental Miswiring in a Mouse Model of Cognitive Impairment. Neuron. 2020;105:60–74.e7. doi: 10.1016/j.neuron.2019.09.042. [DOI] [PMC free article] [PubMed] [Google Scholar]
- Cho K.K.A., Hoch R., Lee A.T., Patel T., Rubenstein J.L.R., Sohal V.S. Gamma rhythms link prefrontal interneuron dysfunction with cognitive inflexibility in Dlx5/6(+/-) mice. Neuron. 2015;85:1332–1343. doi: 10.1016/j.neuron.2015.02.019. [DOI] [PMC free article] [PubMed] [Google Scholar]
- Clause A., Kim G., Sonntag M., Weisz C.J.C., Vetter D.E., Rűbsamen R., Kandler K. The precise temporal pattern of prehearing spontaneous activity is necessary for tonotopic map refinement. Neuron. 2014;82:822–835. doi: 10.1016/j.neuron.2014.04.001. [DOI] [PMC free article] [PubMed] [Google Scholar]
- Clifton N.E., Hannon E., Harwood J.C., Di Florio A., Thomas K.L., Holmans P.A., Walters J.T.R., O’Donovan M.C., Owen M.J., Pocklington A.J., Hall J. Dynamic expression of genes associated with schizophrenia and bipolar disorder across development. Transl. Psychiatry. 2019;9:74. doi: 10.1038/s41398-019-0405-x. [DOI] [PMC free article] [PubMed] [Google Scholar]
- Courchesne E. Brain development in autism: early overgrowth followed by premature arrest of growth. Ment. Retard. Dev. Disabil. Res. Rev. 2004;10:106–111. doi: 10.1002/mrdd.20020. [DOI] [PubMed] [Google Scholar]
- Denaxa M., Neves G., Rabinowitz A., Kemlo S., Liodis P., Burrone J., Pachnis V. Modulation of Apoptosis Controls Inhibitory Interneuron Number in the Cortex. Cell Rep. 2018;22:1710–1721. doi: 10.1016/j.celrep.2018.01.064. [DOI] [PMC free article] [PubMed] [Google Scholar]
- Friedrich J., Zhou P., Paninski L. Fast online deconvolution of calcium imaging data. PLoS Comput. Biol. 2017;13:e1005423. doi: 10.1371/journal.pcbi.1005423. [DOI] [PMC free article] [PubMed] [Google Scholar]
- Frith C., Dolan R. The role of the prefrontal cortex in higher cognitive functions. Brain Res. Cogn. Brain Res. 1996;5:175–181. doi: 10.1016/s0926-6410(96)00054-7. [DOI] [PubMed] [Google Scholar]
- Gallinat J., Winterer G., Herrmann C.S., Senkowski D. Reduced oscillatory gamma-band responses in unmedicated schizophrenic patients indicate impaired frontal network processing. Clin. Neurophysiol. 2004;115:1863–1874. doi: 10.1016/j.clinph.2004.03.013. [DOI] [PubMed] [Google Scholar]
- Geschwind D.H. Genetics of autism spectrum disorders. Trends Cogn. Sci. 2011;15:409–416. doi: 10.1016/j.tics.2011.07.003. [DOI] [PMC free article] [PubMed] [Google Scholar]
- Gour A., Boergens K.M., Heike N., Hua Y., Laserstein P., Song K., Helmstaedter M. Postnatal connectomic development of inhibition in mouse barrel cortex. Science. 2021;371:eabb4534. doi: 10.1126/science.abb4534. [DOI] [PubMed] [Google Scholar]
- Hall J., Trent S., Thomas K.L., O’Donovan M.C., Owen M.J. Genetic risk for schizophrenia: convergence on synaptic pathways involved in plasticity. Biol. Psychiatry. 2015;77:52–58. doi: 10.1016/j.biopsych.2014.07.011. [DOI] [PubMed] [Google Scholar]
- Hanganu I.L., Ben-Ari Y., Khazipov R. Retinal waves trigger spindle bursts in the neonatal rat visual cortex. J. Neurosci. 2006;26:6728–6736. doi: 10.1523/JNEUROSCI.0752-06.2006. [DOI] [PMC free article] [PubMed] [Google Scholar]
- Hartung H., Cichon N., De Feo V., Riemann S., Schildt S., Lindemann C., Mulert C., Gogos J.A., Hanganu-Opatz I.L. From Shortage to Surge: A Developmental Switch in Hippocampal-Prefrontal Coupling in a Gene-Environment Model of Neuropsychiatric Disorders. Cereb. Cortex. 2016;26:4265–4281. doi: 10.1093/cercor/bhw274. [DOI] [PMC free article] [PubMed] [Google Scholar]
- Hartung H., Brockmann M.D., Pöschel B., De Feo V., Hanganu-Opatz I.L. Thalamic and Entorhinal Network Activity Differently Modulates the Functional Development of Prefrontal-Hippocampal Interactions. J. Neurosci. 2016;36:3676–3690. doi: 10.1523/JNEUROSCI.3232-15.2016. [DOI] [PMC free article] [PubMed] [Google Scholar]
- Huberman A.D., Speer C.M., Chapman B. Spontaneous retinal activity mediates development of ocular dominance columns and binocular receptive fields in v1. Neuron. 2006;52:247–254. doi: 10.1016/j.neuron.2006.07.028. [DOI] [PMC free article] [PubMed] [Google Scholar]
- Iyer K.K., Roberts J.A., Hellström-Westas L., Wikström S., Hansen Pupp I., Ley D., Vanhatalo S., Breakspear M. Cortical burst dynamics predict clinical outcome early in extremely preterm infants. Brain. 2015;138:2206–2218. doi: 10.1093/brain/awv129. [DOI] [PubMed] [Google Scholar]
- Janiesch P.C., Krüger H.-S., Pöschel B., Hanganu-Opatz I.L. Cholinergic control in developing prefrontal-hippocampal networks. J. Neurosci. 2011;31:17955–17970. doi: 10.1523/JNEUROSCI.2644-11.2011. [DOI] [PMC free article] [PubMed] [Google Scholar]
- Katz L.C., Shatz C.J. Synaptic activity and the construction of cortical circuits. Science. 1996;274:1133–1138. doi: 10.1126/science.274.5290.1133. [DOI] [PubMed] [Google Scholar]
- Khazipov R., Sirota A., Leinekugel X., Holmes G.L., Ben-Ari Y., Buzsáki G. Early motor activity drives spindle bursts in the developing somatosensory cortex. Nature. 2004;432:758–761. doi: 10.1038/nature03132. [DOI] [PubMed] [Google Scholar]
- Kirischuk S., Sinning A., Blanquie O., Yang J.-W., Luhmann H.J., Kilb W. Modulation of Neocortical Development by Early Neuronal Activity: Physiology and Pathophysiology. Front. Cell. Neurosci. 2017;11:379. doi: 10.3389/fncel.2017.00379. [DOI] [PMC free article] [PubMed] [Google Scholar]
- Kirkby L.A., Sack G.S., Firl A., Feller M.B. A role for correlated spontaneous activity in the assembly of neural circuits. Neuron. 2013;80:1129–1144. doi: 10.1016/j.neuron.2013.10.030. [DOI] [PMC free article] [PubMed] [Google Scholar]
- Le Roy I., Carlier M., Roubertoux P.L. Sensory and motor development in mice: genes, environment and their interactions. Behav. Brain Res. 2001;125:57–64. doi: 10.1016/s0166-4328(01)00279-0. [DOI] [PubMed] [Google Scholar]
- Lee J., Durand R., Gradinaru V., Zhang F., Goshen I., Kim D.-S., Fenno L.E., Ramakrishnan C., Deisseroth K. Global and local fMRI signals driven by neurons defined optogenetically by type and wiring. Nature. 2010;465:788–792. doi: 10.1038/nature09108. [DOI] [PMC free article] [PubMed] [Google Scholar]
- Leicht G., Vauth S., Polomac N., Andreou C., Rauh J., Mußmann M., Karow A., Mulert C. EEG-Informed fMRI Reveals a Disturbed Gamma-Band-Specific Network in Subjects at High Risk for Psychosis. Schizophr. Bull. 2016;42:239–249. doi: 10.1093/schbul/sbv092. [DOI] [PMC free article] [PubMed] [Google Scholar]
- Lim L., Mi D., Llorca A., Marín O. Development and functional diversification of cortical interneurons. Neuron. 2018;100:294–313. doi: 10.1016/j.neuron.2018.10.009. [DOI] [PMC free article] [PubMed] [Google Scholar]
- Lindemann C., Ahlbeck J., Bitzenhofer S.H., Hanganu-Opatz I.L. Spindle Activity Orchestrates Plasticity during Development and Sleep. Neural Plast. 2016;2016:5787423. doi: 10.1155/2016/5787423. [DOI] [PMC free article] [PubMed] [Google Scholar]
- Marín O. Developmental timing and critical windows for the treatment of psychiatric disorders. Nat. Med. 2016;22:1229–1238. doi: 10.1038/nm.4225. [DOI] [PubMed] [Google Scholar]
- Mattis J., Tye K., Ferenczi E., Ramakrishnan C., O’Shea D.J., Prakash R., Gunaydin L.A., Hyun M., Fenno L.E., Gradinaru V. Principles for applying optogenetic tools derived from direct comparative analysis of microbial opsins. Nat. Methods. 2011;9:159–172. doi: 10.1038/nmeth.1808. [DOI] [PMC free article] [PubMed] [Google Scholar]
- Mikanmaa E., Grent-’t-Jong T., Hua L., Recasens M., Thune H., Uhlhaas P.J. Towards a neurodynamical understanding of the prodrome in schizophrenia. Neuroimage. 2019;190:144–153. doi: 10.1016/j.neuroimage.2017.11.026. [DOI] [PubMed] [Google Scholar]
- Miller E.K. The prefrontal cortex and cognitive control. Nat. Rev. Neurosci. 2000;1:59–65. doi: 10.1038/35036228. [DOI] [PubMed] [Google Scholar]
- Peixoto R.T., Wang W., Croney D.M., Kozorovitskiy Y., Sabatini B.L. Early hyperactivity and precocious maturation of corticostriatal circuits in Shank3B(-/-) mice. Nat. Neurosci. 2016;19:716–724. doi: 10.1038/nn.4260. [DOI] [PMC free article] [PubMed] [Google Scholar]
- Pennington Z.T., Dong Z., Feng Y., Vetere L.M., Page-Harley L., Shuman T., Cai D.J. ezTrack: An open-source video analysis pipeline for the investigation of animal behavior. Sci. Rep. 2019;9:19979. doi: 10.1038/s41598-019-56408-9. [DOI] [PMC free article] [PubMed] [Google Scholar]
- Pfeffer C.K., Xue M., He M., Huang Z.J., Scanziani M. Inhibition of inhibition in visual cortex: the logic of connections between molecularly distinct interneurons. Nat. Neurosci. 2013;16:1068–1076. doi: 10.1038/nn.3446. [DOI] [PMC free article] [PubMed] [Google Scholar]
- Richter M., Murtaza N., Scharrenberg R., White S.H., Johanns O., Walker S., Yuen R.K.C., Schwanke B., Bedürftig B., Henis M. Altered TAOK2 activity causes autism-related neurodevelopmental and cognitive abnormalities through RhoA signaling. Mol. Psychiatry. 2019;24:1329–1350. doi: 10.1038/s41380-018-0025-5. [DOI] [PMC free article] [PubMed] [Google Scholar]
- Robertson C.E., Baron-Cohen S. Sensory perception in autism. Nat. Rev. Neurosci. 2017;18:671–684. doi: 10.1038/nrn.2017.112. [DOI] [PubMed] [Google Scholar]
- Rossant C., Kadir S.N., Goodman D.F.M., Schulman J., Hunter M.L.D., Saleem A.B., Grosmark A., Belluscio M., Denfield G.H., Ecker A.S. Spike sorting for large, dense electrode arrays. Nat. Neurosci. 2016;19:634–641. doi: 10.1038/nn.4268. [DOI] [PMC free article] [PubMed] [Google Scholar]
- Sahin M., Sur M. Genes, circuits, and precision therapies for autism and related neurodevelopmental disorders. Science. 2015;350:aab3897. doi: 10.1126/science.aab3897. [DOI] [PMC free article] [PubMed] [Google Scholar]
- Schmitt A., Malchow B., Hasan A., Falkai P. The impact of environmental factors in severe psychiatric disorders. Front. Neurosci. 2014;8:19. doi: 10.3389/fnins.2014.00019. [DOI] [PMC free article] [PubMed] [Google Scholar]
- Sohal V.S., Rubenstein J.L.R. Excitation-inhibition balance as a framework for investigating mechanisms in neuropsychiatric disorders. Mol. Psychiatry. 2019;24:1248–1257. doi: 10.1038/s41380-019-0426-0. [DOI] [PMC free article] [PubMed] [Google Scholar]
- Stuchlik A., Sumiyoshi T. Cognitive deficits in schizophrenia and other neuropsychiatric disorders: convergence of preclinical and clinical evidence. Front. Behav. Neurosci. 2014;8:444. doi: 10.3389/fnbeh.2014.00444. [DOI] [PMC free article] [PubMed] [Google Scholar]
- Uhlhaas P.J., Singer W. Abnormal neural oscillations and synchrony in schizophrenia. Nat. Rev. Neurosci. 2010;11:100–113. doi: 10.1038/nrn2774. [DOI] [PubMed] [Google Scholar]
- Van Eden C.G., Uylings H.B.M. Postnatal volumetric development of the prefrontal cortex in the rat. J. Comp. Neurol. 1985;241:268–274. doi: 10.1002/cne.902410303. [DOI] [PubMed] [Google Scholar]
- van Os J., Kapur S. Schizophrenia. Lancet. 2009;374:635–645. doi: 10.1016/S0140-6736(09)60995-8. [DOI] [PubMed] [Google Scholar]
- Vierock J., Rodriguez-Rozada S., Pieper F., Dieter A., Bergs A., Zeitzschel N., Ahlbeck J., Sauter K., Gottschalk A., Engel A.K. BiPOLES: a tool for bidirectional dual-color optogenetic control of neurons. bioRxiv. 2020 doi: 10.1101/2020.07.15.204347. [DOI] [Google Scholar]
- Wayman G.A., Impey S., Marks D., Saneyoshi T., Grant W.F., Derkach V., Soderling T.R. Activity-dependent dendritic arborization mediated by CaM-kinase I activation and enhanced CREB-dependent transcription of Wnt-2. Neuron. 2006;50:897–909. doi: 10.1016/j.neuron.2006.05.008. [DOI] [PubMed] [Google Scholar]
- Wong F.K., Bercsenyi K., Sreenivasan V., Portalés A., Fernández-Otero M., Marín O. Pyramidal cell regulation of interneuron survival sculpts cortical networks. Nature. 2018;557:668–673. doi: 10.1038/s41586-018-0139-6. [DOI] [PMC free article] [PubMed] [Google Scholar]
- Workman A.D., Charvet C.J., Clancy B., Darlington R.B., Finlay B.L. Modeling transformations of neurodevelopmental sequences across mammalian species. J. Neurosci. 2013;33:7368–7383. doi: 10.1523/JNEUROSCI.5746-12.2013. [DOI] [PMC free article] [PubMed] [Google Scholar]
Associated Data
This section collects any data citations, data availability statements, or supplementary materials included in this article.
Supplementary Materials
Data Availability Statement
LFP and SUA data for all recordings are available at the following open-access repository: https://gin.g-node.org/Jastyn/Early_activity_is_critical_for_prefrontal_development. Further data and code supporting the findings of this study are available from the corresponding authors on request.