Abstract
Purpose:
A compensation strategy that was developed to measure the choriocapillaris (CC) flow deficits (FDs) under drusen was tested in eyes with large drusen from age-related macular degeneration (AMD) before and after the drusen spontaneously resolved without evidence of disease progression.
Design:
Prospective, observational consecutive case series.
Methods:
Patients with AMD were enrolled in a prospective SS-OCT imaging study (PLEX® Elite 9000, Carl Zeiss Meditec). Consecutive eyes with large drusen were followed, and eyes that underwent spontaneous collapse of drusen without evidence of disease progression were identified retrospectively. The drusen-resolved regions were outlined. CC FDs were measured using a previously published compensation strategy that adjusted for the decreased signal intensity underlying drusen. Both the percentage of FDs (FD%) and the mean FD sizes (MFDSs) were measured before and after drusen resolution.
Results:
Resolution of drusen was identified in 8 eyes from 8 patients. The average interval between the two visits was 7.8 months. The average drusen volumes measured between visits were 0.23 mm3 and 0.04 mm3, respectively. After the drusen decreased, the average follow-up time without evidence of disease progression was 10.1 months. When the two visits were compared, there were no statistically significant differences in any of the CC parameters within the drusen resolved regions once the compensation strategy was applied (all P-values > 0.22).
Conclusions:
In this naturally occurring experiment in which drusen collapsed without evidence of disease progression, the CC parameters were similar once our compensation strategy was applied both before and after the drusen resolved.
INTRODUCTION
The choriocapillaris (CC) is a dense monolayer meshwork of fenestrated capillaries within the choroid adjacent to Bruch’s membrane (BM) that provides nutritional support for the retinal pigment epithelium (RPE) and outer retina.1 Histological studies have shown that a decrease in CC density is associated with normal aging and age-related macular degeneration (AMD).2–5 Ramrattan et al. found a decrease in CC density in eyes with drusen and geographic atrophy (GA).2 Mullins et al. studied 21 donor eyes diagnosed with early AMD and found that the CC vessel density was significantly decreased under drusen compared with age-matched normal eyes.4 Up until recently, the study of the CC in vivo could not be routinely performed using conventional imaging techniques such as fluorescein angiography (FA) and Indocyanine green angiography (ICGA) due to the small caliber of the capillaries, the small intercapillary spacing, and the overlying RPE, which prevents direct visualization of the CC using dye based angiography.6
With the development of spectral domain optical coherence tomography angiography (SD-OCTA) and swept source OCTA (SS-OCTA), the CC can be visualized in vivo and longitudinal studies have been performed.7–26 SS-OCTA provides the best visualization of the CC due to the longer wavelength (1060 nm) of its light source compared with SD-OCTA imaging at a wavelength of 840 nm.27 The longer wavelength used by SS-OCTA instruments allows for better penetration of the light through the RPE and the longer wavelength is safer so a higher laser energy can be used, resulting in a better signal to noise ratio and improved visualization of the CC.28–34 Moreover, the faster scanning rate of the SS-OCTA instruments allows for denser scanning patterns for a given acquisition time, which results in improved image quality. The ability of OCTA to detect blood flow within the CC is achieved by repeating multiple B-scans at a specific position and then using specific algorithms that compare differences in the intensity and phase signals from these repeated B scans, and these differences are considered to be the result of erythrocytes moving within the capillaries, thus these changes in the signals from repeated B-scans represent blood flow.30–34
Using SS-OCTA imaging, several groups have reported changes in the CC that are consistent with previously published histological findings.8–13, 15, 16, 26 While the lateral resolution of 14–20 microns precludes the direct visualization of CC capillaris and lobules within the macula, the resolution does allow for the detection of flow deficits (FDs) or regions within the capillary meshwork where the blood flow is undetectable and these FDs can be quantified. Using SS-OCTA imaging, Zheng et al. investigated CC flow deficits in 164 normal eyes from different age groups, and they found that CC FDs increased with age, especially within the central 1mm circle under the fovea, which is consistent with previous histological findings.2, 7, 8, 26 and other SS-OCTA reports.17, 35
Several groups have attempted to study the CC in AMD, and while an increase in macular FDs was reported, these groups were unable to quantitate the CC FDs under drusen due to the signal attenuation and the shadowing effect of drusen on the underlying choroid, especially when SD-OCTA was used.13, 16, 24, 25 Nassisi et al. followed 46 eyes with drusen using SD- OCTA for a minimum of 1 year, and they demonstrated an inability to detect the CC under drusen.16 However, they did find significant CC impairment around drusen, and this impairment appeared to be associated with the appearance and growth of drusen, which suggested that changes in the CC might play an important role in disease progression.
Even though SS-OCTA, with its longer wavelength, has been shown to be better than SD-OCTA in identifying flow impairment under drusen,27 the larger drusen can still cast a shadow on the underlying CC.36 Zhang et al. developed a strategy to compensate for this signal attenuation caused by drusen.36 This compensation strategy uses the corresponding CC en face structural image. The structural image is inverted so that the darker signal intensities under drusen become brighter. This enhanced signal intensity from the inverted image is then used to enhance the CC flow signal under drusen. This compensation strategy was tested on both normal eyes and drusen eyes, and while the quantitation of CC FDs remained the same in normal eyes without drusen, the CC was visualized better under drusen with this compensation strategy and the repeatability of these measurements improved. Several groups have used this strategy to visualize the CC in eyes with drusen secondary to AMD and have shown that drusen are associated with an increase in CC FDs.12, 14, 36 However, uncertainty persists as to whether this increase in FDs under drusen is real or the result of an inability to fully compensate for the signal attenuation.
To determine if our compensation strategy adequately corrects for the signal attenuation caused by drusen, we investigated the CC in eyes that had a significant drusen burden and then underwent a resolution of these drusen without any obvious anatomic changes that would suggest disease progression. Although infrequent, the resolution of drusen without any sequellae such as the formation of nascent GA (nGA), also known as incomplete outer retina and RPE atrophy (iRORA), and GA, also known as complete outer retina and RPE atrophy (cRORA), or macular neovascularization (MNV) can occur as reported in our previous natural history study.37, 38 In this current report, we show that our strategy successfully compensated for the signal attenuation caused by drusen and no obvious differences in the measurements of CC FDs were detected before and after the drusen collapsed.
MATERIAL AND METHODS
Patients were enrolled in a prosepective SS-OCT imaging study approved by the institutional review board of University of Miami Miller School of Medicine. Informed consents were obtained from each subject. The study was performed in accordance with the tenets of the Declaration of Helsinki and complied with the Health Insurance Portability and Accountability Act of 1996.
Patients with intermediate AMD (iAMD) and a central drusen volume > 0.03 mm3 were identified and followed prospectively using SS-OCTA imaging (PLEX Elite 9000, Carl Zeiss Meditec). None of these eyes had evidence of nGA or GA. Patients were imaged according to their routine clinical care schedule. Those eyes that subsequently showed resolution of drusen without formation of nGA, GA, or exudation were identified (Figure 1). SS-OCTA images from the two closest visits before and after drusen resolution were used for analysis of CC FDs.
Figure 1:
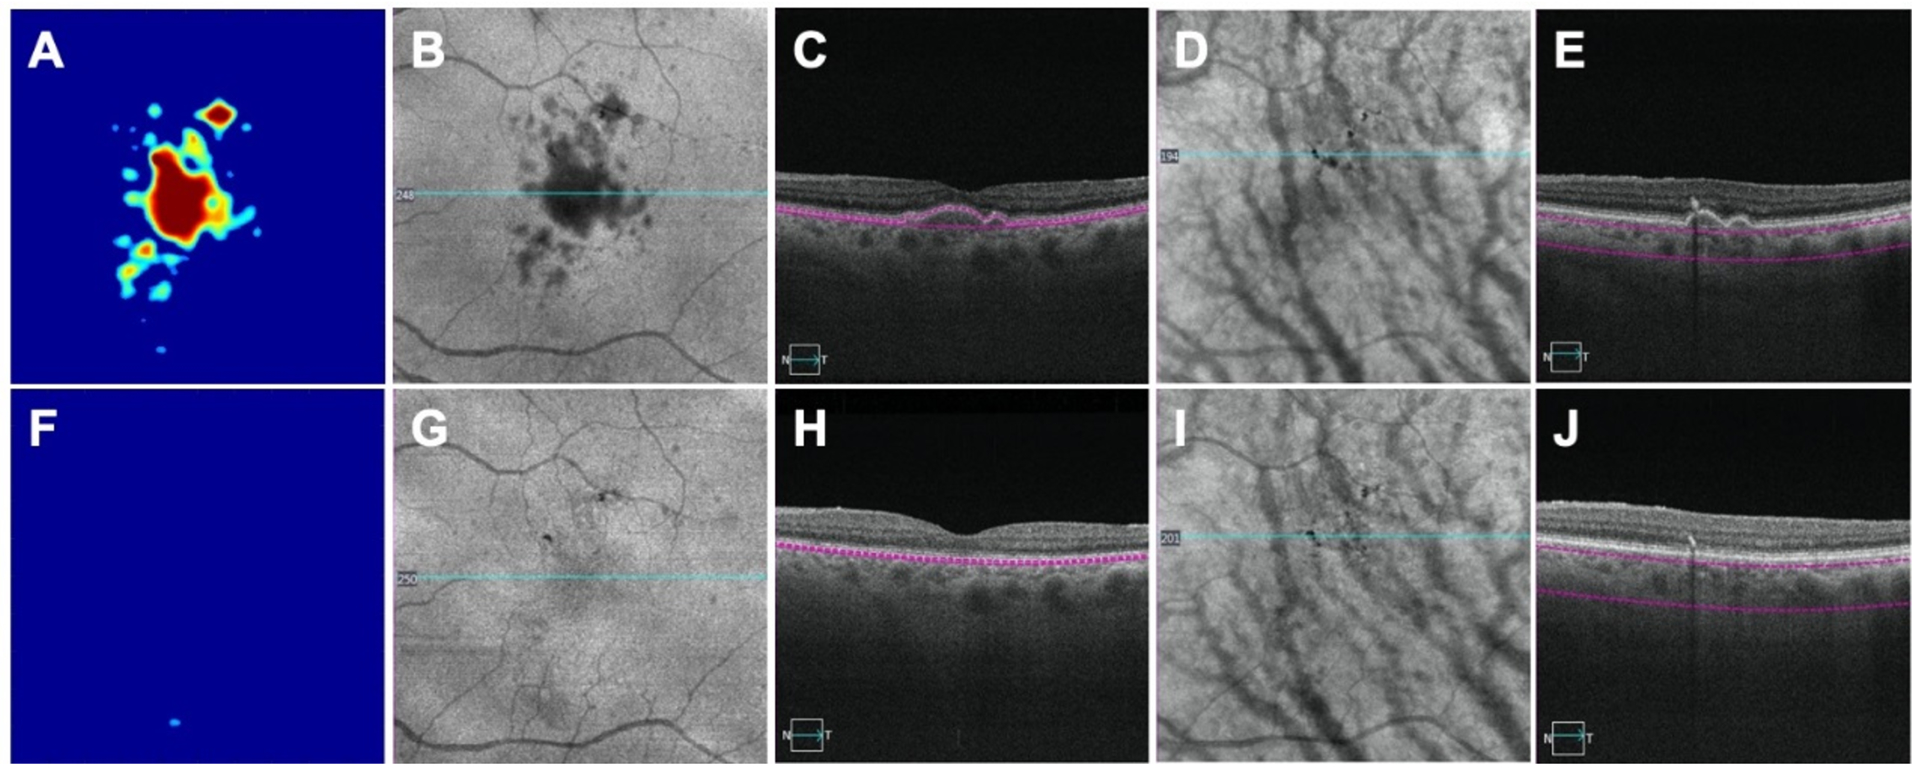
An eye with drusen imaged by swept source optical coherence tomography angiography (SS-OCTA) before and after the collapse of drusen. A, B, C, D, E: images before drusen collapse; F, G, H, I, J: images after drusen collapse; A, F: drusen volume maps before (0.18 mm3) and after drusen (0.00 mm3) collapse, respectively; B and G: Area of hypo reflectivity corresponding to drusen on the en face structure images obtained by using a custom slab segmented between retinal pigment epithelium (RPE) and Bruch’s membrane (BM); C, H: corresponding B scans showing RPE elevation; D, I: Pigmentation identified as black foci when using en face structure images created by a custom slab located 64 – 400 microns below BM; E, J: corresponding B-scans showing pigmentation as hyper-reflective foci that cause hypo-transmission onto the underlying choroid.
SS-OCTA images were obtained using a SS-OCTA instrument with a scanning rate of 100,000 A-scans per second that had a swept source laser with a central wavelength of 1,060 nm resulting in a full width at half maximum axial resolution of ~ 5.0 μm in tissue and a lateral resolution of ~20 μm estimated at the retinal surface. At least one 6×6 mm scan centered on the fovea was performed at each visit on each eye. Each 6×6 mm scan consisted of 500 B-scans with each B scan repeated twice at the same position, resulting in a homogenous sampling grid with a separation of 12 microns. The detection of flow information was achieved using the complex optical microangiography (OMAGc) algorithm.19, 39, 40 The CC was imaged by applying this algorithm to a 15 μm thick slab that started 16 μm below the RPE/BM complex.41 En face images were produced using a maximum projection method, and the 6×6 mm images were resized into 1024×1024 pixels to be consistent with machine output images. After removal of the retinal projection artifacts,42 a compensation strategy was applied to adjust for the signal attenuation due to drusen as previously described.36 Briefly, the CC signal attenuation caused by the overlying drusen (Figures 2A, 2B, 2E, 2F) was compensated by using the inverted and smoothed CC en face structural image to amplify the signal under drusen (Figures 2C, 2G). This resulted in a compensation of the shadowing seen on the CC en face flow image under drusen while the signal in the regions without drusen remained unchanged (Figures 2D, 2H). In the next step, both uncompensated CC en face flow images (Figures 2A, 2E) and compensated CC en face flow images (Figures 2D, 2H) were thresholded and the CC FDs measured.
Figure 2:
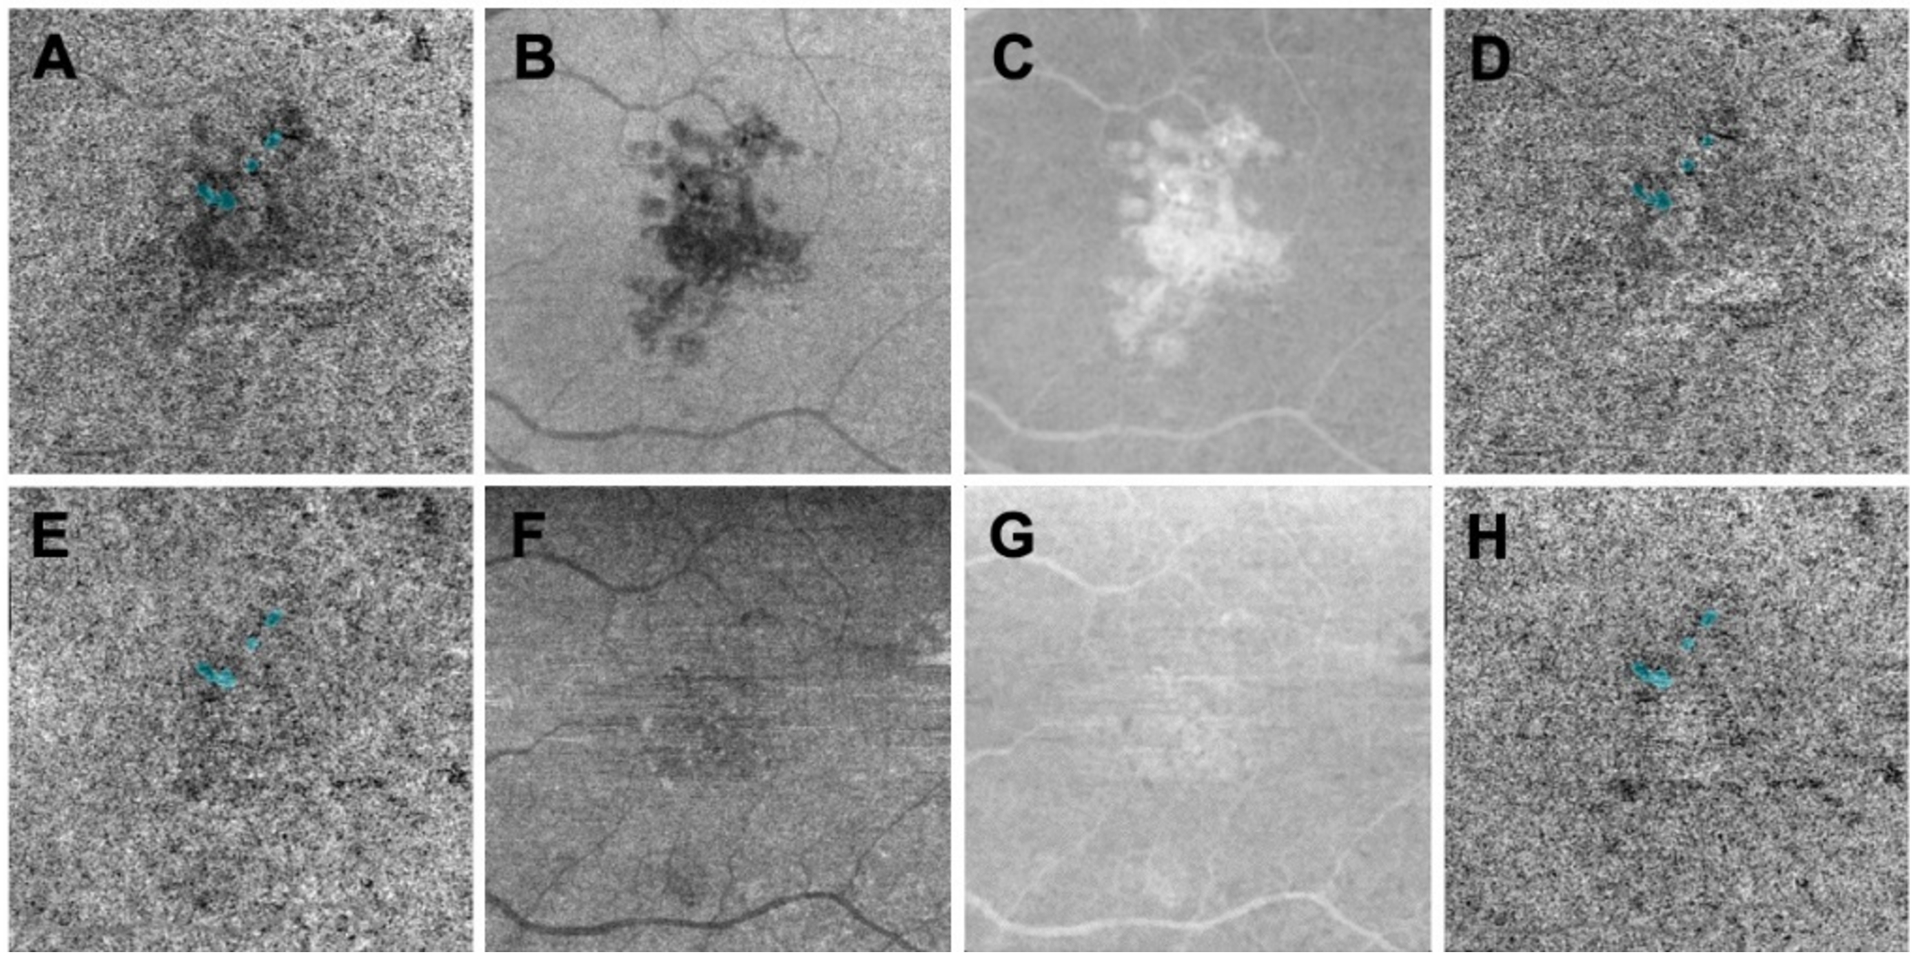
Compensation strategy used to enhance the choriocapillaris (CC) flow signal under drusen using swept source optical coherence tomography angiography (SS-OCTA). A, B, C, D: images before drusen collapse; E, F, G, H: images after drusen collapse; A,B, E, F: CC en face flow images using a custom slab with a thickness of 15 located 16 microns below Bruch’s membrane. A: The CC flow image under drusen appears attenuated and corresponds to the hypo-reflective structural signal under drusen as shown in B that resolves when the drusen collapse as shown in E and F. C and G: Enhanced and smoothed inverted en face CC structure images before and after drusen resolved that were used to compensate A and E, respectively. D, H: Compensated CC en face flow images using C and G, respectively, showing the enhanced CC signal under drusen while the signal in the outside regions remain the same.
Two different thresholding methods were used in this study: the Fuzzy C means (FCM) method and the Phansalkar method.41 The FCM approach is a global thresholding method that includes all the pixels from the entire image and the histogram distributions from all these pixels based on their different intensities. An elbow method was used to automatically determine the first membership that had the lowest OCTA intensity that represented FDs. In contrast, the Phansalkar method is a local threshold strategy and designed for analyzing images with low contrast. Phansalkar thresholding is computed for each pixel within a certain window radius, represented in pixels, and as such, the value of thresholding changes when choosing different window radii. Our previous studies have shown that when using the Phansalkar method and a large window radius of 15 pixels, the CC results appeared non-physiologic both qualitatively and quantitatively.41 However, when a smaller window radius of 2–4 pixels (approximately 1–2 intercapillary distances in normal subjects) was used in the Phansalkar method, the results appeared more physiologic and consistent with the FCM method when the CC was visualized and quantified. Thus, we used both the FCM method and the Phanthalkar method with a 3-pixel window size to threshold the CC en face images in this current study. After thresholding, any FDs with an equivalent diameter smaller than 24 microns were removed since they were smaller than the average normal intracapillary distance and most likely represented speckle noise.43 Overall, there were four different CC binary maps used for the final CC quantification: both uncompensated and compensated CC en face flow images thresholded using the FCM method (Figure 3) and uncompensated and compensated CC en face flow images thresholded using the Phansalkar method with window radius as 3 pixels (Figure 4). The CC FD measurements were then compared between these images before and after the resolution of drusen.
Figure 3:

Fuzzy-C means threshold method applied to uncompensated and compensated choriocapillaris (CC) images before and after drusen collapse. A, B, C, D: images before drusen collapse; E, F, G, H: images after drusen collapse; A, E: Uncompensated CC en face flow images using a custom slab with a thickness of 15 located 16 microns below Bruch’s membrane; B, F: CC binary maps thresholded using Fuzzy-C means based on images A and E; C, G: Compensated CC en face flow images before and after the drusen resolved using a validated compensation strategy; D, H: CC binary maps thresholded using Fuzzy-C means method based on images C and G.
Figure 4:
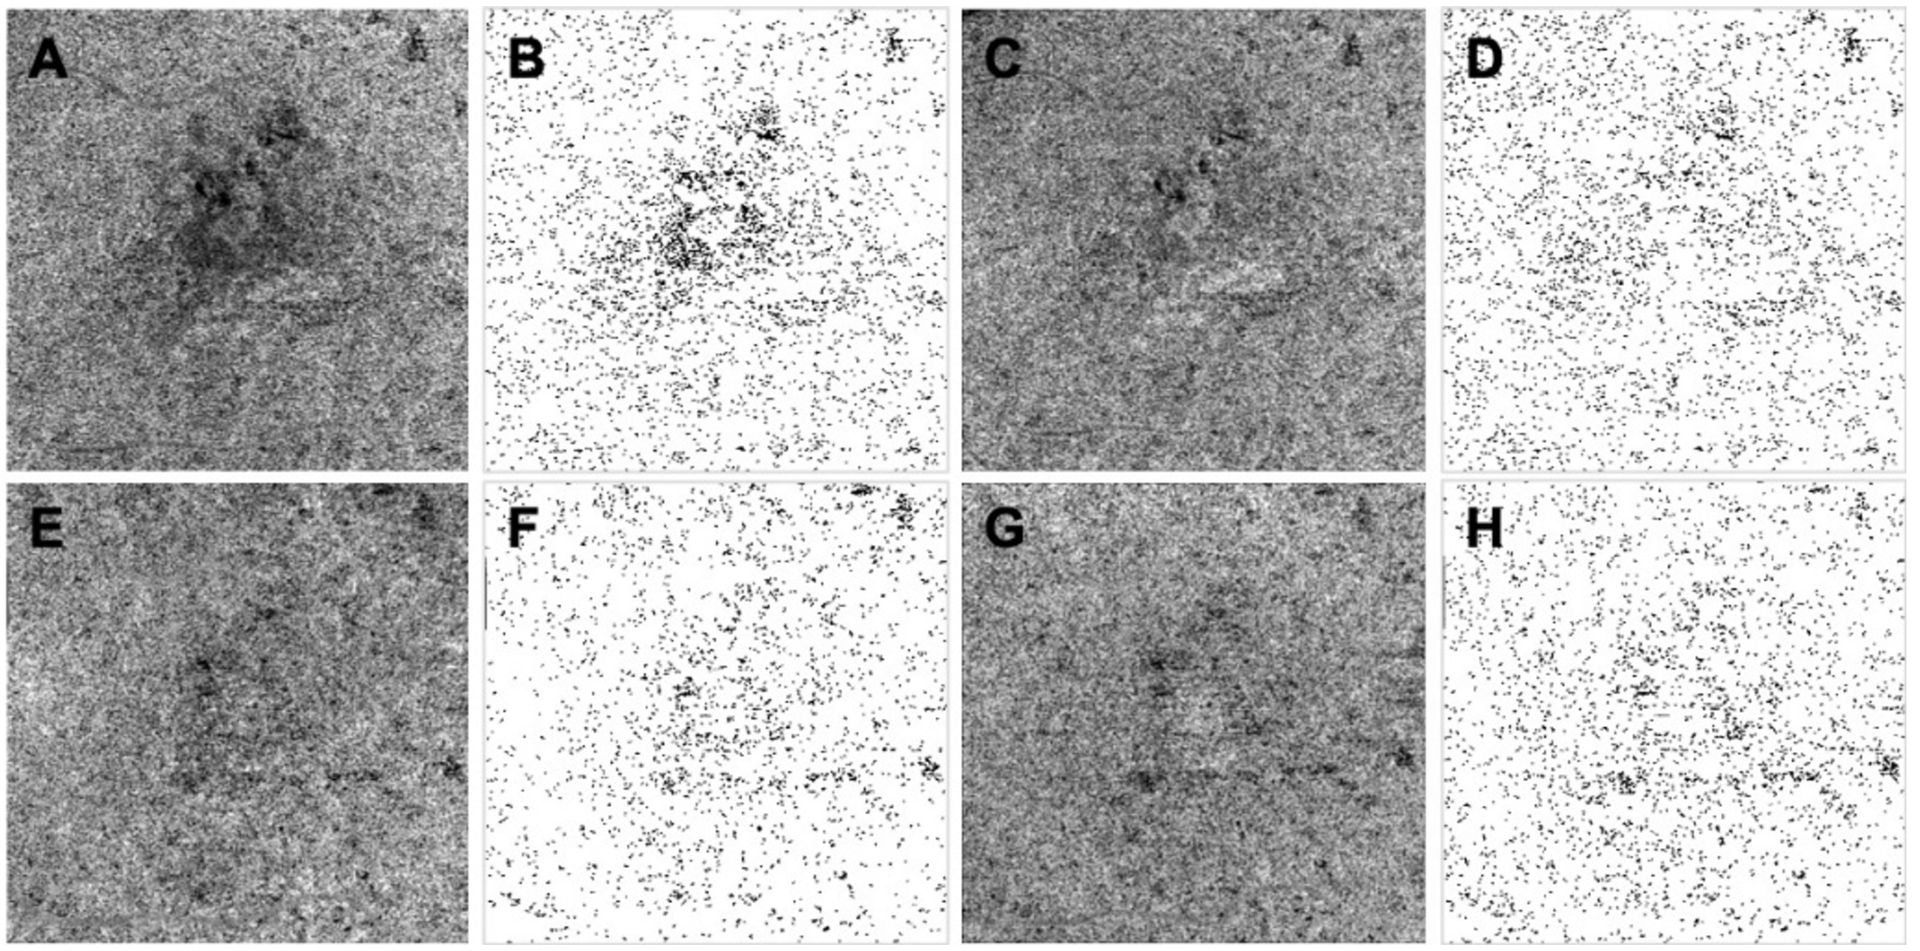
Phansalkar threshold method applied to uncompensated and compensated choriocapillaris (CC) images before and after drusen collapse. A, B, C, D: images before drusen collapse; E, F, G, H: images after drusen collapse; A, E: Uncompensated CC en face flow images using a custom slab with a thickness of 15 located 16 microns below Bruch’s membrane; B, F: CC binary maps thresholded using the Phansalkar method with a 3 pixel window radius based on images A and E; C, G: Compensated CC en face flow images before and after the drusen resolved using a validated compensation strategy; D, H: CC binary maps thresholded using the Phansalkar method with a 3 pixel window radius based on images C and G.
At each visit, two regions were identified and the CC FDs were quantified in these regions (Figure 5). The first region involved the area of drusen resolution (Figure 5C, 5G). At each visit, we manually outlined the area of the drusen using the en face structure images created by a custom slab segmented from the RPE to BM. The resolved drusen area was generated by subtracting drusen outlines at the resolved visit from drusen outlines at the visit prior to resolution. The second region served as a control for CC quantitation between visits and consisted a 300-micron wide rim area located 150–450 microns outside of all the drusen (Figure 5D, 5H). This region should not have any signal attenuation from the drusen and should not have been affected by the resolution of the drusen. For each case, the CC FDs between two visits were compared within the resolved drusen area and within the rim area outside of all the drusen.
Figure 5:
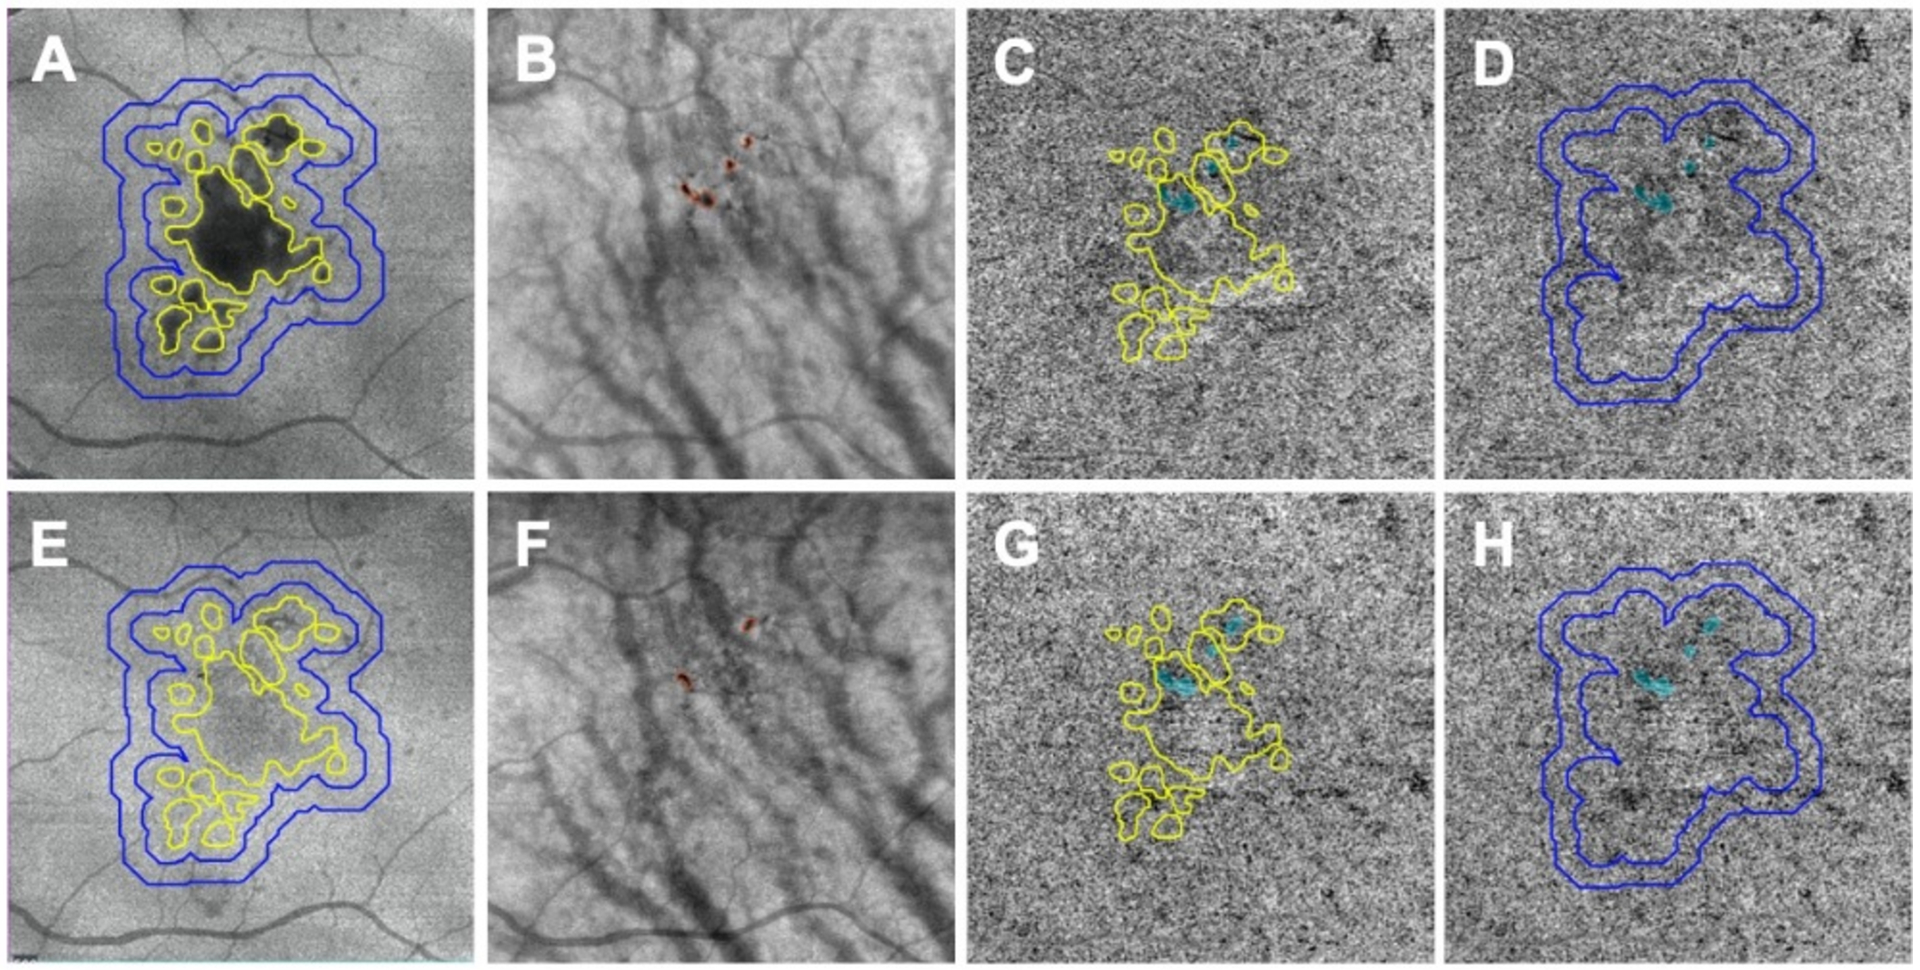
Choriocapillaris (CC) measurements performed in different regions before and after drusen collapse using swept source optical coherence tomography angiography (SS-OCTA). A, B, C, D: images before drusen collapse; E, F, G, H: images after drusen collapse; A, E: Custom en face structural images segmenting between retina pigmentation epithelium (RPE) and Bruch’s membrane (BM) showing drusen. The drusen outline is shown in panel E after the collapse. CC was analyzed in the resolved drusen area depicted by the yellow outlines. CC was also quantified in a 300-micron wide rim area located in a 150– 450 microns rim region outside all the drusen (blue outlines). B, F: Pigmentation (red outlines) showing on custom en face structural images segmented from 64 to 400 microns under BM. C, G: Resolved drusen area depicted as yellow outlines superimposed on compensated CC en face images and used for CC quantification. Blue color highlights the areas of pigmentation that are combined from B and F and excluded from final CC measurements. D, H: The rim region located 150–450 microns outside all the drusen superimposed on the compensated CC en face flow images and used for CC quantification. Blue color highlights the areas of pigmentation combined from B and F and excluded from the final CC quantification.
Another region of interest included the hyper-reflective foci within the retina and foci of hyper-pigmentation of the RPE that cause complete blockage of the incident light, which is appreciated as hypo-transmission defects on the underlying choroid. This blockage of signal cannot be compensated because of the physical loss of signal. Since we were unable to visualize the CC in these areas of hyper-pigmentation, we excluded these regions from the CC analyses. To identify these areas of signal loss, we manually outlined the areas with pigmentation on customized en face structure images from each visit using a slab starting from 64 microns to 400 microns under BM and then the combined areas from these two visits (Figure 5B, 5F) were excluded from the CC quantification at both visits (Figure 5C, 5D, 5G, 5H). Two graders were involved in manually outlining of drusen and areas of pigment and consensus was reached on all outlines. If there was disagreement that could not be resolved, then the dispute was adjudicated by a senior grader (PJR).
Quantitative parameters used to assess FDs in this study includes FD percentage (FD%) and mean flow deficits size (MFDS). FD% was defined as the percentage of pixels representing flow deficits relative to all the pixels in the total analyzed area. MFDS was defined as the average area of individual FDs in the analyzed area.
Statistical analyses were performed using Mat lab (issue R2016b; Math Works, Inc. Natick, Massachusetts). Descriptive statistics were reported as mean SD. Statistical significance of differences between means were assessed with the paired t-test. P values smaller than 0.05 were considered statistically significant.
RESULTS
A total of 128 consecutive eyes with drusen secondary to iAMD were enrolled and followed. Eight eyes from eight patients were found to undergo resolution of drusen without formation of nGA, GA, or exudation. The average age of these patients was 67.9 (SD: 2.5) years and 62.5% of them were women. The average drusen volume at baseline visit was 0.23 mm3 (SD: 0.13). The average drusen volume at the visit when drusen resolved was 0.04 mm3 (SD: 0.03). The average follow-up time from baseline to drusen resolution was 7.8 (SD: 3.8) months with a range from 2.8 months to 14.5 months. After drusen resolution, we kept following these patients for the average of 10.1 months (SD: 8.5) and none of these eyes developed nGA, GA, or exudation.
When using the uncompensated CC FD images before and after drusen resolution and comparing the regions of drusen resolution and the rim regions using the FCM thresholding approach, we found a significant difference in the CC FD measurements (P = 0.001) within the drusen-resolved region, but there was no difference in the rim region (P = 0.890), as shown in Figure 6A. Once the compensation strategy was applied, there were no differences before or after resolution in either drusen-resolved region (P = 0.22) or the rim region (P = 0.70), as shown in Figure 6B and Table 1. Similarly, when these regions were compared before and after drusen resolution using the Phansalkar thresholding strategy, similar results as with the FCM method were obtained, although the absolute values were slightly different (Figure 7, Table 2). Similar outcomes were observed when comparing the CC MFDS measurements as shown in Figures 8 and 9. When either the FCM or Phansalkar thresholding methods were used, the differences between visits in the drusen resolved regions were statistically significant without compensation (P < 0.001 and 0.007, respectively), but when the compensation strategy was used, there were no differences before and after compensation using either thresholding strategy, (P = 0.49 and 0.451, respectively). In the rim regions, there were no differences in the the CC measurements with or without compensation, P > 0.7. Of note, as shown in the Figures 6–9 and Tables 1 and 2, the compensated FD% and the MFDS measurements were larger under the drusen-resolved region compared with the rim regions and these differences were all statistically significant (all P-values < 0.02), which suggests that the CC under drusen was more impaired than the CC in the outside rim region.
Figure 6:
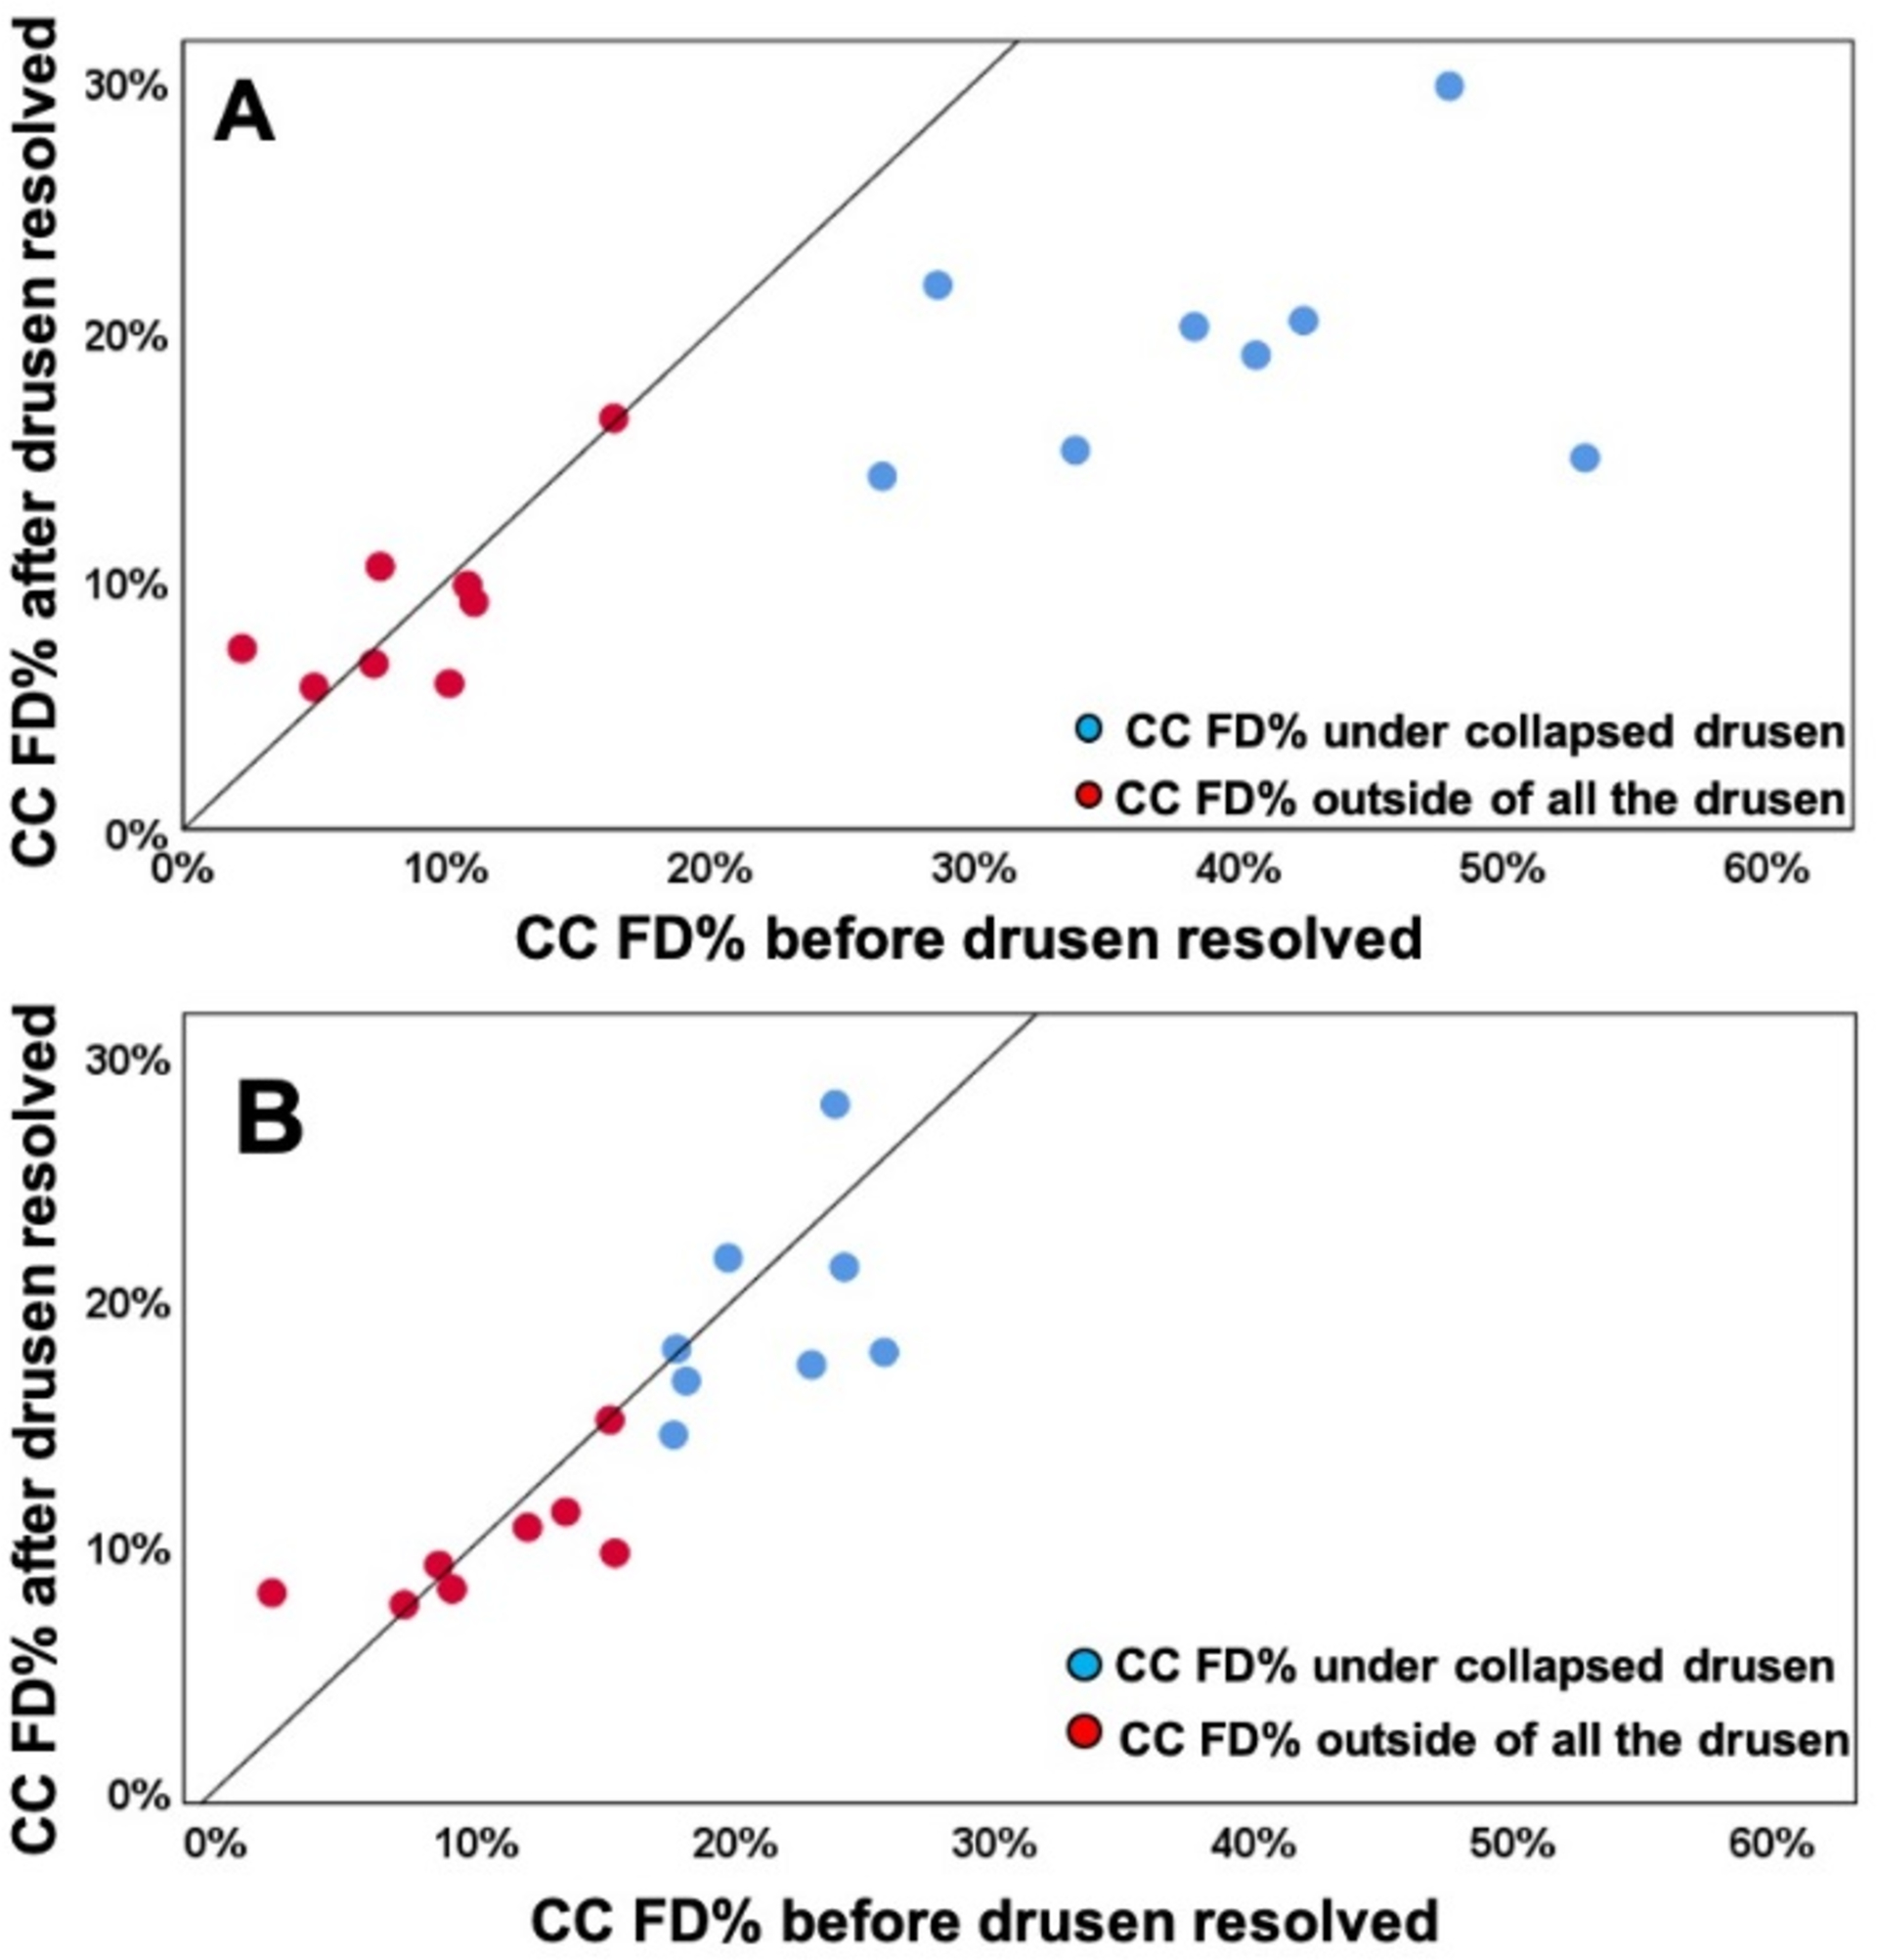
Comparison of choriocapillaris (CC) flow deficit percentages (FD%) in different regions before and after drusen collapse using uncompensated and compensated CC images thresholded using the Fuzzy-C means method (FCM). A: Uncompensated images before and after drusen resolution. A significant difference in the CC FD% was found within the drusen-resolved region (P = 0.001) between two follow up visits while the CC FD measures in rim-region showed no difference (P = 0.890); B: Compensated images before and after drusen resolution. No Significant difference in the CC FD% were found in both drusen-resolved region and rim region, P = 0.22 and 0.7, respectively.
Table 1:
Choriocapillaris flow deficit measurements using compensated images thresholded by the Fuzzy C-means method before and after drusen resolved
| Cases # | FD% at baseline visit | FD% at drusen resolved visit | MFDS at baseline visit | MFDS at drusen resolved visit | ||||
|---|---|---|---|---|---|---|---|---|
| Under resolved drusen | Under rim area outside of drusen | Under resolved drusen | Under rim area outside of drusen | Under resolved drusen | Under rim area outside of drusen | Under resolved drusen | Under rim area outside of drusen | |
| 1 | 19.70% | 15.14% | 21.63% | 15.01% | 0.0232 | 0.0271 | 0.0205 | 0.0237 |
| 2 | 18.08% | 15.34% | 16.61% | 9.59% | 0.0146 | 0.0110 | 0.0113 | 0.0083 |
| 3 | 17.71% | 8.56% | 17.92% | 9.14% | 0.0180 | 0.0117 | 0.0205 | 0.0132 |
| 4 | 26.20% | 7.09% | 15.19% | 7.99% | 0.0249 | 0.0114 | 0.0232 | 0.0134 |
| 5 | 25.24% | 7.33% | 20.37% | 6.77% | 0.0234 | 0.0122 | 0.0284 | 0.0132 |
| 6 | 24.18% | 13.45% | 21.26% | 11.28% | 0.0248 | 0.0167 | 0.0280 | 0.0169 |
| 7 | 17.59% | 1.89% | 14.41% | 7.45% | 0.0274 | 0.0082 | 0.0178 | 0.0133 |
| 8 | 23.83% | 11.96% | 27.90% | 10.62% | 0.0264 | 0.0168 | 0.0253 | 0.0155 |
| 9 | 22.92% | 9.02% | 17.27% | 8.12% | 0.0164 | 0.0142 | 0.0175 | 0.0152 |
Abbreviations: FD%: Flow deficits percentage; MFDS: mean flow deficits size;
Figure 7:
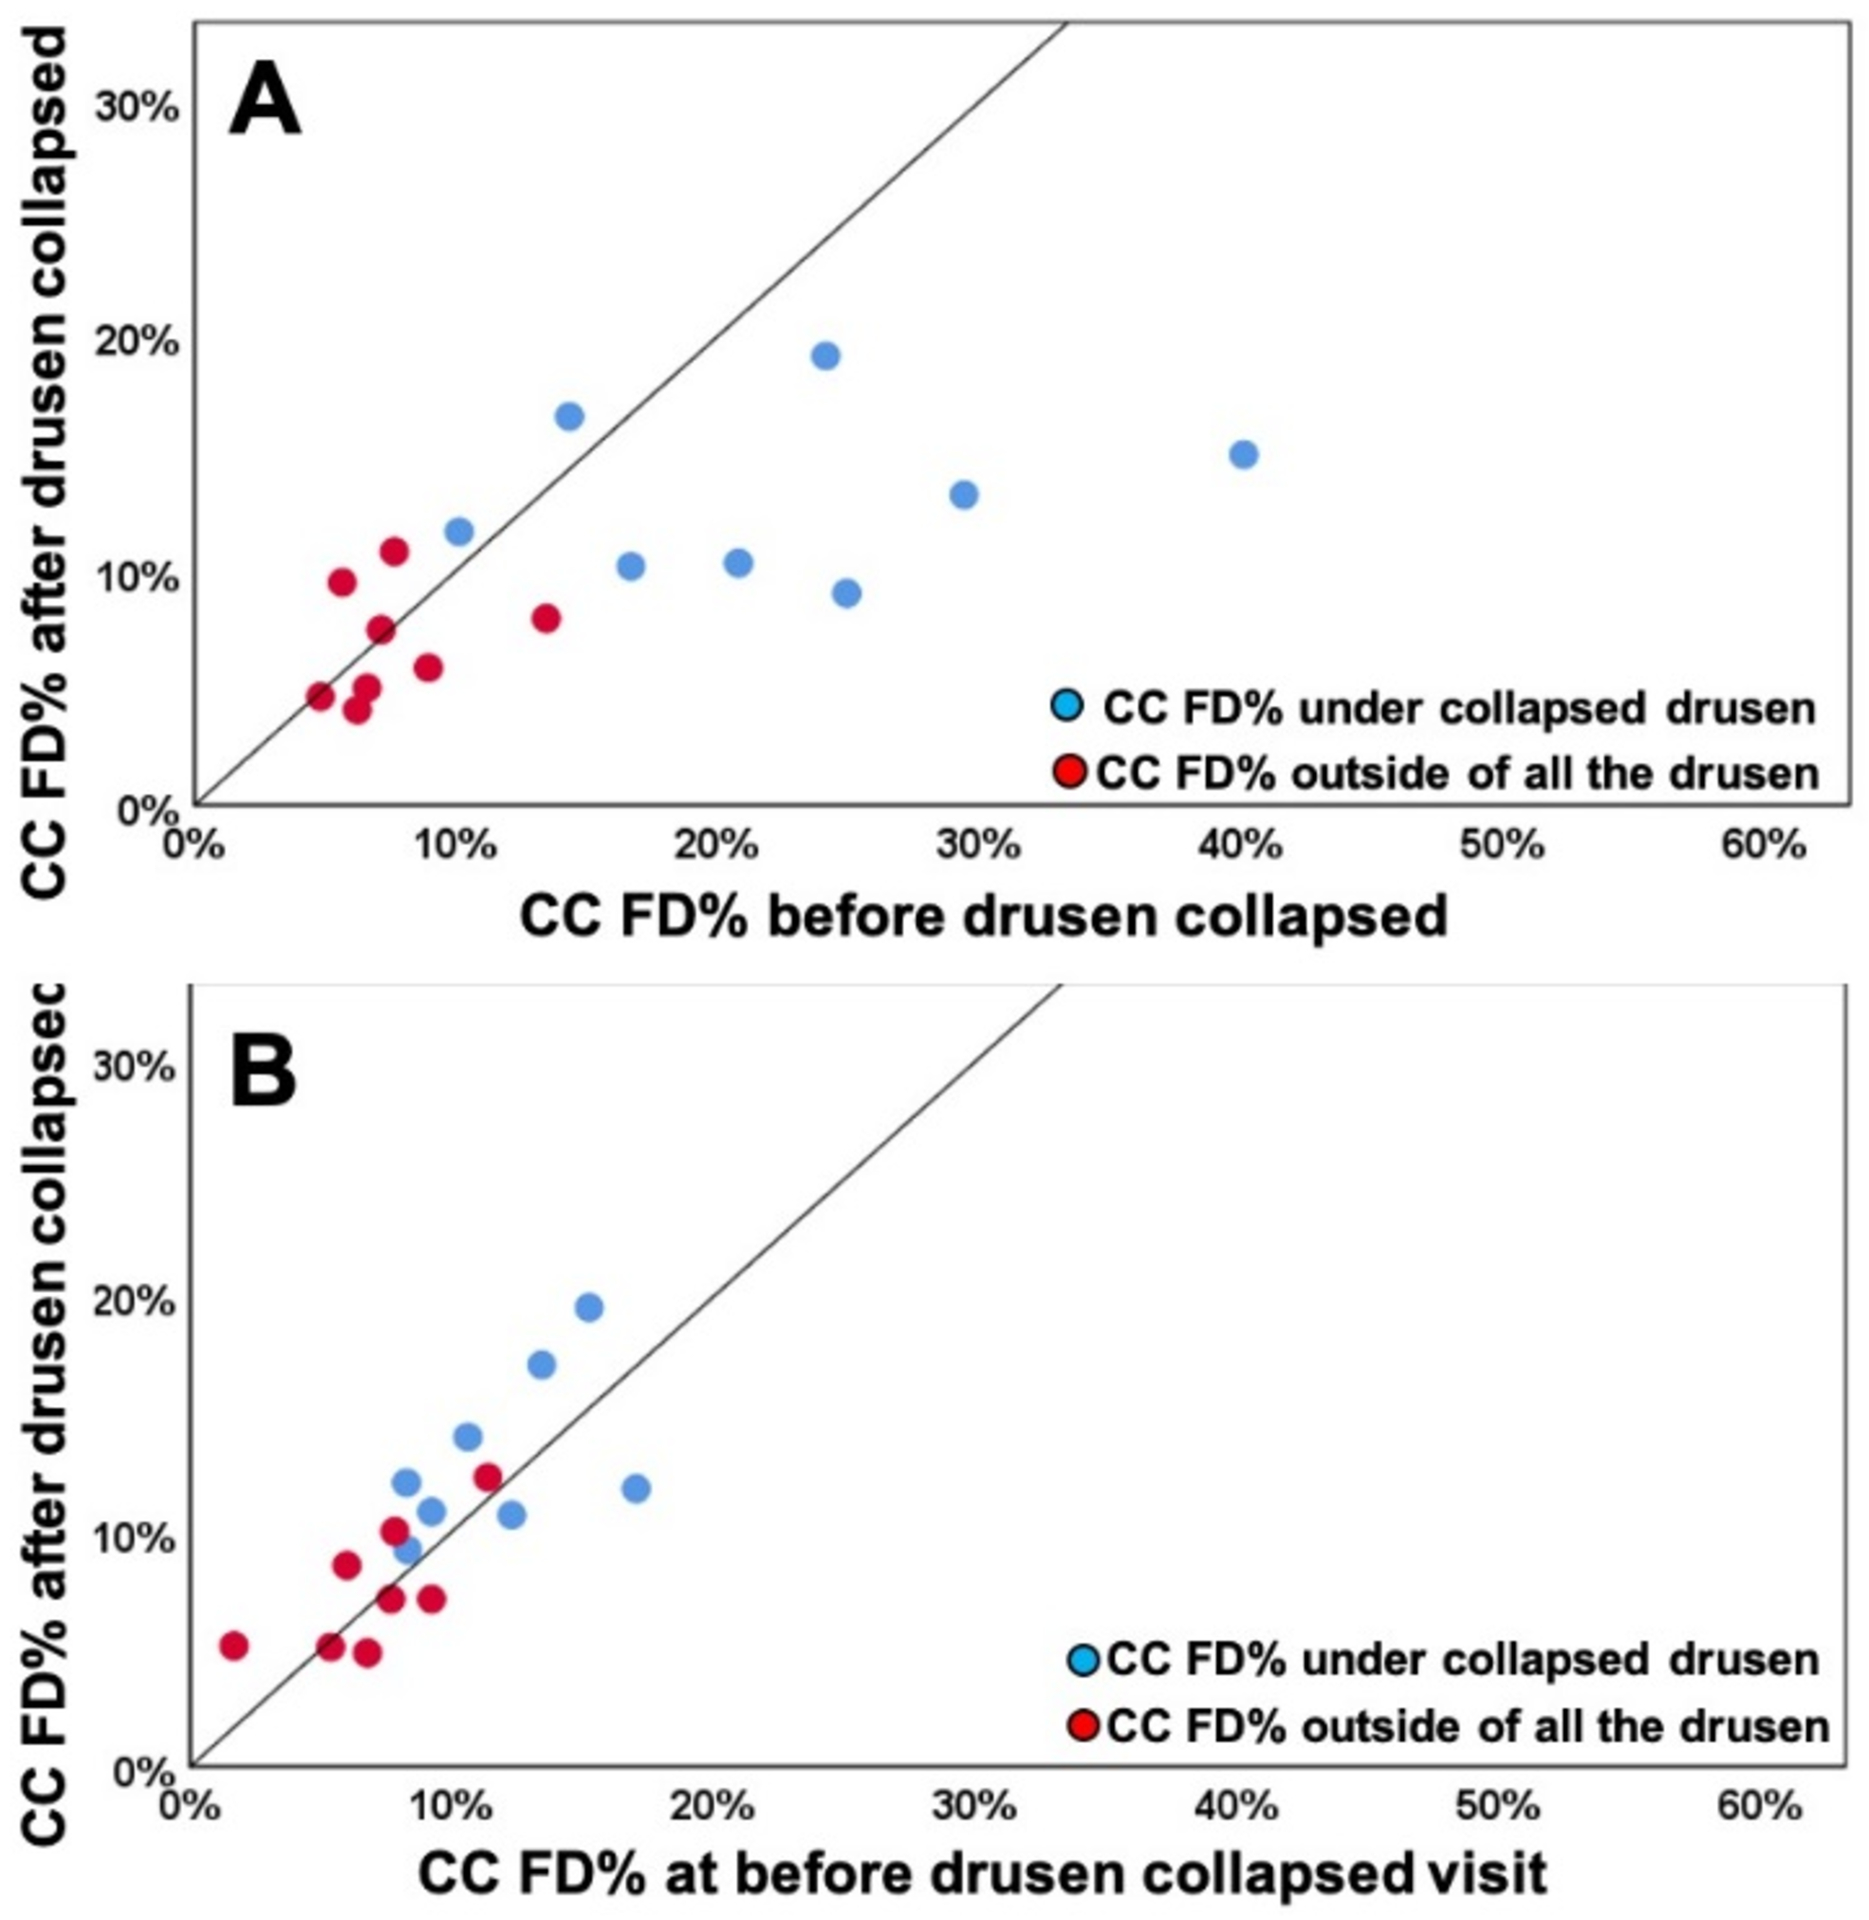
Comparison of choriocapillaris (CC) flow deficit percentages (FD%) in different regions before and after drusen collapse using uncompensated and compensated CC images thresholded using the Phansalkar method with a 3 pixel widow radius. A: Uncompensated images before and after drusen resolution. A significant difference in the CC FD% was found within the drusen-resolved region (P =0.025) between two follow up visits while the CC FD measures in rim-region showed no difference (P = 0.494); B: Compensated images before and after drusen resolution. No Significant difference in the CC FD% were found in both drusen-resolved region and rim region, P = 0.283 and 0.578, respectively.
Table 2:
Choriocapillaris flow deficit measurements using compensated images thresholded by the Phansalkar method before and after drusen resolved
| Cases # | FD% at baseline visit | FD% at drusen resolved visit | MFDS at baseline visit | MFDS at drusen resolved visit | ||||
|---|---|---|---|---|---|---|---|---|
| Under resolved drusen | Under rim area outside of drusen | Under resolved drusen | Under rim area outside of drusen | Under resolved drusen | Under rim area outside of drusen | Under resolved drusen | Under rim area outside of drusen | |
| 1 | 8.25% | 7.81% | 12.05% | 9.98% | 0.0011 | 0.0128 | 0.0094 | 0.0107 |
| 2 | 9.21% | 9.21% | 10.82% | 7.11% | 0.0009 | 0.0081 | 0.0096 | 0.0078 |
| 3 | 10.59% | 5.98% | 14.00% | 8.54% | 0.0010 | 0.0077 | 0.0109 | 0.0085 |
| 4 | 17.50% | 6.60% | 10.05% | 5.06% | 0.0117 | 0.0081 | 0.0127 | 0.0079 |
| 5 | 16.54% | 6.92% | 13.56% | 4.60% | 0.0106 | 0.0084 | 0.0138 | 0.0085 |
| 6 | 15.22% | 11.36% | 19.50% | 12.28% | 0.0110 | 0.0104 | 0.0172 | 0.0126 |
| 7 | 8.30% | 1.67% | 9.20% | 5.12% | 0.0113 | 0.0060 | 0.0102 | 0.0084 |
| 8 | 13.41% | 7.66% | 17.06% | 7.11% | 0.0141 | 0.0096 | 0.0111 | 0.0086 |
| 9 | 12.27% | 5.36% | 10.69% | 5.08% | 0.0089 | 00083 | 0.0105 | 0.0093 |
Abbreviations: FD%: Flow deficits percentage; MFDS: mean flow deficits size;
Figure 8:
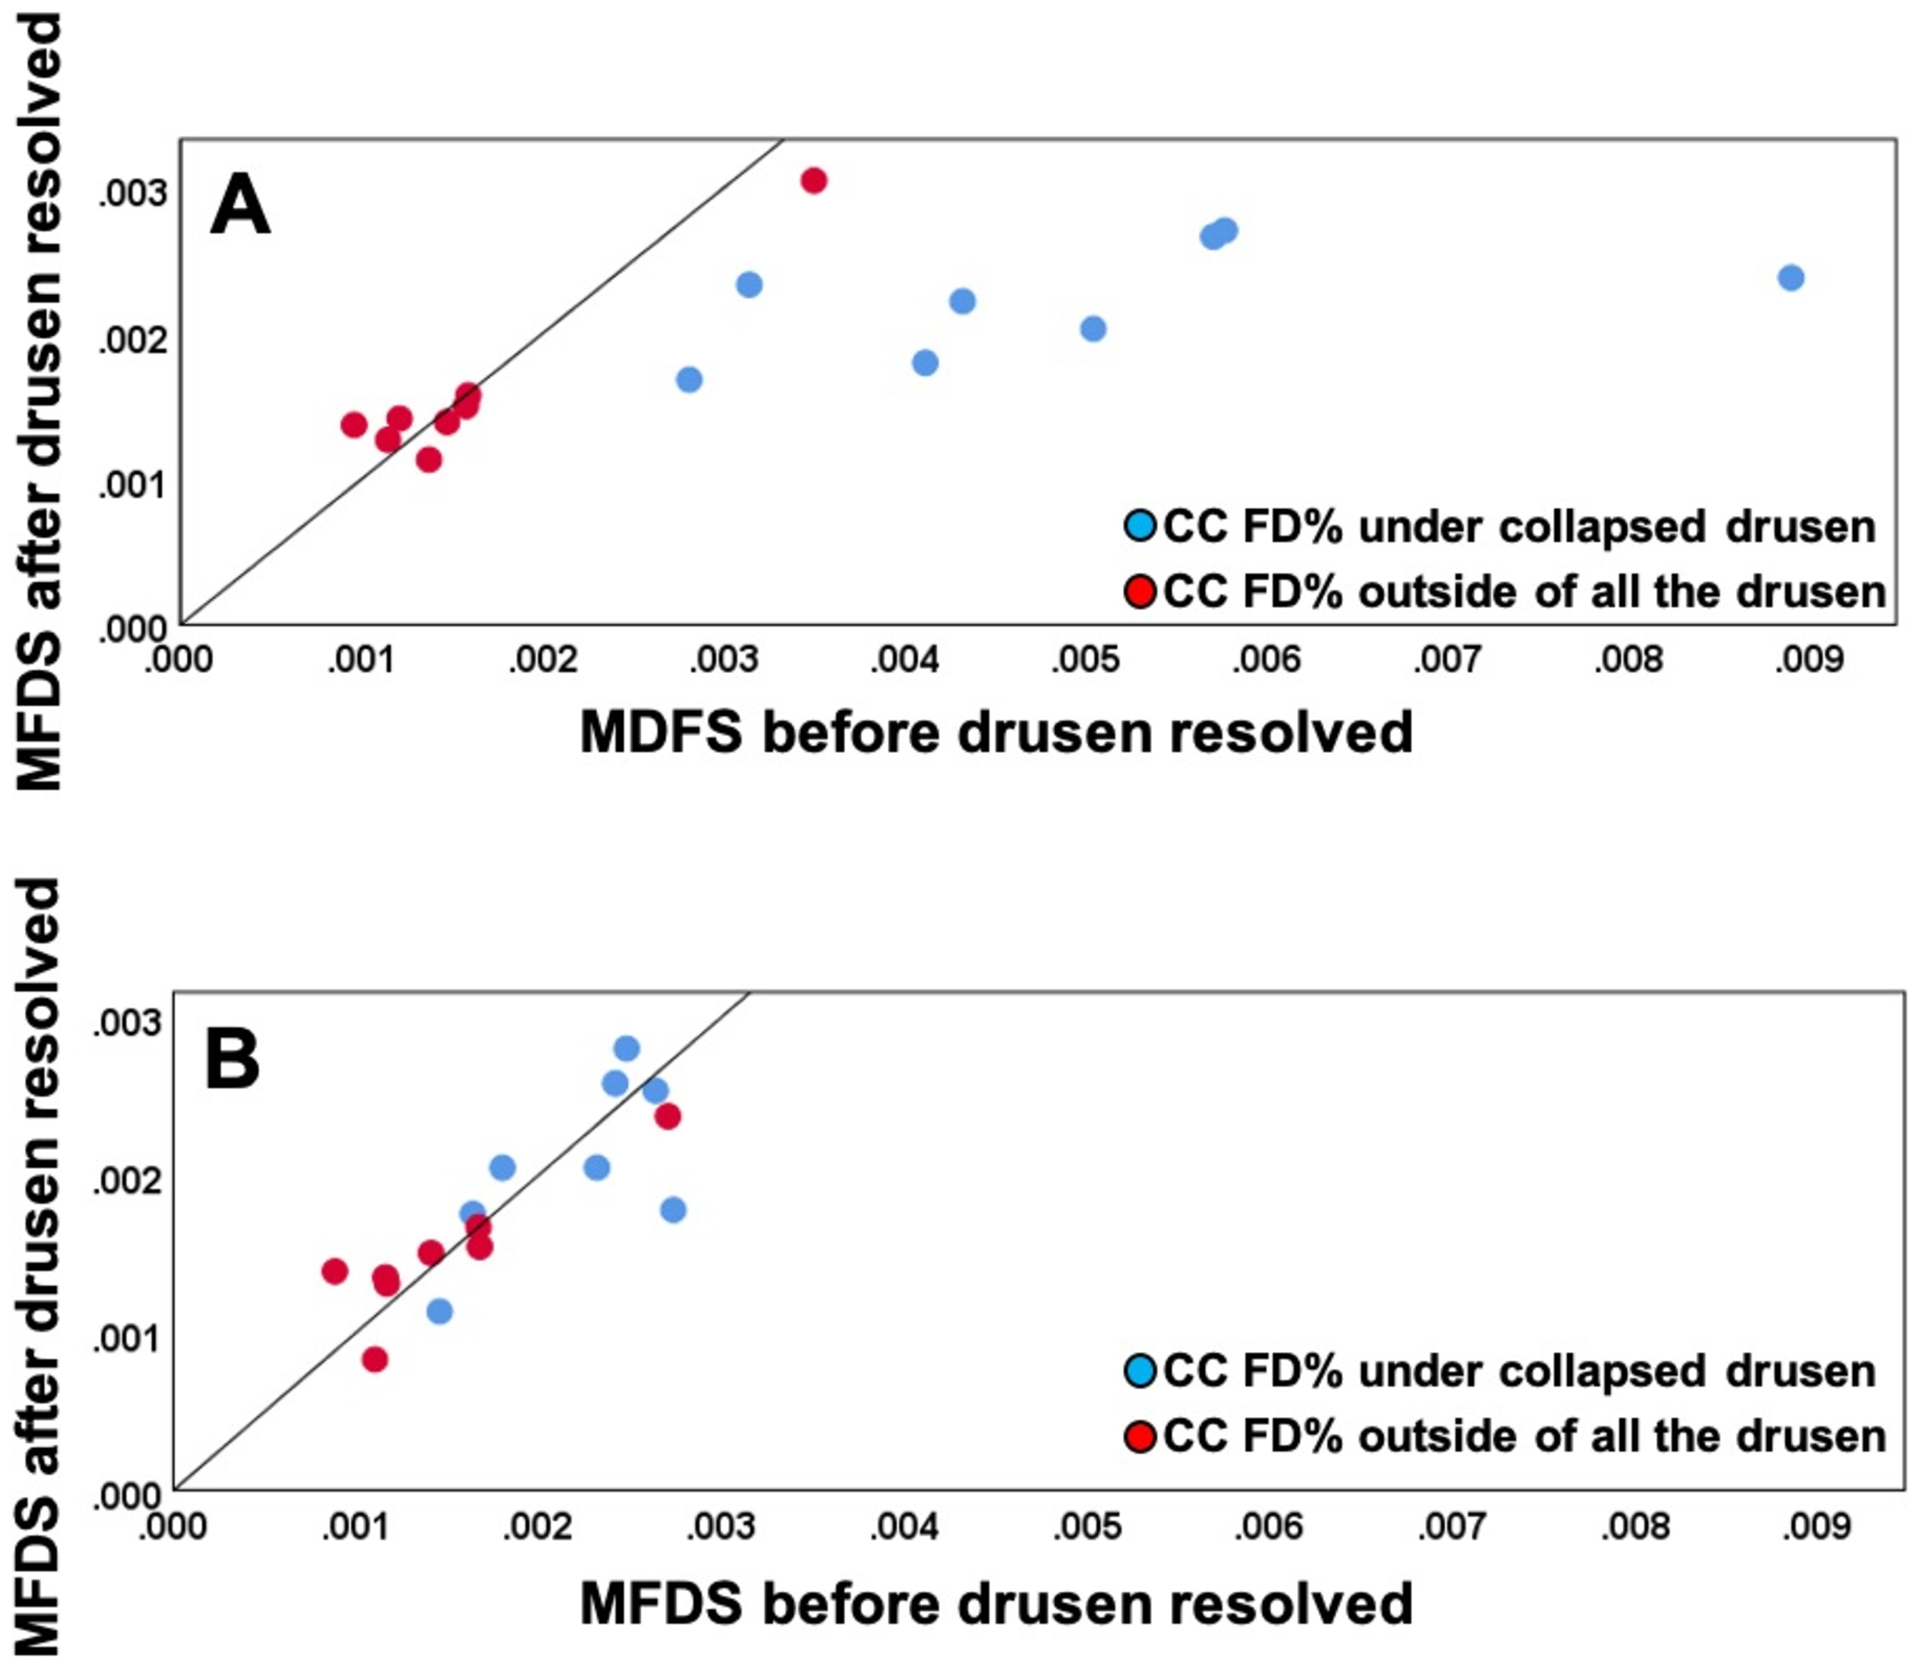
Comparison of choriocapillaris (CC) mean flow deficits size (MFDS) in different regions before and after drusen collapse using uncompensated and compensated CC images thresholded using the Fuzzy-C means method (FCM). A: Uncompensated images before and after drusen resolution. A significant difference in the CC MFDS was found within the drusen-resolved region (P = 0.003) between two follow up visits while the CC MFDS in rim-region showed no difference (P = 0.88); B: Compensated images before and after drusen resolution. No Significant difference in the MFDS measurements were found in both drusen-resolved region and rim region, P = 0.511 and 0.815, respectively.
Figure 9:
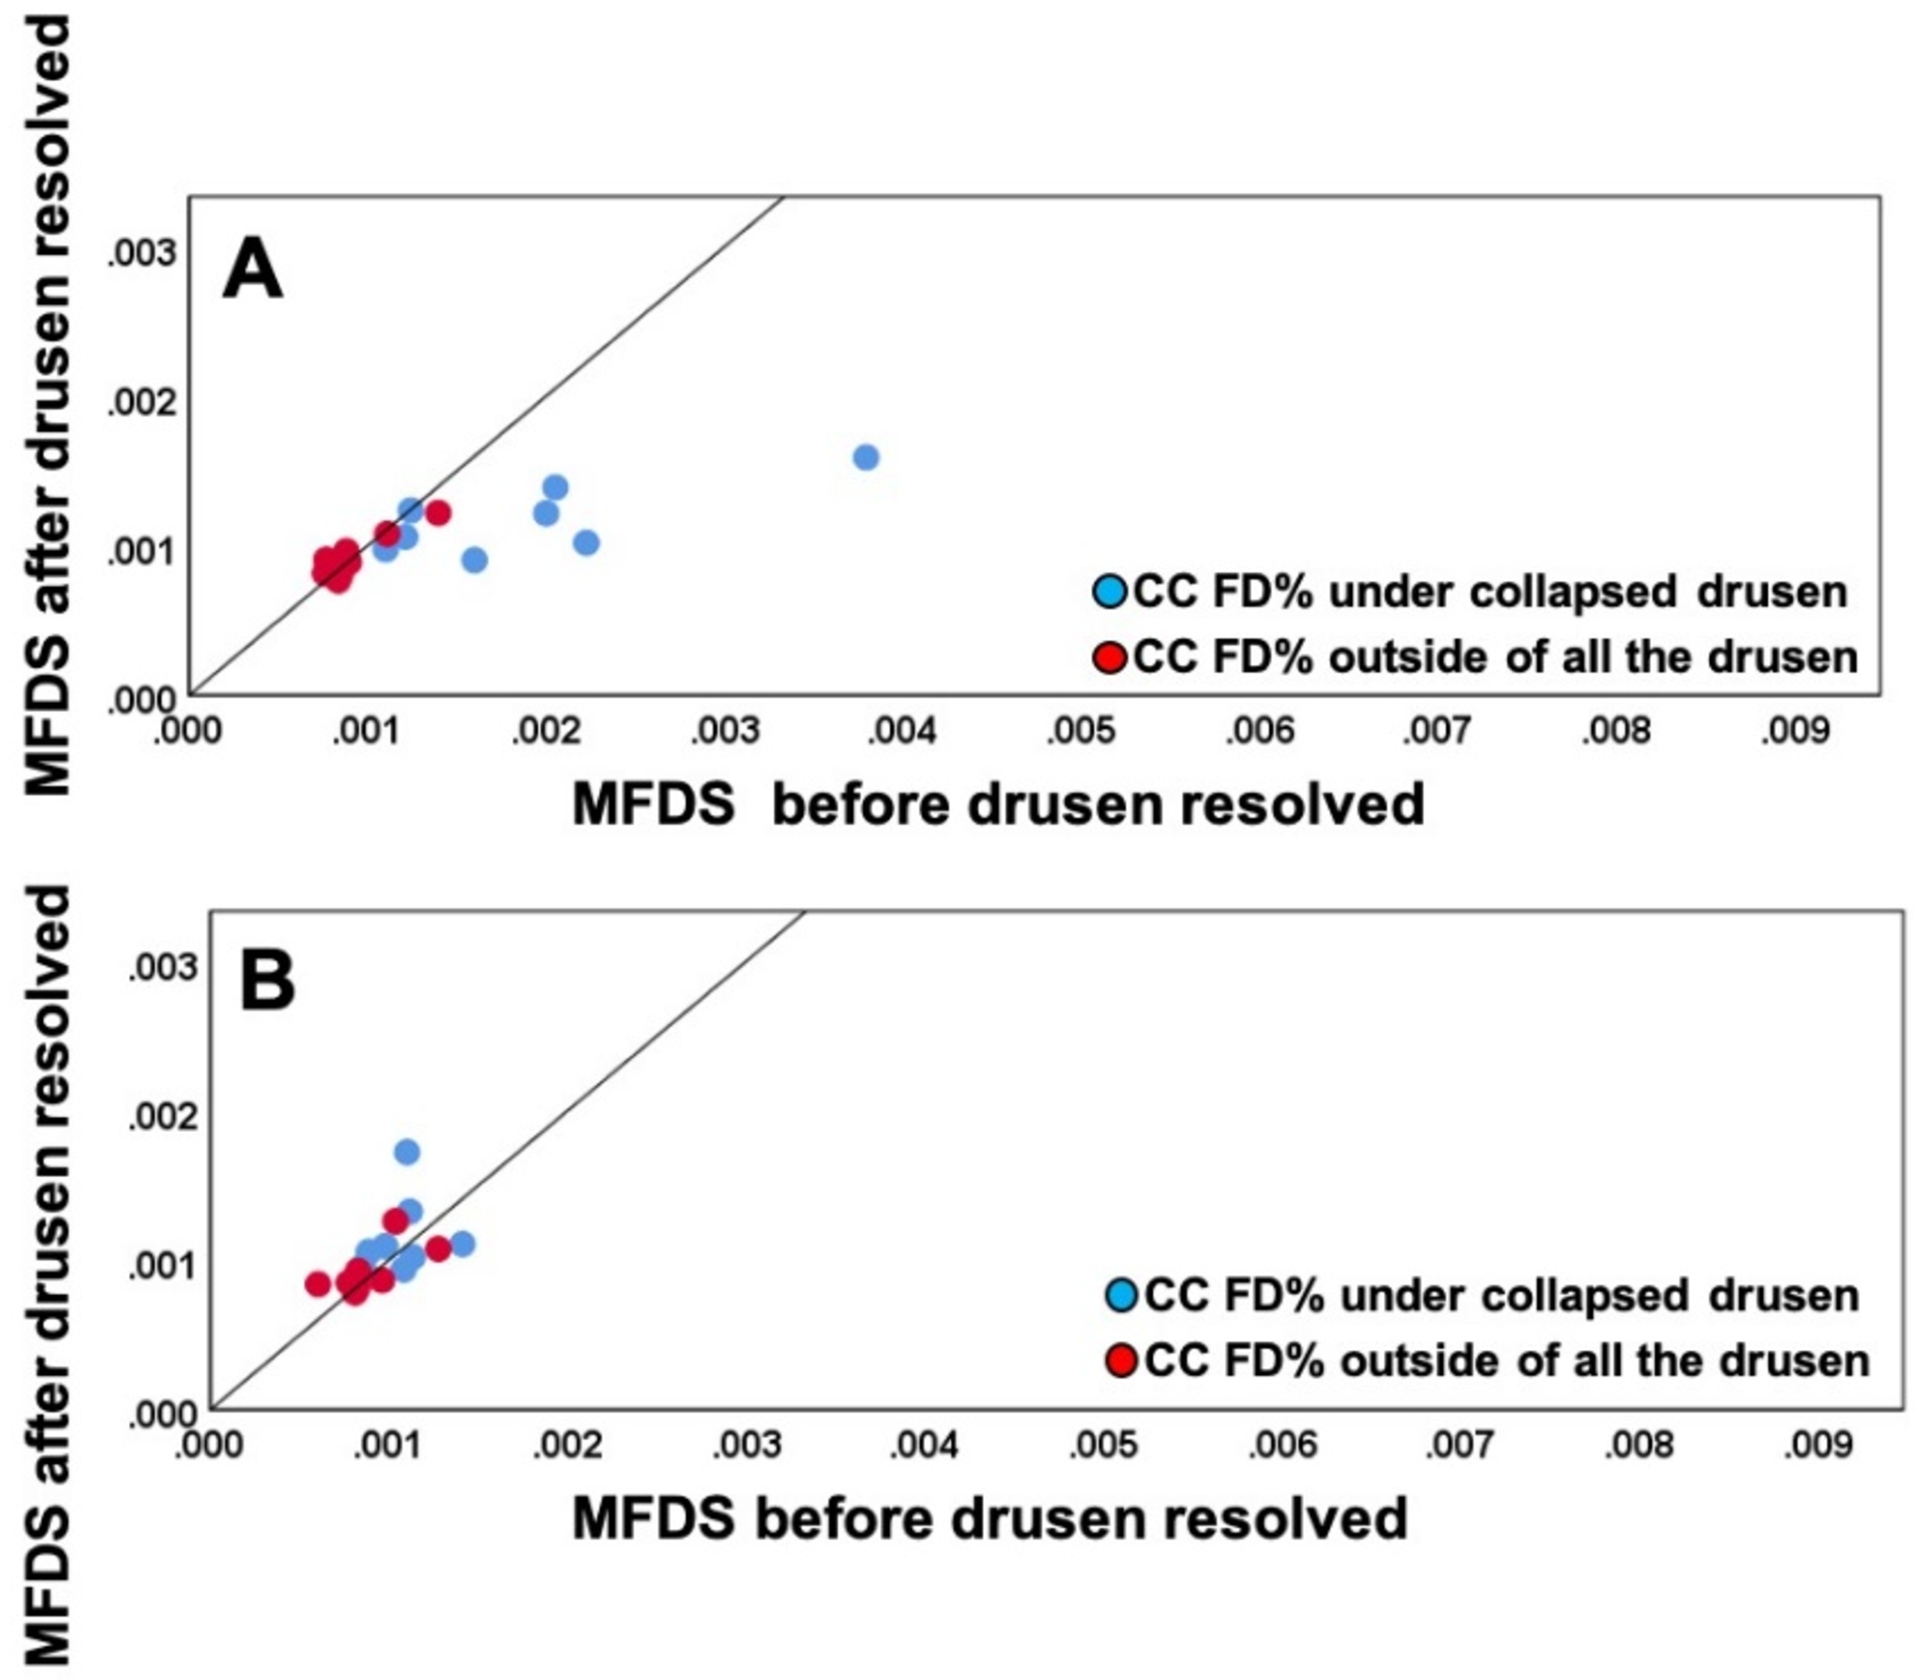
Comparison of choriocapillaris (CC) mean flow deficit size (MFDS) in different regions before and after drusen collapse using uncompensated and compensated CC images thresholded using the Phansalkar method with a 3 pixel widow radius. A: Uncompensated images before and after drusen resolution. A significant difference in the CC MFDS was found within the drusen-resolved region (P =0.024) between two follow up visits while the CC MFDS measurements in rim-region showed no difference (P = 0.863); B: Compensated images before and after drusen resolution. No Significant difference in the CC MFDS measurements were found in both drusen-resolved region and rim region, P = 0.346 and 0.494, respectively.
DISCUSSION
Using a naturally occurring experiment in which drusen were spontaneously resolved, we have been able to show that our strategy to adjust for signal attenuation under drusen adequately compensated for the signal loss and allowed us to visualize and measure the CC FDs under drusen. No significant differences were observed before and after drusen resolution when we used this previously published compensation strategy. Moreover, this compensation strategy had no effect on the rim region outside the drusen, which is consistent with the expected behavior of the algorithm. With the results of this study, we can now follow the natural history of CC FDs in eyes with AMD knowing that our compensation strategy appears to give us reliable information. This will give us confidence in using this compensation strategy when studying the role of CC perfusion abnormalities in AMD disease progression.
We also studied the impact of this compensation strategy on the rim region outside the drusen. In the absence of drusen, the compensation strategy had no effect on the rim region, so the algorithm performed as expected. However, there were statistically significant differences between the CC measurements under the drusen regions compared with the rim regions. These differences between the rim regions and the drusen regions were to be expected based on the topological distribution of CC FD changes expected with age, as previously published.26 Moreover, these results are consistent with both previous histopathological and SS-OCTA studies reporting decreased CC flow measurements under drusen when our compensation strategy was used.12, 14 Whether the preferential loss of CC perfusion under drusen is significantly different from the age-related loss expected in regions with similar topographical distributions in age-matched controls remains to be determined. If drusen are associated with the loss of CC perfusion, then it also remains to be determined if the loss of CC perfusion precedes the formation drusen or whether drusen result in the preferential loss of CC perfusion. While Borelli et al.12 suggest that CC loss precedes the formation of drusen, these authors used a CC slab that was deeper in the choroid than our slab and they used the Phansalkar thresholding strategy with a window radius of 15 pixels, which in our previous work resulted in non-physiologic FD measurements. This type of longitudinal study needs to be repeated using an appropriately positioned CC slab and either the FCM or Phansalkar 3-pixel radius thresholding approach.
In our current report, we not only demonstrated the validity of our compensation strategy, we also demonstrated similar results using either the FCM or Phansalkar thresholding strategies, as long as the window radius for the Phansalkar method was 3-pixels. Previously, Chu et al. compared the FCM and Phansalkar thresholding methods using normal eyes and drusen eyes and they found CC analyses using the FCM method was similar to the CC analyses using the Phansalkar method as long as the window radius was appropriately chosen.41 Unlike many previous studies that chose a default window radius of 15 pixels without any justification,10, 20, 44–49 Chu et al. provided the rationale for choosing a radius dependent on the characteristics of the image, and the radius of 3 pixels chosen for our current study showed results similar to the FCM method and were consistent with their previous study.
While the compensation strategy was successful in adjusting the signal under drusen so that the CC FDs could be adequately measured in these cases, we don’t know the limits of this compensation strategy. At some point, the drusen may be so large that the signal attenuation is too great to compensate. This extreme situation is best demonstrated not by the drusen, but by the presence of pigment clumps or plaques that appear as OCT-defined hyper-reflective material in the retina or at the level of the RPE.50, 51 Both of these types of lesions result in complete blockage of the incident light with distinct areas of hypo-transmission detected in the choroid.51 These areas of hypo-transmission are easily seen on en face choroidal slabs that are segmented under the RPE, similar to the slab used to visualize the hyper-transmission in GA.51 In this current study, we used a custom slab as mentioned in the methods, and we were able to detect any black areas from these en face images that corresponded to the hypo-transmission seen on B-scans (Figure 1E, 1J). Any areas of pigmentation with a greatest linear dimension larger than 125 microns were identified either before or after the drusen resolved, and these combined areas were excluded from the CC analyses since they could not be compensated due to the complete physical loss of choroidal signal.
The limitations of our current study include the small sample size and the variable follow-up. As we previously reported, the small sample size was to be expected given the rarity of drusen resolution without any sequellae, about 4% per year, so the 8 eyes out of 128 cases reviewed is what we would have expected.37 While the follow-up was variable, the visit intervals were close enough together so that we did not observe any significant changes in the control rim region. This rim region not only served as a control for the algorithm but also as a control for possible age-related changes that might have occurred between visits. While another limitation is that we also lacked the in vivo ground truth regarding the status of CC FDs in eyes with drusen, the results in this study are encouraging. As imaging systems and algorithms will improve, the ground truth will emerge.
In summary, this current study showed that our compensation strategy for the attenuated signal under drusen successfully adjusted for the diminished signal arising from the CC as shown by the similar results obtained when these eyes were imaged before and after drusen resolution. We also accumulated additional evidence to support the use of either a global or local thresholding strategy as long as appropriate parameters are chosen for whichever algorithm is used. This knowledge will allow us to apply these strategies in future studies as we investigate the role of CC perfusion deficits in AMD disease progression.
ACKNOWLEDGMENTS/DISCLOSURES:
a. Funding/Support:
Research supported by grants from the National Eye Institute (R01EY024158, R01EY028753), Carl Zeiss Meditec, Inc. (Dublin, CA), the Salah Foundation, an unrestricted grant from the Research to Prevent Blindness, Inc., New York, NY, and the National Eye Institute Center Core Grant (P30EY014801) to the Department of Ophthalmology, University of Miami Miller School of Medicine. The funding organizations had no role in the design or conduct of this research.
b. Financial Disclosures:
Dr. Gregori, Dr. Wang and Dr. Rosenfeld received research support from Carl Zeiss Meditec, Inc. Dr. Gregori and the University of Miami co-own a patent that is licensed to Carl Zeiss Meditec, Inc.
Dr. Rosenfeld also receives research funding from Boehringer-Ingelheim and Stealth Bio Therapeutics. He is also a consultant for Apellis, Boehringer-Ingelheim, Carl Zeiss Meditec, Chengdu Kanghong Biotech, Ocunexus Therapeutics, Genentech, Ocudyne, and Unity Biotechnology. He also has equity interest in Apellis, Verana Health, and Ocudyne.
Dr. Wang discloses intellectual property owned by the Oregon Health and Science University and the University of Washington. Dr. Wang also receives research support from Tasso Inc, Moptim Inc, Colgate Palmolive Company and Facebook technologies LLC. He is a consultant to Insight Photonic Solutions, Kowa, and Carl Zeiss Meditec.
The remaining authors have no disclosures.
ReferENCES
- 1.Nickla DL, Wallman J. The multifunctional choroid. Prog Retin Eye Res 2010;29:144–68. [DOI] [PMC free article] [PubMed] [Google Scholar]
- 2.Ramrattan RS, van der Schaft TL, Mooy CM, de Bruijn WC, Mulder PG, de Jong PT. Morphometric analysis of Bruch’s membrane, the choriocapillaris, and the choroid in aging. Invest Ophthalmol Vis Sci 1994;35:2857–64. [PubMed] [Google Scholar]
- 3.Lengyel I, Tufail A, Hosaini HA, Luthert P, Bird AC, Jeffery G. Association of drusen deposition with choroidal intercapillary pillars in the aging human eye. Invest Ophthalmol Vis Sci 2004;45:2886–92. [DOI] [PubMed] [Google Scholar]
- 4.Mullins RF, Johnson MN, Faidley EA, Skeie JM, Huang J. Choriocapillaris vascular dropout related to density of drusen in human eyes with early age-related macular degeneration. Invest Ophthalmol Vis Sci 2011;52:1606–12. [DOI] [PMC free article] [PubMed] [Google Scholar]
- 5.Biesemeier A, Taubitz T, Julien S, Yoeruek E, Schraermeyer U. Choriocapillaris breakdown precedes retinal degeneration in age-related macular degeneration. Neurobiol Aging 2014;35:2562–2573. [DOI] [PubMed] [Google Scholar]
- 6.Pauleikhoff D, Spital G, Radermacher M, Brumm GA, Lommatzsch A, Bird AC. A fluorescein and indocyanine green angiographic study of choriocapillaris in age-related macular disease. Arch Ophthalmol 1999;117:1353–8. [DOI] [PubMed] [Google Scholar]
- 7.Zheng F, Zhang Q, Shi Y, et al. Age-dependent Changes in the Macular Choriocapillaris of Normal Eyes Imaged With Swept-Source Optical Coherence Tomography Angiography. Am J Ophthalmol 2019;200:110–122;200:110–122. [DOI] [PMC free article] [PubMed] [Google Scholar]
- 8.Shi Y, Zhang Q, Zheng F, et al. Correlations Between Different Choriocapillaris Flow Deficit Parameters in Normal Eyes Using Swept Source OCT Angiography. Am J Ophthalmol 2020;209:18–26. [DOI] [PMC free article] [PubMed] [Google Scholar]
- 9.Thulliez M, Zhang Q, Shi Y, et al. Correlations between Choriocapillaris Flow Deficits around Geographic Atrophy and Enlargement Rates Based on Swept-Source OCT Imaging. Ophthalmol Retina 2019;3:478–488. [DOI] [PMC free article] [PubMed] [Google Scholar]
- 10.Borrelli E, Shi Y, Uji A, et al. Topographic Analysis of the Choriocapillaris in Intermediate Age-related Macular Degeneration. Am J Ophthalmol 2018;196:34–43. [DOI] [PubMed] [Google Scholar]
- 11.Moult EM, Waheed NK, Novais EA, et al. Swept-Source Optical Coherence Tomography Angiography Reveals Choriocapillaris Alterations in Eyes with Nascent Geographic Atrophy and Drusen-Associated Geographic Atrophy. Retina 2016;36 Suppl 1:S2–S11. [DOI] [PMC free article] [PubMed] [Google Scholar]
- 12.Borrelli E, Uji A, Sarraf D, Sadda SR. Alterations in the Choriocapillaris in Intermediate Age-Related Macular Degeneration. Invest Ophthalmol Vis Sci 2017;58:4792–4798. [DOI] [PubMed] [Google Scholar]
- 13.Chatziralli I, Theodossiadis G, Panagiotidis D, Pousoulidi P, Theodossiadis P. Choriocapillaris Vascular Density Changes in Patients with Drusen: Cross-Sectional Study Based on Optical Coherence Tomography Angiography Findings. Ophthalmol Ther 2018;7:101–107. [DOI] [PMC free article] [PubMed] [Google Scholar]
- 14.Vujosevic S, Toma C, Villani E, et al. Quantitative choriocapillaris evaluation in intermediate age-related macular degeneration by swept-source optical coherence tomography angiography. Acta Ophthalmol 2019;97:e919–e926. [DOI] [PubMed] [Google Scholar]
- 15.Choi W, Moult EM, Waheed NK, et al. Ultrahigh-Speed, Swept-Source Optical Coherence Tomography Angiography in Nonexudative Age-Related Macular Degeneration with Geographic Atrophy. Ophthalmology 2015;122:2532–44. [DOI] [PMC free article] [PubMed] [Google Scholar]
- 16.Nassisi M, Tepelus T, Nittala MG, Sadda SR. Choriocapillaris flow impairment predicts the development and enlargement of drusen. Graefes Arch Clin Exp Ophthalmol 2019;257:2079–2085. [DOI] [PubMed] [Google Scholar]
- 17.Al-Sheikh M, Falavarjani KG, Pfau M, Uji A, Le PP, Sadda SR. Quantitative Features of the Choriocapillaris in Healthy Individuals Using Swept-Source Optical Coherence Tomography Angiography. Ophthalmic Surg Lasers Imaging Retina 2017;48:623–631. [DOI] [PubMed] [Google Scholar]
- 18.Choi W, Mohler KJ, Potsaid B, et al. Choriocapillaris and choroidal microvasculature imaging with ultrahigh speed OCT angiography. PLoS One 2013;8:e81499. [DOI] [PMC free article] [PubMed] [Google Scholar]
- 19.Chu Z, Chen CL, Zhang Q, et al. Complex signal-based optical coherence tomography angiography enables in vivo visualization of choriocapillaris in human choroid. J Biomed Opt 2017;22:1–10. [DOI] [PMC free article] [PubMed] [Google Scholar]
- 20.Nassisi M, Baghdasaryan E, Tepelus T, Asanad S, Borrelli E, Sadda SR. Topographic distribution of choriocapillaris flow deficits in healthy eyes. PLoS One 2018;13:e0207638. [DOI] [PMC free article] [PubMed] [Google Scholar]
- 21.Thulliez M Correlations Between Choriocapillaris Flow Deficits Around Geographic Atrophy and Enlargement Rates Based on Swept Source OCT Imaging. J Fr Ophtalmol 2018;41:569–570. [DOI] [PMC free article] [PubMed] [Google Scholar]
- 22.Waheed NK, Moult EM, Fujimoto JG, Rosenfeld PJ. Optical Coherence Tomography Angiography of Dry Age-Related Macular Degeneration. Dev Ophthalmol 2016;56:91–100. [DOI] [PMC free article] [PubMed] [Google Scholar]
- 23.Borrelli E, Mastropasqua R, Senatore A, et al. Impact of Choriocapillaris Flow on Multifocal Electroretinography in Intermediate Age-Related Macular Degeneration Eyes. Invest Ophthalmol Vis Sci 2018;59:AMD25–AMD30. [DOI] [PubMed] [Google Scholar]
- 24.Camino A, Guo Y, You Q, et al. Detecting and measuring areas of choriocapillaris low perfusion in intermediate, non-neovascular age-related macular degeneration. Neurophotonics 2019;6:041108. [DOI] [PMC free article] [PubMed] [Google Scholar]
- 25.Chatziralli I, Theodossiadis G, Panagiotidis D, Pousoulidi P, Theodossiadis P. Choriocapillaris’ alterations in the presence of reticular pseudodrusen compared to drusen: study based on OCTA findings. Int Ophthalmol 2018;38:1887–1893. [DOI] [PubMed] [Google Scholar]
- 26.Zheng F, Zhang Q, Shi Y, et al. Age-Dependent Changes in the Macular Choriocapillaris of Normal Eyes Imaged with Swept-Source OCT Angiography. Am J Ophthalmol 2019;200:110–122. [DOI] [PMC free article] [PubMed] [Google Scholar]
- 27.Lane M, Moult EM, Novais EA, et al. Visualizing the Choriocapillaris Under Drusen: Comparing 1050-nm Swept-Source Versus 840-nm Spectral-Domain Optical Coherence Tomography Angiography. Invest Ophthalmol Vis Sci 2016;57:OCT585–90. [DOI] [PMC free article] [PubMed] [Google Scholar]
- 28.Jonathan E, Enfield J, Leahy MJ. Correlation mapping method for generating microcirculation morphology from optical coherence tomography (OCT) intensity images. J Biophotonics 2011;4:583–7. [DOI] [PubMed] [Google Scholar]
- 29.Mariampillai A, Standish BA, Moriyama EH, et al. Speckle variance detection of microvasculature using swept-source optical coherence tomography. Opt Lett 2008;33:1530–2. [DOI] [PubMed] [Google Scholar]
- 30.An L, Wang RK. In vivo volumetric imaging of vascular perfusion within human retina and choroids with optical micro-angiography. Opt Express 2008;16:11438–52. [DOI] [PubMed] [Google Scholar]
- 31.Fingler J, Schwartz D, Yang C, Fraser SE. Mobility and transverse flow visualization using phase variance contrast with spectral domain optical coherence tomography. Opt Express 2007;15:12636–53. [DOI] [PubMed] [Google Scholar]
- 32.Kurokawa K, Sasaki K, Makita S, Hong YJ, Yasuno Y. Three-dimensional retinal and choroidal capillary imaging by power Doppler optical coherence angiography with adaptive optics. Opt Express 2012;20:22796–812. [DOI] [PubMed] [Google Scholar]
- 33.Makita S, Jaillon F, Yamanari M, Miura M, Yasuno Y. Comprehensive in vivo micro-vascular imaging of the human eye by dual-beam-scan Doppler optical coherence angiography. Opt Express 2011;19:1271–83. [DOI] [PubMed] [Google Scholar]
- 34.Yu L, Chen Z. Doppler variance imaging for three-dimensional retina and choroid angiography. J Biomed Opt 2010;15:016029. [DOI] [PMC free article] [PubMed] [Google Scholar]
- 35.Sacconi R, Borrelli E, Corbelli E, et al. Quantitative changes in the ageing choriocapillaris as measured by swept source optical coherence tomography angiography. Br J Ophthalmol 2019;103:1320–1326. [DOI] [PubMed] [Google Scholar]
- 36.Zhang Q, Zheng F, Motulsky EH, et al. A Novel Strategy for Quantifying Choriocapillaris Flow Voids Using Swept-Source OCT Angiography. Invest Ophthalmol Vis Sci 2018;59:203–211. [DOI] [PMC free article] [PubMed] [Google Scholar]
- 37.Yehoshua Z, Wang F, Rosenfeld PJ, Penha FM, Feuer WJ, Gregori G. Natural history of drusen morphology in age-related macular degeneration using spectral domain optical coherence tomography. Ophthalmology 2011;118:2434–41. [DOI] [PMC free article] [PubMed] [Google Scholar]
- 38.Sadda SR, Guymer R, Holz FG, et al. Consensus Definition for Atrophy Associated with Age-Related Macular Degeneration on OCT: Classification of Atrophy Report 3. Ophthalmology 2018;125:537–548. [DOI] [PMC free article] [PubMed] [Google Scholar]
- 39.Zhang Q, Zhang A, Lee CS, et al. Projection artifact removal improves visualization and quantitation of macular neovascularization imaged by optical coherence tomography angiography. Ophthalmol Retina 2017;1:124–136. [DOI] [PMC free article] [PubMed] [Google Scholar]
- 40.Wang RK, An L, Francis P, Wilson DJ. Depth-resolved imaging of capillary networks in retina and choroid using ultrahigh sensitive optical microangiography. Opt Lett 2010;35:1467–9. [DOI] [PMC free article] [PubMed] [Google Scholar]
- 41.Chu Z, Gregori G, Rosenfeld PJ, Wang RK. Quantification of Choriocapillaris with Optical Coherence Tomography Angiography: A Comparison Study. Am J Ophthalmol 2019;208:111–123. [DOI] [PMC free article] [PubMed] [Google Scholar]
- 42.Zhang A, Zhang Q, Wang RK. Minimizing projection artifacts for accurate presentation of choroidal neovascularization in OCT micro-angiography. Biomed Opt Express 2015;6:4130–43. [DOI] [PMC free article] [PubMed] [Google Scholar]
- 43.Zhang Q, Shi Y, Zhou H, et al. Accurate estimation of choriocapillaris flow deficits beyond normal intercapillary spacing with swept source OCT angiography. Quant Imaging Med Surg 2018;8:658–666. [DOI] [PMC free article] [PubMed] [Google Scholar]
- 44.Chu Z, Zhou H, Cheng Y, Zhang Q, Wang RK. Improving visualization and quantitative assessment of choriocapillaris with swept source OCTA through registration and averaging applicable to clinical systems. Sci Rep 2018;8:16826. [DOI] [PMC free article] [PubMed] [Google Scholar]
- 45.Spaide RF. Choriocapillaris Flow Features Follow a Power Law Distribution: Implications for Characterization and Mechanisms of Disease Progression. Am J Ophthalmol 2016;170:58–67. [DOI] [PubMed] [Google Scholar]
- 46.Borrelli E, Souied EH, Freund KB, et al. Reduced Choriocapillaris Flow in Eyes with Type 3 Neovascularization and Age-Related Macular Degeneration. Retina 2018;38:1968–1976. [DOI] [PubMed] [Google Scholar]
- 47.Uji A, Balasubramanian S, Lei J, Baghdasaryan E, Al-Sheikh M, Sadda SR. Choriocapillaris Imaging Using Multiple En Face Optical Coherence Tomography Angiography Image Averaging. JAMA Ophthalmol 2017;135:1197–1204. [DOI] [PMC free article] [PubMed] [Google Scholar]
- 48.Spaide RF. Choriocapillaris Signal Voids in Maternally Inherited Diabetes and Deafness and in Pseudoxanthoma Elasticum. Retina 2017;37:2008–2014. [DOI] [PubMed] [Google Scholar]
- 49.Rochepeau C, Kodjikian L, Garcia MA, Mathis T. Optical Coherence Tomography Angiography Quantitative Assessment of Choriocapillaris Blood Flow in Central Serous Chorioretinopathy. Am J Ophthalmol 2019;201:82–83. [DOI] [PubMed] [Google Scholar]
- 50.Lujan BJ, Rosenfeld PJ, Gregori G, et al. Spectral domain optical coherence tomographic imaging of geographic atrophy. Ophthalmic Surg Lasers Imaging 2009;40:96–101. [DOI] [PubMed] [Google Scholar]
- 51.Guymer RH, Rosenfeld PJ, Curcio CA, et al. Incomplete Retinal Pigment Epithelial and Outer Retinal Atrophy in Age-Related Macular Degeneration: Classification of Atrophy Meeting Report 4. Ophthalmology 2020;127:394–409. [DOI] [PMC free article] [PubMed] [Google Scholar]


