

Abstract
Background:
Minimal residual disease (MRD) in B lymphoblastic leukemia (B-ALL) by flow cytometry is an established prognostic factor used to adjust treatment in most pediatric therapeutic protocols. MRD in B-ALL has been standardized by the Children’s Oncology Group (COG) in North America, but not routine clinical labs. The Foundation for National Institutes of Health sought to harmonize MRD measurement among COG, oncology groups, academic, community and government, laboratories.
Methods:
Listmode data from post-induction marrows were distributed from a reference lab to seven different clinical FCM labs with variable experience in B-ALL MRD. Labs were provided with the COG protocol. Files from 15 cases were distributed to the seven labs. Educational sessions were implemented, and 10 more listmode file cases analyzed.
Results:
Among 105 initial challenges, the overall discordance rate was 26%. In the final round, performance improved considerably; out of 70 challenges, there were five false positives and one false negative (9% discordance), and no quantitative discordance. Four of six deviations occurred in a single lab. Three samples with hematogones were still misclassified as MRD.
Conclusions:
Despite the provision of the COG standardized analysis protocol, even experienced laboratories require an educational component for B-ALL MRD analysis by FCM. Recognition of hematogones remains challenging for some labs when using the COG protocol. The results from this study suggest that dissemination of MRD testing to other North American laboratories as part of routine clinical management of B-ALL is possible but requires additional educational components to complement standardized methodology.
Keywords: minimal residual disease
The presence of MRD after induction therapy as detected by flow cytometry (FCM) is an important prognostic factor in several hematological malignancies including multiple myeloma, chronic lymphocytic leukemia, acute myeloid and acute lymphoblastic leukemia (ALL) (1–9). Most clinical trials in North America have used either one or small numbers of specialized reference laboratories to conduct these studies (2,10–16). However, as the clinical need for these measures has become more important for the routine management of patients with these diseases, there is a recognized need to ensure that all laboratories involved in testing of these patients can reproducibly detect small populations of leukemic cells.
Given the need for increased numbers of testing centers in North America and a need for higher concordance between laboratories, a group of 4 then eight laboratories in North America (1 reference laboratory and 7 other centers) were selected under the auspices of the Foundation for the National Institutes of Health (FNIH) to participate in a study to assess a quality assurance program aimed at improving concordance rates. This study was subdivided into 3 phases with goals within each phase. Phase 1 was to determine the feasibility of using spiked samples from one laboratory, in a pilot study. Challenges contained; normal, regenerating, and B-Cell ALL disease containing bone marrows with various levels of residual disease. The second and third phase of this study was an expansion of the initial study to 8 laboratories (one reference and seven participating) with an educational component after each round of analysis throughout the second phase of testing to address any patterns in discordance observed. These laboratories included in addition to the reference laboratory, the other reference center for Cooperative Oncology Group (COG) trials and six centers with child and adult oncology programs with a mixture of academic and regional hospitals. The six additional laboratories were self-identified as having experience in MRD detection in B-ALL, however many had experience in adult oncology programs and not pediatric cases.
The data in this study demonstrate that the COG protocol can be used in multi-centered trials and that concordance in MRD assessment by (FCM) is achievable. However, this study identifies multiple areas that, even in experienced labs, required rounds of education and re-training before they were minimized as sources of discrepancy. These efforts highlight areas that will likely need to be dealt with by any program seeking to perform such analysis.
MATERIALS AND METHODS
Sites
This study started in 2015 between the following 8 centers; University of Washington (reference), Johns Hopkins Medical Institutions, Hartford Hospital, Hartford, National Cancer Institute, Montefiore Medical Center, Ohio State University, Vanderbilt University Medical Center, and London Health Sciences Centre, Canada.
The one reference site and seven participating sites selected included five using Becton Dickinson (Becton Dickinson, NJ: Franklin Lakes, NJ) and two using Beckman Coulter instruments (Beckman Coulter, Hialeah Florida, FL) There was no requirement to use specific software; those used included those accompanying the instruments (Diva™ for BD©; CXP Navios software™, or Kaluza™ for BC) or various third party (FCSExpress™ or WinList™) or homegrown (“Woodlist”) products. However, standardized instructions were given for instrument setup (only required for wet samples which are not presented in this study) and sample analysis (For full method see supplemental material).
Protocol
We chose to implement the 6-color COG protocol in this study, due to its well-established clinical utility and the presence of two COG reference labs that are extremely experienced in its use and were able to serve as reference and as educators for the other labs. In Phase 1 the two non-COG reference labs used their own laboratory developed tests (LDTs) to test for MRD. Subsequent to this the protocol selected for standardized testing was the one developed by the COG to determine risk assignment based on MRD results in Day 29 bone marrow (2,10) in large part because it has shown continued prognostic significance in a large number of patients (>10,000). Furthermore, it been used for 12 years by two reference laboratories in several large North American clinical trials that have shown the prognostic significance of MRD testing. Moreover, this method was shown to have excellent concordance between the two sites (17); after thorough review of a pre-Investigational Device Exemption application the FDA approved the procedure for use in the clinical trial. More sophisticated (FCM) 8 color cocktails are currently under evaluation however as clinical data is available to support the use of the 6 color combination; this study used the COG method as a starting point for comparison of new combinations. Although these are 6 color tubes they are sufficient to assess MRD levels in approximately 95% of samples (17). In addition, the six-color panel (albeit very simplistic in the light of routine clinical 10 color analysis) used in this protocol is configured so that it is agnostic to instrument or reagent manufacturers.
COG Antibody Panel
The COG protocol employs three tubes (2,10):
Tube 1 CD20FITC/CD10PE/CD38PerCPCy5.5/CD19PC7/CD58APC/CD45APCH7
Tube 2 CD9FITC/CD13 + 33PE/CD34PerCPCy5.5/CD19PC7/CD10APC/CD45APCH7
-
Tube 3 Syto16*/CD3PerCPCy5.5/CD19PC7/CD45APCH7
Specific clones and supplier information can be found in Table 1
*Vital dye stains all nucleated cells, (excitation/emission 488/518 nm).
Table 1.
Antibody Clones and Suppliers
| Tube | Manufacturer | Antibody | Fluorochrome | Clone |
|---|---|---|---|---|
| Tube 1 | BD Biosciences | CD20 | FITC | L27 |
| BD Biosciences | CD10 | PE | HI10A | |
| BD Biosciences | CD38 | PerCp Cy 5.5 | HIT2 | |
| Beckman Coulter | CD58 | APC | AICD58 | |
| Tube 2 | BD Biosciences | CD9 | FITC | M-L13 |
| BD Biosciences | CD13 | PE | L138 | |
| BD Biosciences | CD33 | PE | P67.6 | |
| BD Biosciences | CD34 | PerCp Cy 5.5 | 8G12 | |
| BD Biosciences | CD10 | APC | HI10A | |
| Tube 3 | BD Biosciences | CD3 | PerCp Cy 5.5 | SK7 |
| BD Biosciences | CD71 | APC | L01.1 | |
| Common | Manufacturer | Antibody | Fluorochrome | |
| 1,2,3 | Beckman Coulter | CD19 | PE-Cy7 | J3–119 |
| 1,2,3 | BD Biosciences | CD45 | APC-H7 | 2D1 |
This panel had previously been optimized to reduce the effect of overlapping spectral emission on detection sensitivity by keeping fluorochromes with the highest emission for key antigens or antigens with low numbers of surface receptors (18) and avoiding compromising detection of weak antigens by avoiding the effects of spillover from highly expressed markers. In addition, all clones were extensively studied for specificity for the target antigen and fluorochromes chosen for their stabil-ity in tandem form.
Samples
Post induction bone marrow samples were collected from patients enrolled in COG clinical trials and sent to the west coast reference laboratory. In total 35 samples were used in this study; 10 samples in Phase 1, 15 samples in Phase 2, and 10 samples in Phase 3. Specimens contained a mixture of MRD negative (n = 13) and MRD positive (n = 22) at various levels (0.02–2.30%) as reported by the reference laboratory.
Sample Preparation
For sample preparation performed at the reference laboratory, white blood cells were normalized to a count of 15–20 × 109/L and 100 μL added to a premixed cocktail of antibodies (titrations previously determined). Samples were stained for 15 min and then lysed with 2 mL ammonium chloride containing 0.25% formaldehyde for 10 min at room temperature followed by two washes with phosphate buffered saline (PBS) containing 0.3% bovine serum albumin. Samples were re-suspended in 0.5 mL of PBS and stored protected from light until analyzed on the flow cytometer. It should be noted that for Phases 2 and 3 of this study COG sample preparation was performed at only the one reference site. LDT sample preparation for Phase 1 of this QA study was not disclosed by the two non-COG centers.
Specimen Analysis
The first two tubes are used to identify the maturation sequence of normal B cells and allow the detection of “difference from normal” by either the presence or absence of an antigen or over/under expression (10). A minimum of 50 clustered events were required to accurately enumerate any MRD population within a sample. The gating strategy involves collecting time as a parameter to allow exclusion of data that may have compromise the analysis, for example if the sample runs dry. Next doublets are excluded on a plot of forward scatter area versus forward scatter peak. A dotplot of CD19 versus side scatter allows selection of CD19+ events and this can be confirmed on a plot of CD19 versus CD45. Pairwise two dimensional dotplots are used to determine normal/reactive from abnormal. The third tube is used to determine the denominator used to calculate the percentage MRD, and uses the vital dye Syto-16 to identify all nucleated cells in the bone marrow, including nucleated red blood cells (19). The denominator used is mononuclear cells, defined as Syto-16 positive, with low side scatter on a CD45 versus side scatter plot after exclusion of the granulocytes as shown in the method (supplementary material). After each round, a teleconference was held, allowing the reference laboratory to present a detailed analysis of each case (as an educational component), with discussion from all participants to clarify the rationale for gating specific populations.
MRD Calculation
Calculation of the percentage of minimal residual disease as determined from Tube 1 or Tube 2 cross multiplied by the numbers from Tube 3 which determines the number of mononuclear cells including nucleated red blood cells.
Phase 1: Initial Assessment
An initial assessment of MRD testing consisted of 10 samples of leukemic blasts spiked into normal marrow as prepared by the reference laboratory and sent to the other COG reference lab and two adult Cooperative Group reference laboratories, who used their own LDTs to assess MRD. Two samples were negative (Samples 5 and 8) either with or without normal B precursors, and the other samples were positive in various amounts, again with some samples including normal precursors.
Phase 2
De-identified listmode files that could be analyzed by any software package were prepared by the reference lab. In the first stage, three rounds of these “dry” challenges were distributed, each containing five Day-29 MRD cases with three files per case accompanied by two diagnostic files per case. These first three rounds were educational, and deliberately challenging, to expose the participants to unusual cases that could be seen in clinical samples, including arrested hematogones, up regulation or down regulation of CD markers, and impact of specimen age on staining of the normal and abnormal populations.
Phase 3
Following the initial set of challenges and educational feedback to the sites, two additional rounds of dry challenges with five files per case (three files per case accompanied by two diagnostic files per case) were performed, to assess improvement in each laboratory’s ability to correctly identify regenerating marrows and clearly differentiate negative from positive cases.
Listmode data were analyzed according to a standard template provided to all participants, which included formulas for calculation. Data that included values for populations used in intermediate steps in the calculation, along with final calculated values for MRD, were submitted to a central repository and analyzed by a third party at FNIH.
Statistical Analysis
Concordance was defined as within a ½ log from the reference MRD % for both wet and dry challenges.
RESULTS
The initial assessment (Phase 1) using only four laboratories (Fig. 1) showed an overall 73% concordance of results among two COG and two adult Cooperative Group reference laboratories who used their own LDTs, although the two COG laboratories were much more concordant (Fig. 1B,D). Two samples were negative (Samples 5 and 8) and Sample 1 was positive but at <0.1%. Labs A, B, and C were concordant in 70%, 90%, and 40% of samples, respectively, when compared with Lab D. It should be noted that samples 2 and 9 showed some discordance between the two reference laboratories. Both samples do cross a lines delineating a change from one log to another (the 1% and 0.1% disease lines respectively), however Sample 9 was within the 0.5 log difference allowable. The difference in results for Sample 2 between the two COG reference centers underlies the need for not only a harmonized approach for analysis, but also illustrates the difficulties that can be encountered when shipping fresh samples over long distances and several climate zones.
FIG. 1.

Initial Assessment with Four Laboratories. Results of first wet sample challenge. Two COG laboratories and two adult Cooperative Group laboratories participated in a wet sample challenge in which varying numbers of ALL blasts were spiked into remission bone marrow. For this initial assessment, the cut-off was set at 0.1% since this was an initial attempt at comparability of MRD among the laboratories. Samples 5 and 8 did not contain ALL blasts, while Sample 1 was just under the 0.1% level.
Based on the results of Phase 1, the pilot study, Phases 2 and 3 were planned. Before doing so the entire process from specimen collection, reagents, processing, and many aspects of the data analysis were documented in a concise protocol provided as supplemental data.
Phase 2
Figure 2A–C shows the results of the first three rounds of listmode send outs.
FIG. 2.

Results from five dry send outs comprised of listmode files with five cases with varying levels of residual disease or none. Black dots are the reference values and white circles are the reported results from the seven participating labs. Percent concordance was measured as a result, and was within a ½ log of the reference result. A Cases 1–5. B. Cases 6–10. C. Cases 11–15. D. Cases 16–20. E. Cases 21–25. Parts A, B, and C were from Phase 2, and D and E. were from Phase 3.
Dry challenge round 1 (Fig. 2A Cases 1–5)
In the first dry challenge send out, all labs agreed on the presence or absence of MRD in three of the five cases. In one of the two cases (Case 4) where there was no unanimity, there was only one lab that showed disagreement. In the other case (Case 2) there was greater disparity, with only three of the seven labs agreeing on the absence of MRD when compared with the reference. On review of the data, the most challenging case was MRD negative, but with the phenotype of the B-ALL not significantly different from the regenerating hematogones that were present in this sample.
Dry challenge round 2 (Fig. 2B Cases 6–10)
This set of samples focused on artifacts commonly seen in shipped samples. These varied from debris, which is seen as a 45° diagonal pattern in many plots, as well as dying plasma cells and plasmablasts, which can show lower levels of CD38 expression, and can be confused with some B-ALL populations. This set of samples showed full agreement for only two (Cases 7 and 10) of the five samples, with two negative samples being called positive by one (Case 8) and two labs, respectively (Case 9), and the last sample showing disagreement even between the two COG reference labs (Case 6), highlighting the challenge in dealing with samples in less than pristine condition.
Dry challenge round 3 (Fig. 2C Cases 11–15)
Five samples highlighting potential problem cases, and as seen in Figure 1A, again showed significant differences among labs for many of the samples.
Among 105 total challenges in Cases 1 through 15, the overall discordance rate was 26%. This included nine false positives, 13 false negatives, and an additional five quantitatively discordant cases among positives.
This educational component proved critical, as many of the labs were not familiar with characteristic changes seen in bone marrow, particularly in children, after induction therapy for B-ALL. Table 2 shows overall concordance for the three surveys, ranging from 53% to 90%.
Table 2.
Dry Challenges 1–3
| # Attempted | 15 | 15 | 15 | 15a | 15 | 15 | 15a |
|---|---|---|---|---|---|---|---|
| % Attempted | 100% | 100% | 100% | 100% | 100% | 100% | 100% |
| # Positive | 7 | 9 | 7 | 11 | 12 | 9 | 8 |
| # Negative | 8 | 6 | 8 | 4 | 3 | 6 | 7 |
| False positive | 0 | 1 | 2 | 2 | 4 | 0 | 0 |
| False negative | 2 | 1 | 4 | 1 | 2 | 2 | 1 |
| Overall concordance (%) | 87% | 87% | 60% | 80% | 60% | 87% | 93% |
| Outside ½ log | 2 | 4 | 6 | 4 | 7 | 3 | 1 |
| ½ log Concordance (%) | 87% | 73% | 60% | 73% | 53% | 80% | 93% |
The 3rd round of results for two laboratories were submitted after the deadline results were due.
Figure 3A shows an example of one of the negative cases in this study that contained no residual disease. There is classic normal development pattern from normal hematogones through to mature B cells. There is maturation of cells acquiring CD20 while initially losing CD34 and then CD10. The decrease of CD38 also occurs in a distinct pattern that fits with classic B-cell maturation. Figure 3B shows a case from this study with residual disease.
FIG. 3.
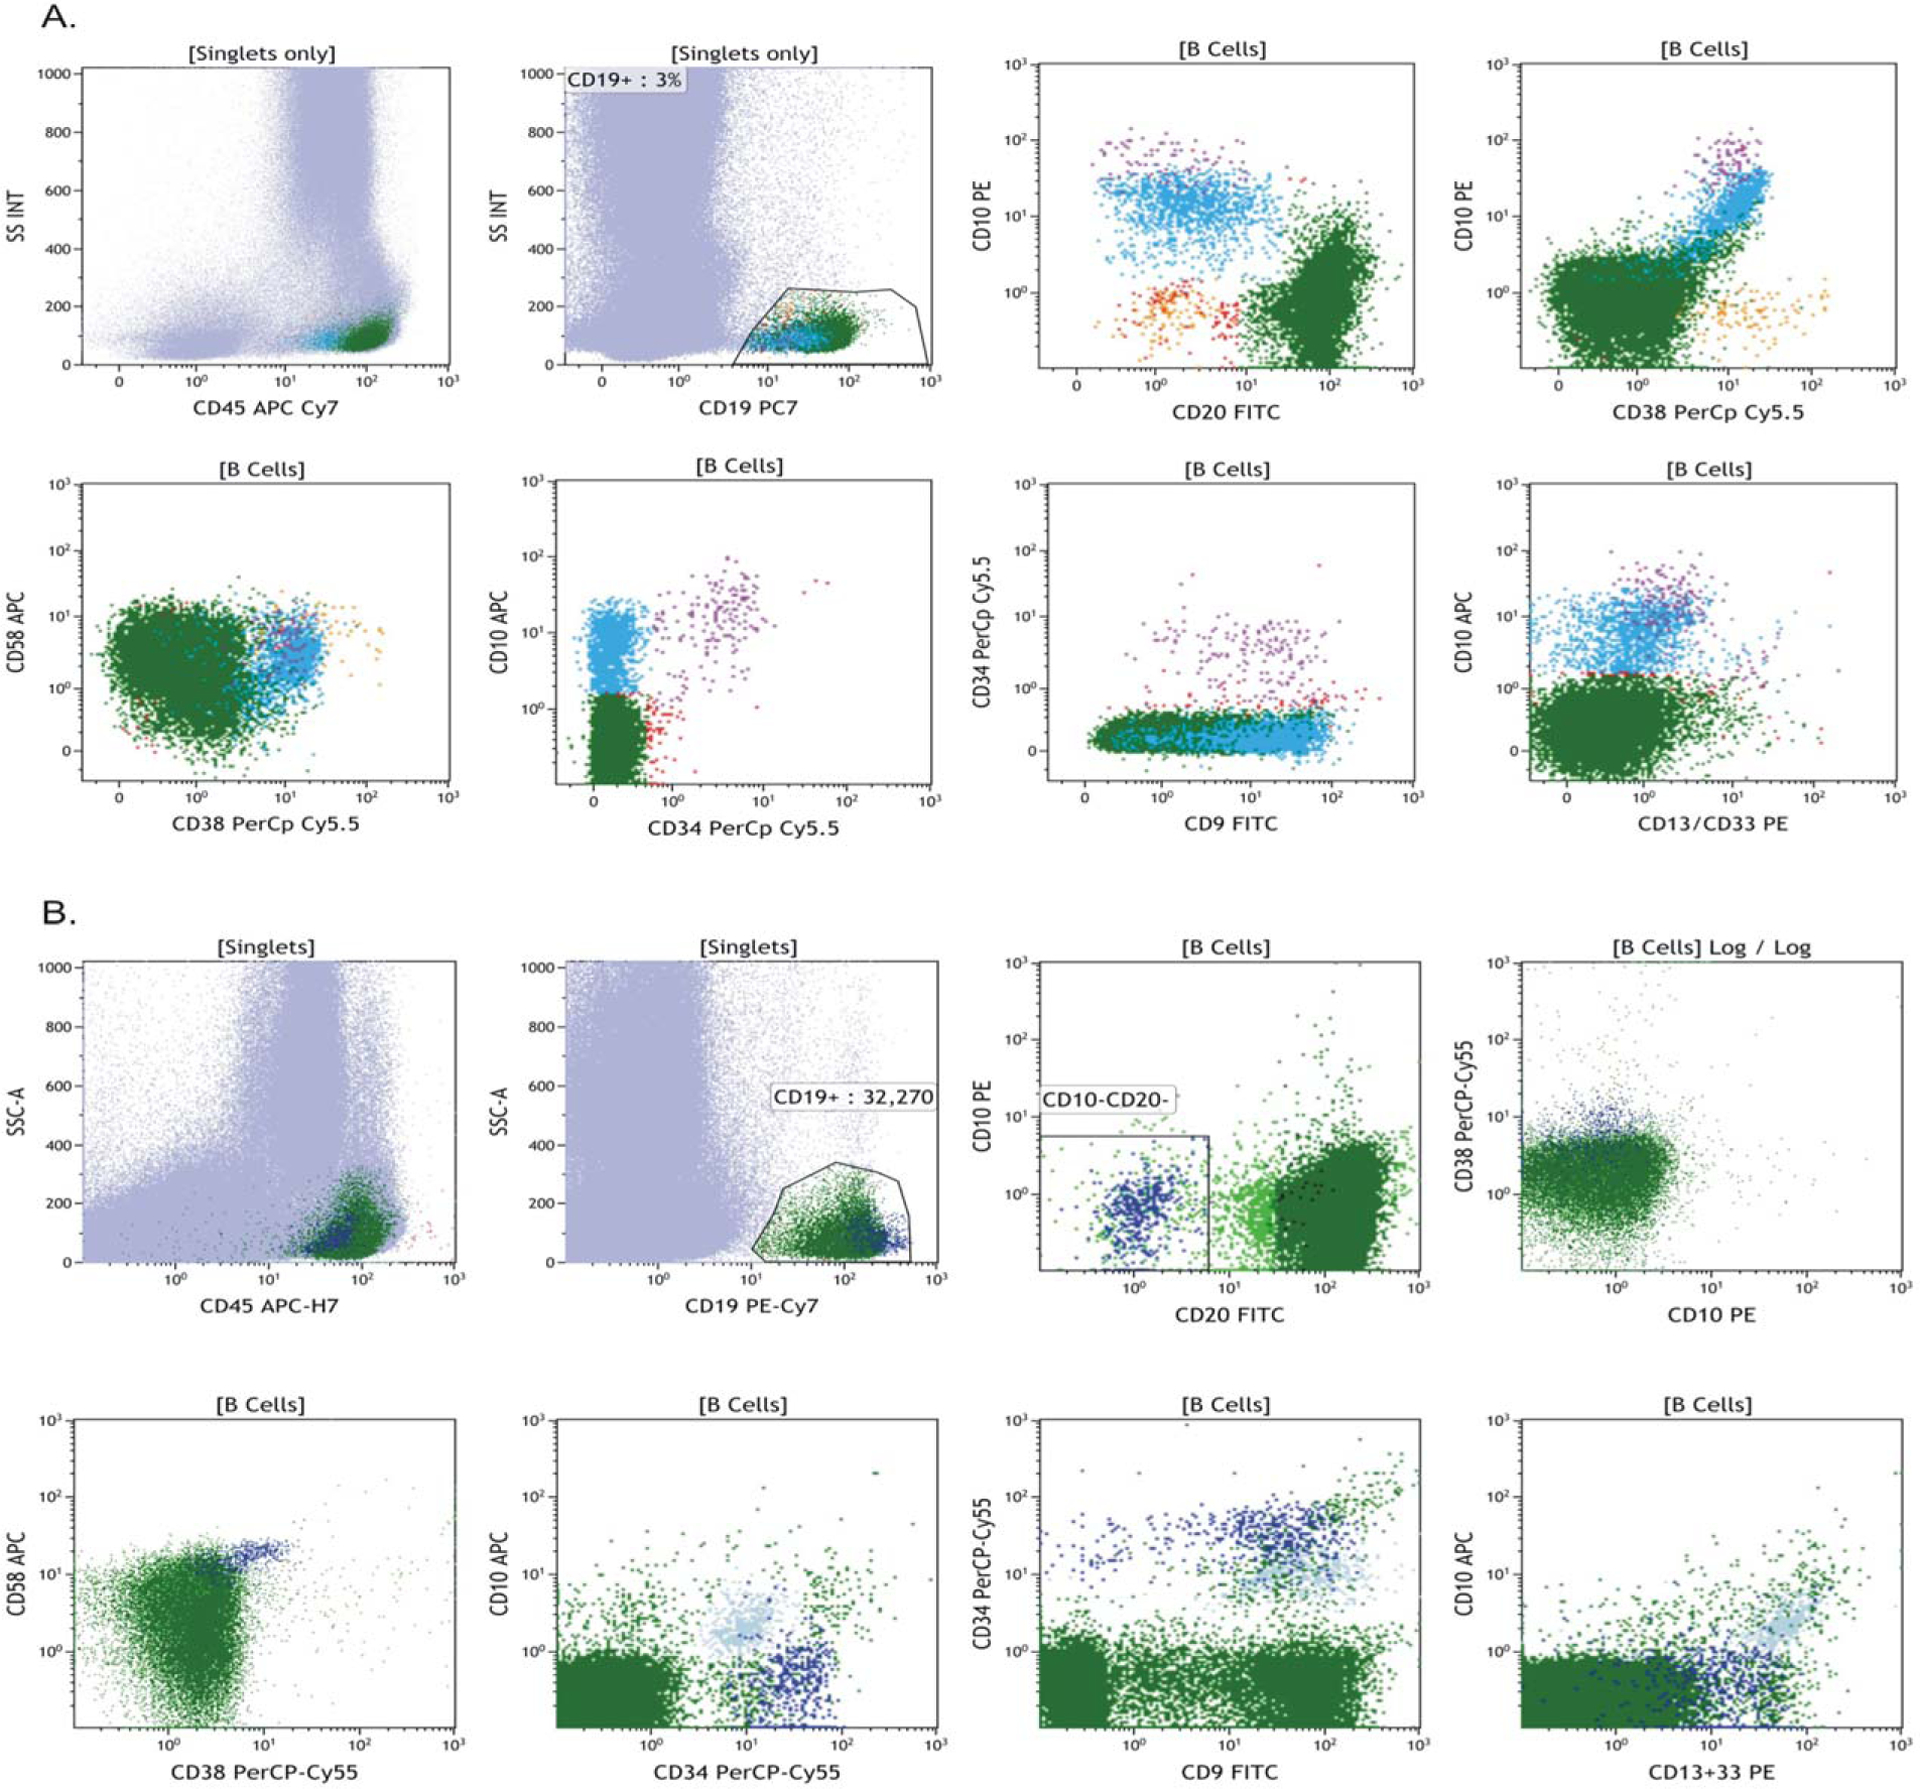
Dot plots from two cases from the study. A. Representative dot plots showing a pattern that is consistent with maturing B cell hematogones within the bone marrow and no residual disease present. B. Dot plots show residual disease with a distinct phenotype that is bright CD19, CD10 negative, CD20 negative, CD34 positive, and brighter CD58 than normal.
At the time that instructions for gating were initially distributed, we did not account for how to analyze dim CD19+ cases even though antigen down-regulation has been documented (20–22). These presented a particular challenge, as this is the primary marker used to identify B-cell populations in the standard COG protocol. For these cases, a plot of CD45 vs.CD10 often allowed detection of the abnormal population more effectively. Also, in these cases, it proved difficult to have an accurate and reproducible denominator between tubes. In such circumstances, it proved better to use the absolute lymphocyte number across tubes in the calculation instead of CD19+ B cells; this is also true in cases in which there are very few CD19+ events. Thus, we modified our standard instructions to allow for the use of both denominators in calculations; indeed this provides a good internal check.
Table 4 was created from the analysis of the 3 rounds of challenges within Phase 2 of this study; additional insight from the reference laboratory was also included in this table and denoted with an asterisk. The list of reasons was compiled from the minutes of meetings after each round of challenges, specific sites were not identified to have a single problem and the list was not ranked in order of highest frequency.
Table 4.
Observed Reasons for Discordance Between Results
| Reason for Discordance |
|---|
| Lack of experience with pediatric MRD analysis |
| Misidentification of hematogones for residual disease |
| Inability to recognize an abnormal population in the background of a large population of hematogones |
| Not displaying all pairwise plots shown for data analysis |
| Lack of Boolean gating to isolate residual disease from normal background |
| ALL phenotype close to that of mature B cells |
| Unfamiliarity with artifact with sample degradation |
| Poor staining due to sample degradation |
| Inaccurate gating of B cells leading to high, or lower MRD levels |
| Phenotypic shift not previous seen |
| Unfamiliarity with the pattern of recovering marrow |
Phase 3
Dry challenge rounds 4 and 5 (Fig. 2D,E, Cases 1–10)
Results of the final two challenges are shown in Figure 2D,E and Table 3. As can be seen, there is significant improvement overall, with six of the seven participating laboratories achieving at least 90% concordance with the reference laboratory. In the second round, positive and negative samples, as well as those with normal precursors were included, though these samples contained fewer artifacts than those of the first round (Fig. 4). Performance improved considerably. Out of 70 challenges, there were five false positives and one false negative (8.6% discordance), and no cases were quantitatively discordant. Four of the six deviations occurred in a single lab, that had no previous experience with pediatric samples and three samples with hematogones were still misclassified as MRD.
Table 3.
Dry Challenges 4–5
| Statistics for 7 participating laboratories | |||||||
|---|---|---|---|---|---|---|---|
| # Attempted | 10 | 10 | 10 | 10 | 10 | 10 | 10 |
| % Attempted | 100% | 100% | 100% | 100% | 100% | 100% | 100% |
| # Positive | 5 | 5 | 7 | 6 | 5 | 6 | 5 |
| # Negative | 5 | 5 | 3 | 4 | 5 | 4 | 5 |
| False POS | 0 | 0 | 3 | 1 | 0 | 1 | 0 |
| False NEG | 0 | 0 | 1 | 0 | 0 | 0 | 0 |
| Overall Concordance (%) | 100% | 100% | 60% | 90% | 100% | 90% | 100% |
| Outside ½ log | 0 | 0 | 4 | 1 | 0 | 1 | 0 |
| ½ log Concordance (%) | 100% | 100% | 60% | 90% | 100% | 90% | 100% |
FIG. 4.

Dot plots of a case showing degradation/artefact within the analyzed sample. Although fresh specimens are ideal due to centralized testing shipped samples often experience some degeneration over time due to unavoidable pre-analytical issues. Recognizing this and using Boolean gating to remove this from the residual disease is necessary to accurately enumerate the disease present.
DISCUSSION
Assessment of MRD in B-ALL is widely used for risk assignment in most treatment protocols. Many centers use FCM for this purpose. European centers have considerable experience in developing and testing standardized methods for doing this, and the Euroflow consortium has held workshops targeting full standardization of methodology (11,23,24). Recently a study has been published using the Euroflow approach and comparing it to PCR. After several rounds of testing multiple antibody combinations, this group finalized on 2 eight color tubes and Infinicyt software for the FCM analysis. It should be noted that automated software such as Infinicyt use complex algorithms to determine abnormal clusters. Using this approach they determined that using one or other of the tubes (based on patients’ diagnostic phenotype) would result in concordance in 98% of cases (25). Other groups have also reported on the use of 7–8 color panels and comparison with PCR (26,27). Karawajew et al. described an eight color tube containing CD10/CD19/CD20/CD22/CD34/CD38/CD45 and the nuclear dye Syto41 in relapsed childhood acute lymphoblastic leukemia. Using this combination they showed excellent overall concordance with PCR, however with lower values for flow cytometry compared with PCR (27). The addition of CD22, and CD38 in particular, enhanced separation of regenerating hematogones from residual disease. Gaipa et al. (26), showed concordance between flow cytometry and PCR is both time-point and threshold sensitive, with the greatest discordance at Day 33 compared with either Day 15 or Day 78. On further analysis, the data showed that patients MRD positive at the 0.01% threshold on Day 33 by PCR while negative by FCM had a better event free survival at 5 years than those who were positive by both methods above the same threshold (77.1% versus 50.9%, P < 0.001). Conversely, PCR positive patients who were FCM negative at this time point had a 5 year EFS of 81.9% versus 91.6% compared with patients who were below the 0.01% threshold by both methods. They concluded that discordant cases in either direction (PCR + FCM− and vice versa) with very low level disease was not a strong predictor of worse outcome. In North America the vast majority of children with B-ALL have been treated on COG protocols, where testing has been done on Day 29 at only two reference laboratories that have previously shown excellent concordance (17). As this testing becomes considered standard treatment for B-ALL, it has become necessary to demonstrate that this assay can be performed more widely before embarking on developing more sophisticated methodologies.
After an initial assessment of four laboratories (Phase 1) showing higher levels of concordance using a standardized assays (albeit not 100% concordance between the two COG reference laboratories) over that of LDTs it was decided to begin with the well-established COG method in Phases 2 and 3 of this study. The goal of this study was to educate experienced FCM labs in MRD analysis (often using LDT for analysis on adults) in the use of the COG assay; and to determine their performance in a series of unknown challenges as a quality assurance program.
After analysis of Phase 1, a larger group of labs, (7 participating sites with a reference lab which did not participate in the challenges) all with experience in MRD testing was chosen to be part of a more extensive study.
Ideally, standardization of MRD analysis should include everything from instrument setup, to staining protocols, to analysis. In this study, the aim was to standardize analysis, while allowing flexibility in the software packages used. Initially an attempt was made to exchange viable specimens however this was hampered by preanalytic factors as the samples used were from residual 24 h old patient bone marrow spiked into normal blood and then shipped to the individual sites. The reference lab reanalyzed listmode files produced by the participating labs from these studies and demonstrated that the discrepancies were, for the most part, not due to sample processing and analytical errors, but in result interpretation (data not shown).
There is currently an external quality assurance (EQA) program provided by the United Kingdom National External Quality Assessment Site (UK NEQAS), and the College of American Pathologists is assessing the provision of both wet and dry challenges. A key issue with stabilized EQA surveys, however, is the difficulty in acquiring and preparing actual B-ALL samples that mimic the multiple issues addressed in this study. In addition, samples which mimic regenerative hematogone populations would be extremely useful as part of a quality assurance program.
The service offered through UK NEQAS ships stabilized samples to participating centers and results are compared with peer groups. Typically these samples contain higher levels of residual disease, (>0.1%) in a background of normal blood. Review of data from these surveys reveals an overall discordance rate of approximatley10–15%, presumably between experienced laboratories.
In the second phase, of this study, three rounds of listmode file send outs were designed to challenge and educate the different users on some of the less common problems seen when analyzing MRD files in pediatric B-ALL. While laboratories in general had no problems identifying cleanly negative samples (below 0.01%), those with hematogones, or those with hematogones mixed with abnormal cells, proved more difficult, leading to an overall discordant rate of 26% (as defined by greater than a ½ log difference from the standard). From review sessions held after each of the challenges, it was determined that some factors contributing to this relatively poor performance, even among labs with experience doing B-ALL MRD FCM, in part related to lack of familiarity with some of the artifacts associated with shipped samples, inexperience with pediatric cases and antibody combinations that differed from those used within each of the laboratories.
After analysis of Phase 2 and educational from the COG reference laboratory (which lead to the creation of Table 4) Phase 3 was initiated. These final challenges again only used listmode data with both positive and negative cases, with and without hematogones. Laboratory performance improved on these samples, with a discordance rate that went from 26% to 9% and with much less dispersion of the data. Four of the seven labs showed perfect concordance with the originating lab on all samples, and two of the others missed only one of the challenges. At this point it was the feeling of the group that further rounds of testing would not provide a significant improvement with the current methodology. In a continued effort to further this standardized approach MRD analysis in North America by FCM will be comparing the six-color COG methodology to an eight-color COG methodology. This has the potential to improve identification and differentiation of hematogones from residual blast populations, but will present a new set of challenges as the antibody panels will have to be vendor specific, given the different configurations of eight+ color instruments from different vendors. Ongoing quality assurance studies with education targeted at specific issues seen with both 6 color and potentially the 8 color methods will continue. Several groups in Europe have already standardized on eight-color panels, though these have typically used a single instrument (28–30). Results from a quality assurance program from this group and other studies were recently published, and as mentioned above, showed excellent concordance to PCR based methods (25–27,31,32).
Despite having prior experience in MRD testing, the results show that there is a need, even in expert laboratories, for educational programs if MRD analysis is to be standardized. Although this is the first North American attempt to develop and test a standardized method for performing ALL MRD testing, there have been several European studies devoted to this (11,23,24). Similar to our results; these studies showed relatively poor performance at first, but with multiple rounds of testing, and with educational sessions in between, laboratory performance was improved. The COG is currently engaged in a qualification procedure for laboratories that wish to become a reference center for enrolment in COG clinical trials, in which a sample is split, and half sent overnight to a COG reference lab, while running the same assay locally. These one-to-one comparisons on identical material may lead to a better evaluation of assays in different labs. Based on the results presented in this paper and the need for decentralized MRD testing in North America, the authors suggest that the educational approach outlined here serve as an approach to site education for those centers wishing to be a COG reference laboratory.
Standardization is an essential process to allow reproducible data from multiple centers. Recent guidelines from the International Society for Laboratory Hematology/International Clinical Cytometry Society were developed to assist laboratories, manufacturers, and regulatory agencies in assessing validation strategies unique to FCM. These should prove useful in augmenting the approach used in this study design, allowing practical data to be presented to regulatory bodies, while ensuring that standardized methodologies can provide reliable data (33–38).
CONCLUSION
It is important to reemphasize that in the first and second phases of this QA study, even experienced laboratories had difficulty recognizing MRD in certain challenging samples. Laboratories did have experience in MRD analysis; however experience with their own LDTs and often experience with primarily adult B Cell ALL samples lead to a high discordance rate when compared with the reference laboratory. Training the laboratories to use a standardized analysis methodology, along with continuous educational feedback, laboratories improved their performance when using the COG protocol. It is the continuous educational component used which we would like to highlight in this study, as training laboratories to correctly identify residual disease and distinguish it from hematogones remains the most challenging aspect of MRD detection and enumeration. Extrapolating these results to other North American laboratories with less experience indicates the need for caution in rapid migration of MRD testing from centralized reference laboratories, and suggests that implementation of MRD testing as part of routine clinical management of B-ALL patients in a manner similar to that of routine flow cytometric classification of leukemia will require standardized methodologies, preferably with automated cell classification software coupled with additional resources, training, and continuous education.
Supplementary Material
ACKNOWLEDGMENTS
The authors would like to thank the many technologists involved in each of the labs involved in this study.
Grant sponsor: FNIH Biomarkers Consortium project.
Grant sponsor: FNIH by: AbbVie, Inc., Amgen, Inc., Pfizer, Inc., and Genentech, Inc.
Grant sponsor: BD Biosciences and Beckman Coulter, Inc.
Footnotes
Additional supporting information may be found in the online version of this article at the publisher’s web-site
LITERATURE CITED
- 1.van Dongen JJ, Seriu T, Panzer-Grumayer ER, Biondi A, Pongers-Willemse MJ, Corral L, Stolz F, Schrappe M, Masera G, Kamps WA, et al. Prognostic value of minimal residual disease in acute lymphoblastic leukaemia in childhood. Lancet 1998;352:1731–1738. [DOI] [PubMed] [Google Scholar]
- 2.Borowitz MJ, Devidas M, Hunger SP, Bowman WP, Carroll AJ, Carroll WL, Linda S, Martin PL, Pullen DJ, Viswanatha D, et al. Clinical significance of minimal residual disease in childhood acute lymphoblastic leukemia and its relationship to other prognostic factors: A Children’s Oncology Group study. Blood 2008;111:5477–5485. [DOI] [PMC free article] [PubMed] [Google Scholar]
- 3.Paiva B, Vidriales M-B, Cervero J, Mateo G, Perez JJ, Montalban MA, Sureda A, Montejano L, Gutierrez NC, Garcia de Coca A, et al. Multiparameter flow cytometric remission is the most relevant prognostic factor for multiple myeloma patients who undergo autologous stem cell transplantation. Blood 2008;112:4017–4023. [DOI] [PMC free article] [PubMed] [Google Scholar]
- 4.Buccisano F, Maurillo L, Del Principe MI, Del Poeta G, Sconocchia G, Lo-Coco F, Arcese W, Amadori S, Venditti A. Prognostic and therapeutic implications of minimal residual disease detection in acute myeloid leukemia. Blood 2012;119:332–341. [DOI] [PubMed] [Google Scholar]
- 5.Paiva B, Cedena M-T, Puig N, Arana P, Vidriales M-B, Cordon L, Flores-Montero J, Gutierrez NC, Martin-Ramos M-L, Martinez-Lopez J, et al. Minimal residual disease monitoring and immune profiling in multiple myeloma in elderly patients. Blood 2016;127:3165–3174. [DOI] [PubMed] [Google Scholar]
- 6.Sayala HA, Rawstron AC, Hillmen P. Minimal residual disease assessment in chronic lymphocytic leukaemia. Best Pract Res Clin Haematol 2007;20:499–512. [DOI] [PubMed] [Google Scholar]
- 7.Martinez-Sanchez P, Montejano L, Sarasquete ME, Garcia-Sanz R, Fernandez-Redondo E, Ayala R, Montalban MA, Martinez R, Garcia Larana J, Alegre A, et al. Evaluation of minimal residual disease in multiple myeloma patients by fluorescent-polymerase chain reaction: The prognostic impact of achieving molecular response. Br J Haematol 2008;142:766–774. [DOI] [PubMed] [Google Scholar]
- 8.Bosch F, Ferrer A, Villamor N, Gonzalez M, Briones J, Gonzalez-Barca E, Abella E, Gardella S, Escoda L, Perez-Ceballos E, et al. Fludarabine, cyclophosphamide, and mitoxantrone as initial therapy of chronic lymphocytic leukemia: High response rate and disease eradication. Clin Cancer Res 2008;14:155–161. [DOI] [PubMed] [Google Scholar]
- 9.Dworzak MN, Froschl G, Printz D, Mann G, Potschger U, Muhlegger N, Fritsch G, Gadner H, Austrian Berlin-Frankfurt-Munster Study G. Prognostic significance and modalities of flow cytometric minimal residual disease detection in childhood acute lymphoblastic leukemia. Blood 2002;99:1952–1958. [DOI] [PubMed] [Google Scholar]
- 10.Weir EG, Cowan K, LeBeau P, Borowitz MJ. A limited antibody panel can distinguish B-precursor acute lymphoblastic leukemia from normal B precursors with four color flow cytometry: Implications for residual disease detection. Leukemia 1999;13:558–567. [DOI] [PubMed] [Google Scholar]
- 11.Irving J, Jesson J, Virgo P, Case M, Minto L, Eyre L, Noel N, Johansson U, Macey M, Knotts L, et al. Establishment and validation of a standard protocol for the detection of minimal residual disease in B lineage childhood acute lymphoblastic leukemia by flow cytometry in a multi-center setting. Haematologica 2009;94:870–874. [DOI] [PMC free article] [PubMed] [Google Scholar]
- 12.Lucio P, Gaipa G, van Lochem EG, van Wering ER, Porwit-MacDonald A, Faria T, Bjorklund E, Biondi A, van den Beemd MW, Baars E, et al. BIOMED-I concerted action report: Flow cytometric immunophenotyping of precursor B-ALL with standardized triplestainings. BIOMED-1 Concerted Action Investigation of Minimal Residual Disease in Acute Leukemia: International Standardization and Cli??ž??. Leukemia 2001;15:1185–1192. [DOI] [PubMed] [Google Scholar]
- 13.Bruggemann M, Schrauder A, Raff T, Pfeifer H, Dworzak M, Ottmann OG, Asnafi V, Baruchel A, Bassan R, Benoit Y, et al. Standardized MRD quantification in European ALL trials: Proceedings of the Second International Symposium on MRD assessment in Kiel, Germany, 18–20 September 2008. Leukemia 2010;24:521–535. [DOI] [PubMed] [Google Scholar]
- 14.Shaver AC, Greig BW, Mosse CA, Seegmiller AC, B-ALL minimal residual disease flow cytometry: An application of a novel method for optimization of a single-tube model. Am J Clin Pathol 2015;143: 716–724. [DOI] [PubMed] [Google Scholar]
- 15.Coustan-Smith E, Ribeiro RC, Stow P, Zhou Y, Pui C-H, Rivera GK, Pedrosa F, Campana D. A simplified flow cytometric assay identifies children with acute lymphoblastic leukemia who have a superior clinical outcome. Blood 2006;108:97–102. [DOI] [PMC free article] [PubMed] [Google Scholar]
- 16.Campana D, Pui CH. Minimal residual disease-guided therapy in childhood acute lymphoblastic leukemia. Blood 2017;129:1913–1918. [DOI] [PMC free article] [PubMed] [Google Scholar]
- 17.Borowitz MJ, Wood BL, Devidas M, Loh ML, Raetz EA, Salzer WL, Nachman JB, Carroll AJ, Heerema NA, Gastier-Foster JM, et al. Prognostic significance of minimal residual disease in high risk B-ALL: A report from Children’s Oncology Group study AALL0232. Blood 2015;126:964–971. [DOI] [PMC free article] [PubMed] [Google Scholar]
- 18.Maecker HT, Frey T, Nomura LE, Trotter J. Selecting fluorochrome conjugates for maximum sensitivity. Cytometry A 2004;62:169–173. [DOI] [PubMed] [Google Scholar]
- 19.Dworzak MN, Fritsch G, Panzer-Grumayer ER, Mann G, Gadner H. Detection of residual disease in pediatric B-cell precursor acute lymphoblastic leukemia by comparative phenotype mapping: Method and significance. Leuk Lymphoma 2000;38:295–308. [DOI] [PubMed] [Google Scholar]
- 20.Ghodke K, Bibi A, Rabade N, Patkar N, Subramanian PG, Aamre Kadam P, Badrinath Y, Ghogale S, Gujral S, Tembhare P. CD19 negative precursor B acute lymphoblastic leukemia (B-ALL) – Immunophenotypic challenges in diagnosis and monitoring: A study of three cases. Cytometry B Clin Cytom 2016. Epub ahead of print. [DOI] [PubMed] [Google Scholar]
- 21.van Wering ER, Beishuizen A, Roeffen ET, van der Linden-Schrever BE, Verhoeven MA, Hahlen K, Hooijkaas H, van Dongen JJ. Immunophenotypic changes between diagnosis and relapse in childhood acute lymphoblastic leukemia. Leukemia 1995;9:1523–1533. [PubMed] [Google Scholar]
- 22.Borowitz MJ, Pullen DJ, Winick N, Martin PL, Bowman WP, Camitta B. Comparison of diagnostic and relapse flow cytometry phenotypes in childhood acute lymphoblastic leukemia: Implications for residual disease detection: A report from the Children’s Oncology Group. Cytometry B Clin Cytom 2005;68:18–24. [DOI] [PubMed] [Google Scholar]
- 23.Bjorklund E, Matinlauri I, Tierens A, Axelsson S, Forestier E, Jacobsson S, Ahlberg AJ, Kauric G, Mantymaa P, Osnes L, et al. Quality control of flow cytometry data analysis for evaluation of minimal residual disease in bone marrow from acute leukemia patients during treatment. J Pediatr Hematol Oncol 2009;31:406–415. [DOI] [PubMed] [Google Scholar]
- 24.Dworzak MN, Gaipa G, Ratei R, Veltroni M, Schumich A, Maglia O, Karawajew L, Benetello A, Potschger U, Husak Z, et al. Standardization of flow cytometric minimal residual disease evaluation in acute lymphoblastic leukemia: Multicentric assessment is feasible. Cytometry B Clin Cytom 2008;74:331–340. [DOI] [PubMed] [Google Scholar]
- 25.Theunissen P, Mejstrikova E, Sedek L, van der Sluijs-Gelling AJ, Gaipa G, Bartels M, Sobral da Costa E, Kotrova M, Novakova M, Sonneveld E, et al. Standardized flow cytometry for highly sensitive MRD measurements in B-cell acute lymphoblastic leukemia. Blood 2016;129: 347–357. [DOI] [PMC free article] [PubMed] [Google Scholar]
- 26.Gaipa G, Cazzaniga G, Valsecchi MG, Panzer-Grumayer R, Buldini B, Silvestri D, Karawajew L, Maglia O, Ratei R, Benetello A, et al. Time point-dependent concordance of flow cytometry and real-time quantitative polymerase chain reaction for minimal residual disease detection in childhood acute lymphoblastic leukemia. Haematologica 2012;97:1582–1593. [DOI] [PMC free article] [PubMed] [Google Scholar]
- 27.Karawajew L, Dworzak M, Ratei R, Rhein P, Gaipa G, Buldini B, Basso G, Hrusak O, Ludwig WD, Henze G, et al. Minimal residual disease analysis by eight-color flow cytometry in relapsed childhood acute lymphoblastic leukemia. Haematologica 2015;100:935–944. [DOI] [PMC free article] [PubMed] [Google Scholar]
- 28.van Dongen JJ, Lhermitte L, Bottcher S, Almeida J, van der Velden VH, Flores-Montero J, Rawstron A, Asnafi V, Lecrevisse Q, Lucio P, et al. EuroFlow antibody panels for standardized n-dimensional flow cytometric immunophenotyping of normal, reactive and malignant leukocytes. Leukemia 2012;26:1908–1975. [DOI] [PMC free article] [PubMed] [Google Scholar]
- 29.van Dongen JJ, Orfao A. EuroFlow: Resetting leukemia and lymphoma immunophenotyping. Basis for companion diagnostics and personalized medicine. Leukemia 2012;26:1899–1907. [DOI] [PMC free article] [PubMed] [Google Scholar]
- 30.Kalina T, Flores-Montero J, van der Velden VH, Martin-Ayuso M, Bottcher S, Ritgen M, Almeida J, Lhermitte L, Asnafi V, Mendonca A, et al. EuroFlow standardization of flow cytometer instrument settings and immunophenotyping protocols. Leukemia 2012;26:1986–2010. [DOI] [PMC free article] [PubMed] [Google Scholar]
- 31.O’Connor D, Moorman AV, Wade R, Hancock J, Tan RM, Bartram J, Moppett J, Schwab C, Patrick K, Harrison CJ, et al. Use of minimal residual disease assessment to redefine induction failure in pediatric acute lymphoblastic leukemia. J Clin Oncol 2017;35:660–667, JCO2016696278. [DOI] [PubMed] [Google Scholar]
- 32.Alm SJ, Engvall C, Asp J, Palmqvist L, Abrahamsson J, Fogelstrand L. Minimal residual disease monitoring in childhood B lymphoblastic leukemia with t(12;21)(p13;q22); ETV6-RUNX1: Concordant results using quantitation of fusion transcript and flow cytometry. Int J Lab Hematol 2016;396:121–128. [DOI] [PubMed] [Google Scholar]
- 33.Bene M-C, Marti GE. ICSH/ICCS practice guidelines special issue. Cytometry B Clin Cytom 2013;84:279–280. [DOI] [PubMed] [Google Scholar]
- 34.Davis BH, Wood B, Oldaker T, Barnett D. Validation of cell-based fluorescence assays: Practice guidelines from the ICSH and ICCS – Part I – Rationale and aims. Cytometry B Clin Cytom 2013;84:282–285. [DOI] [PubMed] [Google Scholar]
- 35.Davis BH, Dasgupta A, Kussick S, Han J-Y, Estrellado A. Validation of cell-based fluorescence assays: Practice guidelines from the ICSH and ICCS – Part II – Preanalytical issues. Cytometry B Clin Cytom 2013;84:286–290. [DOI] [PubMed] [Google Scholar]
- 36.Tanqri S, Vall H, Kaplan D, Hoffman B, Purvis N, Porwit A, Hunsberger B, Shankey TV. Validation of cell-based fluorescence assays: Practice guidelines from the ICSH and ICCS – Part III – Analytical issues. Cytometry B Clin Cytom 2013;84:291–308. [DOI] [PubMed] [Google Scholar]
- 37.Barnett D, Louzao R, Gambell P, De J, Oldaker T, Hanson CA. Validation of cell-based fluorescence assays: Practice guidelines from the ICSH and ICCS – Part IV – Postanalytic considerations. Cytometry B Clin Cytom 2013;84:309–314. [DOI] [PubMed] [Google Scholar]
- 38.Wood B, Jevremovic D, Bene MC, Yan M, Jacobs P, Litwin V. Validation of cell-based fluorescence assays: Practice guidelines from the ICSH and ICCS – Part V – Assay performance criteria. Cytometry B Clin Cytom 2013;84:315–323. [DOI] [PubMed] [Google Scholar]
Associated Data
This section collects any data citations, data availability statements, or supplementary materials included in this article.