

Abstract
There is great interest in producing nanoparticles for various applications. The objective of this work was to develop a procedure for reproducibly creating stable lead (Pb) phosphate nanoparticle aqueous suspensions. A stable 5 mg/L Pb-phosphate nanoparticle “stock” suspension was synthesized via chemical precipitation of Pb and orthophosphate in water at pH 7.5 with 4.4 mg soluble PO4/L and 7 mg C/L dissolved inorganic carbon. The stock suspension was subsequently diluted to produce stable 0.10 mg/L Pb “challenge” water suspensions without compromising the nanoparticle size, structure, mineralogy and solubility. Specifically, the hexagonal hydroxypyromorphite nanoparticles had an average diameter of 38 nm based on transmission electron microscopy analysis and an associated Pb solubility of 0.001 mg/L. The properties of the stock suspensions were not impacted by further dilutions, and the challenge water suspensions remained stable for 24 hours. In the context of drinking water, a protocol to produce such a stable Pb nanoparticle challenge water suspension would be very useful in evaluating Pb bioavailability, identifying Pb remediation strategies, and testing filter effectiveness to remove Pb from water.
Keywords: Lead-phosphate particles, nanomaterials, hydroxypyromorphite, drinking water
Introduction
Exposure to lead (Pb) is a public health concern that can cause permanent cognitive and behavioral impairments in children, and cardiovascular and kidney problems in adults.[1–3] The U.S. Environmental Protection Agency’s (EPA) 1991 Lead and Copper Rule (LCR) established a treatment based action level for total Pb (i.e., soluble and particulate) in drinking water of 0.015 mg/L,[4–6] which is currently undergoing proposed revision (https://www.epa.gov/ground-water-and-drinking-water/proposed-revisions-lead-and-copper-rule). The reduction of Pb release from drinking water distribution system materials, including service lines, solder, and brasses, can be accomplished by altering water chemistry to encourage the formation of relatively insoluble non-porous Pb minerals on Pb-containing surfaces. For example, orthophosphate can be added to form relatively insoluble Pb-phosphate compounds such as hydroxypyromorphite [Pb5(PO4)3(OH)], chloropyromorphite [Pb5(PO4)3(Cl)] and tertiary Pb phosphate [Pb3(PO4)2].[7] For effective reduction of lead in water, it is also important to assess the interactions of the resulting Pb mineral particles with existing pipe scale, which typically consists of more than one layer of Pb minerals and other materials on the leaded surface, and mobility through the drinking water.
During elevated Pb release events, rapid response actions such as providing residents with bottled water or properly certified (NSF/ANSI-53 for total lead and −42 for fine particulate)[8,9] point-of-use (POU) or pitcher filters may be warranted, particularly in emergency situations. For example, POU and pitcher filters were distributed to residents in the cities of Flint, MI; Newark, NJ; and University Park, IL to protect residents against widespread elevated Pb events.[10–12] Furthermore, the use of POU and pitcher filters has also been advised by some water utilities and State regulatory agencies to protect against Pb release due to physical disturbances from nearby construction activities or Pb service line removal.[13–17]
Recent drinking water Pb sampling efforts in Newark, NJ, indicated that city-supplied NSF-42/53 certified POU and pitcher filters in three homes had excessive levels of Pb (>15 μg/L) pass through the filters.[11,12] EPA performed follow-up water chemistry analysis and Pb particle size fractionation sampling at four houses where filter performance was in question. Analysis of the particulate material revealed that Pb was dominantly present in the water as fine Pb nanoparticles (<0.10 μm) that sometimes passed through the POU or pitcher filtration units. Scanning electron microscopy (SEM), transmission electron microscopy (TEM), and energy-dispersive spectroscopy (EDS) analyses showed that the form of Pb nanoparticles and their aggregates were consistent with hydroxypyromorphite [Pb5(PO4)3OH] and chloropyromorphite [Pb5(PO4)3Cl].[18]
Under the NSF certification protocols NSF/ANSI-53 (total Pb removal) and NSF/ANSI-42 (Class I particulate, 0.5 to 1 micron, reduction), water filter removal efficiency is evaluated using standardized laboratory-generated particles including relatively large Pb carbonate particles (in the case of NSF/ANSI-53)[8,9] rather than small Pb phosphate nanoparticles. These NSF/ANSI challenge tests using large particles are representative of Pb particles in many communities. Field case studies have found NSF-53/42 certified filters adequate in removing water Pb.[10] However, given questions regarding the effectiveness of NSF-53/42 certified POU and pitcher filters to remove much smaller Pb phosphate nanoparticles that form under certain water quality conditions, there may be an eventual need to reevaluate filter certification conditions for Pb particulate removal under more conservative conditions. Therefore, the objective of this work was to develop a protocol to produce stable Pb nanoparticle suspensions representative of particles that could potentially form under some drinking water conditions that would pose an extreme challenge for POU and pitcher filter Pb removal performance.
Materials and methods
Stable 0.10 mg/L total Pb nanoparticle aqueous suspensions were formed under a designated set of water quality conditions to minimize particle size and increase stability based on the work of Formal et al.[19] A primary soluble Pb stock solution was created by adding 1.342 grams of Pb chloride (PbCl2) (Acros Organics, New Jersey) to 1 L of de-ionized (DI) water pre-adjusted to pH 2 using 0.6 N hydrochloric acid to yield a concentration of 1,000 mg Pb/L. A primary orthophosphate stock solution was prepared at a concentration of 2,263 mg PO4/L by adding 3.288 grams of sodium orthophosphate monohydrate (H2O4PNa·H2O) (Fisher Chemical, Fairlawn, NJ) to 1 L of DI water.
A secondary Pb nanoparticle stock suspension was prepared, based on the work of Formal et al.,[19] to obtain a 5 mg Pb/L concentration (soluble Pb < 0.010 mg/L) from the primary Pb stock solution, in water containing 7 mg C/L dissolved inorganic carbon (DIC), 4.4 mg soluble PO4/L, and adjusted to a pH of 7.5. A HACH (Denver, CO) Hq440d multi meter with pHC101 probe pH electrode were used to measure pH while the water was manually titrated with 0.6 N nitric acid (HNO3), and 0.6 N sodium hydroxide (NaOH) (both chemicals, Fisher Chemical, Fairlawn, NJ), to a pH of 7.5 ± 0.1. The pH values and the volume of titrant added were recorded throughout the preparation.
The secondary Pb nanoparticle stock suspension was prepared in a clean 2 L glass beaker with magnetic stirrer and stir bar filled with 2 L of DI water. A weight of 0.098 g of sodium bicarbonate (NaHCO3; Fisher Chemical, Fairlawn, NJ) was added to achieve a total concentration 7 mg C/L. The pH was re-adjusted to 7.5 using the same titrants. Orthophosphate was then added from the primary orthophosphate stock solution to achieve a soluble orthophosphate concentration of approximately 4.4 mg PO4/L after the Pb was added (i.e., equilibrium level with the Pb phosphate mineral). Specifically, 4.5 mL of the primary orthophosphate stock solution was added to the beaker to achieve a concentration of 5.1 mg PO4/L. Lastly, 10 mL of the primary soluble Pb stock suspension was added to the beaker to achieve a total Pb concentration of 5 mg/L (soluble Pb < 0.010 mg/L). This secondary Pb nanoparticle stock suspension was mixed for 20 minutes. Based on past experience, the resulting Pb suspension concentration was identified as optimal to accurately measure particle size and charge using dynamic light scattering (Malvern Zetasizer Nano-ZS90; Malvern, United Kingdom). Secondary Pb nanoparticle stock suspensions were prepared daily over the three-day study period. Filtered (ultrafiltered) water samples were collected, and the samples were submitted for Pb and orthophosphate analyses.
The 0.10 mg/L stable Pb nanoparticle challenge water feed tank was prepared in a 20 L HDPE tank (US Plastic Corporation, Lima, OH). The tank and floating lid were rinsed with DI water three times before use and filled with 19.5 L of DI water. The tank water was adjusted to 7 mg C/L DIC by adding 0.98 g NaHCO3. The pH was adjusted to 7.5 with 0.6 N HNO3 and 0.6 N NaOH (amounts were recorded), and 30 mL of the primary orthophosphate stock solution was added to achieve an orthophosphate concentration of 3.4 mg PO4/L. The pH was readjusted to 7.5 ± 0.1 as previously described, if necessary. Lastly, 400 mL of secondary Pb nanoparticle stock suspension (which contained a relatively small percentage of orthophosphate) was added to the tank to achieve the desired total Pb concentration of 0.10 mg/L. If the pH deviated from 7.5, it was further adjusted as previously described.
The Pb nanoparticle suspension challenge water feed tank was mixed for 5 minutes. Then, water samples at time = 0 were collected from the challenge feed tank. A 1 mL polypropylene disposable pipette was used to place one drop of unfiltered water from the challenge feed tank onto a TEM formvar-coated copper sample grid and allowed to air dry for TEM analysis. An unfiltered water sample and a sample filtered through a 0.20 μm polypropylene disk syringe filter (Whatman, Inc.; Clifton, NJ) were both collected directly from the syringe into 60 mL HDPE sample bottles. An additional 250 mL of water from the challenge feed tank was collected for ultrafiltration using an Anodisc™ Ultracel® 30 kDa Ultrafiltration disk and a 400 mL Amicon® stirred cell filtration apparatus. The stirred cell was placed on a magnetic stir plate and connected to a secured pressurized nitrogen gas tank to push the water sample through the ultrafiltration membrane. Although the Ultracel® filter disks can withstand 70 PSI, the filtrations were operated at a maximum of 10 PSI to minimize the likelihood that colloidal particle could be embedded in the filter. The 30 kDa size was estimated to be approximately equivalent to a 10 nm pore size. Previous work by the authors indicated that the filter and cell apparatus can adsorb significant amounts of soluble Pb (up to approximately 20 μg). As a result, a presoak process was developed where-by the stirred cell with the filter was filled with sample water and held for at least 5 minutes before quickly replacing it with new sample water to filter through the ultrafiltration disks. An initial 150 mL of challenge feed tank water from the 250 mL sample bottle sat in the stirred cell for at least 5 minutes before it was replaced by the remaining 100 mL of challenge feed tank water that was filtered through the ultrafilter. The first 20 mL of water through the filter was wasted, and the remaining water was collected in a 125 mL HDPE sample bottle. After ultrafiltration, a SEM stub with carbon adhesive was dabbed onto the ultrafilter surface to collect particles for SEM analysis. These steps were repeated after the tank was mixed for 1, 2, 3, 4, 5, 6 and 24 hours to assess particle stability. The procedures were also followed to characterize the particles in the 5 mg Pb/L secondary nanoparticle stock suspension shortly after it was produced.
Concentrations of Pb, orthophosphate, and other relevant parameters in the test waters were measured throughout the particle generation and stability studies according to standard methods and approaches. Orthophosphate was analyzed within the alloted sample hold time using the automated colorimetric EPA Method 365.1. Pb was analyzed by inductively coupled plasma-mass spectrometry (ICP-MS) following EPA Method 200.8 and total phosphorus was analyzed using inductively coupled plasma-atomic emission spectrometry (ICP-AES) by EPA Method 200.7. Total inorganic carbon analyses were performed on samples preserved in glass vials with no airspace using ASTM D513 Test Method B. Total alkalinity and chloride were determined using the Potentiometric Titration Standard Methods 2320 b.4.6 and 4500-Cl D.
Samples were prepared for particle analysis by SEM and EDS by collecting Pb particles off the ultrafiltration disks on aluminum sample stubs with double-sided carbon adhesive. The side of the stub with the carbon adhesive was dabbed onto the ultrafiltration disk while still wet. Particles collected on the SEM stubs were then analyzed at EPA’s Advanced Materials and Solids Analysis Research Core (AMSARC) using SEM and EDS. The samples were examined using a JEM7600FE SEM (JEOL USA, Inc. Peabody, MA) at 15 kV and a working distance of 8 mm. The elemental composition of particles was identified using both an Oxford X-max 50 EDS (Oxford Instruments America, Inc., Concord, MA) and the low angle electron backscatter detector. The EDS spectra were analyzed using Aztec software (Oxford Instruments America, Inc., Concord, MA).
TEM samples were prepared by dropping particle-containing water directly to the TEM sample holder grids. A 3 mm copper TEM grid was held in place with self-closing forceps so that it was not touching any surfaces. A 1 mL polypropylene disposable pipette containing sample water was used to place one drop of sample on the TEM grid. The TEM grid was incubated in contact with the sample until the water had fully evaporated, leaving any particles present on the grid. The grid was then placed into the grid holder until examined. Samples were analyzed with JEOL JEM-2100 (Tokyo, Japan) LaB6 200 kV. EDS Oxford X-max 80mm2 EDS (Oxford Instruments America, Inc., Concord, MA). All micrographs were obtained with the field emission gun operating at 200 kV. ImageJ software program developed by the National Institutes of Health was applied to process the images.
Powder XRD analyses were performed on particles to identify crystalline lead phases. For the ultrafiltration samples, a 32 mm diameter disk was cut from the center of each filter and mounted on a quartz zero-background plate. For the 0.2 μm syringe filter samples, the bottom of each filter housing was carefully cut off using a fine-toothed saw and an artist’s knife. The filters were then removed and fixed to quartz zero background plates with spray adhesive. Because the syringe filters were of smaller diameter than the zero background plates, paper shims were used to maintain the correct height of the filter surface in the sample holder. An unused ‘blank’ of both filter types were prepared and mounted in the same manner as the samples to evaluate the characteristic diffraction pattern of the filter material. Samples were analyzed using a PANalytical X’Pert Pro theta-/theta powder diffractometer (Malvern PANalytical Inc., Westborough, MA) using Cu Kα radiation generated at 1.8 kW (45 kV, 40 mA) and an X’celerator RTMS detector. Samples were spun at 1 revolution/s to improve particle statistics. Patterns were collected in continuous scan mode, from 5 to 89.994° 2θ at a scan speed of 0.01181°/s, with data binned into 0.0167113° steps. Diffraction patterns were analyzed using Jade + version 9.8 software (Materials Data, Livermore, CA) and the 2018 ICDD PDF-4+ database (International Centre for Diffraction Data, Newtown Square, PA).
Results and discussion
Secondary Pb nanoparticle stock suspension
Secondary Pb nanoparticle stock suspensions were prepared in triplicate from new primary soluble Pb solutions. The average pH of the suspensions was 7.53 ± 0.04. Total Pb concentration of the secondary suspensions averaged 5.05 ± 0.1 mg/L (average ± standard deviation). The fraction of Pb passing the ultrafilter (considered soluble Pb herein) averaged 0.001 ± 0.001 mg/L (0.02% of the total Pb). Total phosphate concentration of the secondary Pb nanoparticle suspension averaged 5.8 ± 0.4 mg PO4/L. The fraction of phosphate passing the ultrafilter (soluble phosphate) averaged 4.4 ± 0.3 mg PO4/L (77%). Based on ultrafiltered water measurements, the molar ratio of Pb:P of Pb solids trapped on the filter was 1.64 ± 0.18, which is consistent with pyromorphite (Pb:P = 1.67). The suspended Pb particles caught by the filter were very small (Figure 1) and were hexagonal in structure (Figure 2). XRD analysis of Pb nanoparticles showed that Pb was in the hydroxypyromorphite [Pb5(PO4)3OH] form (Figure 3).
Figure 1.

SEM micrograph images of lead-phosphate nanoparticles suspended in secondary Pb nanoparticle stock suspensions at (a) 50,000x, and (b) 75,000x magnification.
Figure 2.

TEM micrograph images of lead-phosphate nanoparticles suspended in test water (a) in the secondary Pb nanoparticle stock solution, and (b) corresponding stable lead nanoparticle challenge water after 24 hours. All micrographs were taken at a magnification of 75,000x.
Figure 3.

Representative XRD diffractogram of lead-phosphate nanoparticles collected on the ultrafilter from secondary Pb nanoparticle stock suspensions Nanoparticles were collected on an ultrafilter. (F- ultrafilter peaks; H- hydroxypyromorphite peaks).
Size analyses of particles suspended in secondary Pb nanoparticle stock suspension were performed using multiple approaches (Table 1). Particle size fractionation based on filtrations suggested that on average, 99.98% of the Pb was in the particulate form based on ultrafiltration results previously discussed. Dynamic light scattering measurements indicated that the average particle size was 0.074 ± 0.012 μm in diameter. Crystallite size based on XRD pattern indicated an average particle size of 0.029 ± 0.004 μm. Lastly, TEM image analysis (only available for two suspensions) resulted in a range of particle size diameter from 0.012 to 0.058 μm, with an average diameter of 0.038 ± 0.012 μm (Table 1). Although some variability between sampled particles and methods is to be expected, the results demonstrate that Pb was dominantly in the nanoparticle size range (i.e., <0.100 μm or <100 nm).
Table 1.
Mean lead nanoparticle size (nm) comparisons, in secondary Pb nanoparticle stock suspension and stable Pb nanoparticle challenge water at t = 24 hours, for each of the 3 replicate particle stability tests, from dynamic light scattering, XRD, and SEM and TEM imaging measurements (na-not analyzed).
| Sample | zetasizer | STDev | n | XRD | STD | n | ImageJ (TEM) | STDev | ImageJ (SEM) | STDev | n | ImageJ Range |
|---|---|---|---|---|---|---|---|---|---|---|---|---|
| Triplicate 1–Secondary stock | 85 | 1 | 3 | 28 | 4 | 8 | 45 | 9 | na | na | 8 | 31-54 |
| Triplicate 1–24hr | na | na | na | na | na | na | 37 | 16 | na | na | 33 | 17-76 |
| Triplicate 2–Secondary stock | 59 | 2 | 3 | 26 | 3 | 2 | na | na | na | na | na | na |
| Triplicate 2–24hr | na | na | na | na | na | na | na | na | 30 | 7 | 95 | 17-82 |
| Triplicate 3–Secondary stock | 78 | 1 | 3 | 30 | 4 | 3 | 31 | 11 | na | na | 25 | 12-58 |
| Triplicate 3–1hr | na | na | na | na | na | na | na | na | 44 | 19 | 19 | 17-82 |
| Triplicate 3–24hr | na | na | na | na | na | na | na | na | 43 | 13 | 32 | 16-68 |
Stable Pb nanoparticle challenge water
Additional stable Pb nanoparticle challenge water suspensions were prepared in triplicate from primary soluble Pb solutions as described. Water analysis results were reproducible across runs and consistent with time (up to 24 hours) and, therefore, were analyzed as sets. The average pH of the suspensions was 7.57 ± 0.10 and the average temperature was 24.1 ± 0.3 °C. Total Pb concentration averaged 0.097 ± 0.010 mg/L. The Pb passing the 0.2 μm filter averaged 0.037 ± 0.012 mg/L (approximately 40% of total Pb) and the Pb passing the ultrafilter (soluble Pb) averaged 0.001 ± 0.000 mg/L (1% of total Pb). The fraction of Pb passing the 0.2 μm was relatively variable but did not trend with time. For example, 0.2 μm Pb values ranged between 0.013 and 0.060 mg/L (Figure 4). Soluble Pb did not change with dilution of Pb-phosphate nanoparticles (i.e., nanoparticles did not dissolve in the challenge water). Total phosphate concentration of stable Pb nanoparticle challenge water averaged 3.7 ± 0.3 mg PO4/L. The total phosphate concentration passing the 0.2 μm averaged 3.7 ± 0.3 mg PO4/L (99.7% of total phosphate) and the total phosphate passing the ultrafilter (soluble phosphate) averaged 3.7 ± 0.3 mg PO4/L (99.3% of total phosphate).
Figure 4.

Representative lead size distribution based on filtrations. Total lead, lead passing 0.2 μm filter (0.2) and lead passing an ultrafilter (ultra) are shown.
Suspended Pb particles in the stable Pb nanoparticle challenge waters were very small (Figure 5) and were hexagonal in structure (Figure 2). The properties appeared to be identical to the particles in the secondary Pb nanoparticle stock suspension. Size and shape did not change over 24 hours (Figure 5) indicating the stable nature of the suspended particles with time. XRD analyses could not be performed due to insufficient concentration of Pb particles, but SEM particle images were consistent with hydroxypyromorphite [Pb5(PO4)3OH].
Figure 5.

SEM micrograph images of lead-phosphate nanoparticles suspended in stable lead nanoparticle challenge water after (a) 0 hours, (b) 1 hour, (c) 2 hours, (d) 5 hours, (e) 6 hours, and (f) 24 hours. Nanoparticles were collected on an ultrafilter and during the same experimental run. All micrographs were taken at a magnification of 75,000x.
Similar to the stock solutions, size analyses of particles suspended in stable Pb nanoparticle challenge water was performed using multiple approaches (Table 1). Particle size distribution based on filtrations (all replicates and times) suggested that on average, 60% of the Pb particles were >0.2 μm, and 38.6% were nanoparticles between 0.01 and 0.2 μm in size. SEM and TEM microscope image analysis indicated a range of aged (t = 24 hr) particle sizes of 0.016 to 0.082 μm, with an average size of 0.039 ± 0.014 μm, which were consistent with the size of nanoparticles in the secondary Pb nanoparticle stock suspension (i.e., particles did not change upon dilution). There were not enough particles in the water to perform size measurements from XRD and dynamic light scattering approaches. However, as previously discussed, Pb remained dominantly in the nanoparticle form.
Implications
A relatively simple procedure (summarized in Figure 6) produced stable Pb-phosphate nanoparticle suspensions that remained so over 24 hours. Although nanoparticles are produced for many reasons using a variety of techniques, the intentional formation of stable Pb nanoparticles within the water quality bounds of a potential drinking water chemistry (i.e., near neutral pH, low DIC, and orthophosphate) for use in studies including filter challenge tests has not been reported. Given recent concerns raised in Newark, NJ, regarding the effectiveness of certified POU filters to remove Pb nanoparticles, interest within the drinking water treatment device industry to develop a more stringent Pb particle challenge water for certification purposes has been expressed (see current NSF/ANSI-53 Pb certification challenge particles in Figure 7). This work could help inform discussion into potential future revisions to the certification tests.
Figure 6.

Summary flowchart of steps taken to make stable Pb nanoparticle challenge water.
Figure 7.

Lead carbonate particles precipitated in the lab using NSF 53 method of lead test water preparation.
In this work, hydroxypyromorphite, the mineral form of the Pb-phosphate nanoparticles, was produced in the prescribed water. The mineral has been identified in some drinking water distribution systems, including in Pb service line scale, in cases where orthophosphate has been added for corrosion control.[7,20,21] The mineral phase is desired for Pb control given the relatively low solubility in drinking water under the appropriate conditions. Furthermore, to reemphasize the representativeness of the challenge particles, the Pb nanoparticles generated in this work very closely (size, shape and mineralogy) resembled those identified in drinking water, most recently in Newark, NJ, where in several cases, they have been shown to pass POU or pitcher filters[18,22] (Figure 8). Lastly, it should be noted that particle size characterization based on filtration fractionation should be approached with the understanding that results do not necessarily represent the true size of particles. Factors including filter material and construction, filtration technique (e.g., applied pressure, rate), degree of particle agglomeration and water quality very likely impact the actual particle size distribution and reproducibility.
Figure 8.
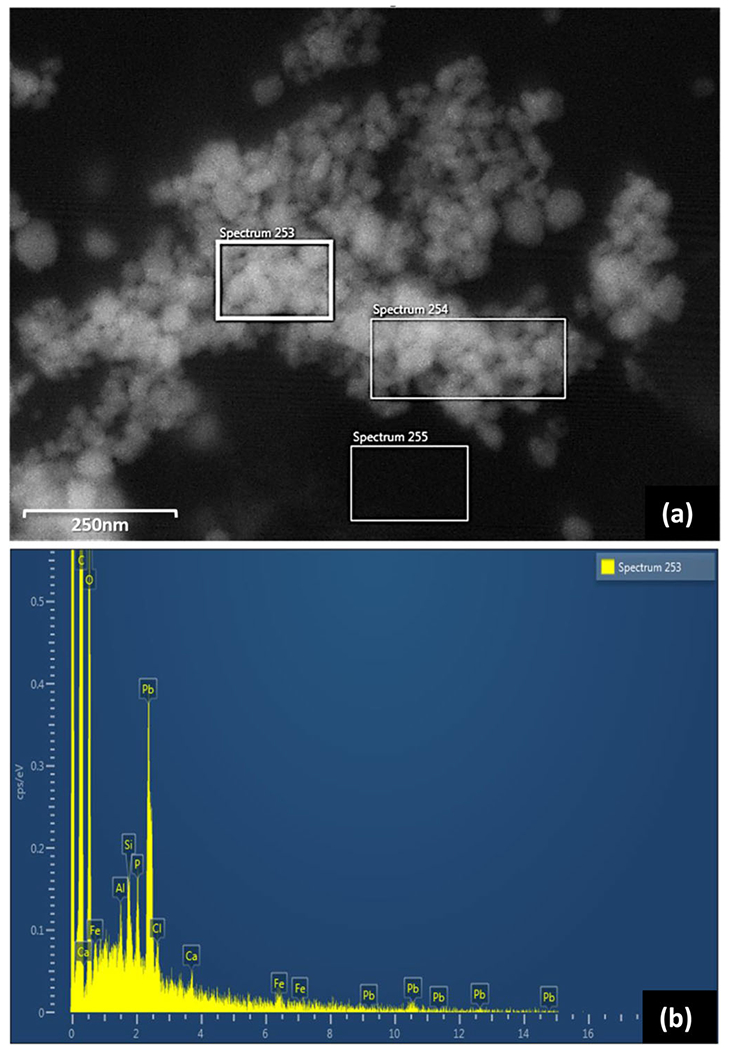
Lead nanoparticles trapped on ultrafilters collected from a community tap water (a) SEM image, and (b) corresponding EDS spectra (see spectrum 253).
Conclusions
In this work, a relatively simple approach to producing stable Pb-phosphate nanoparticle suspensions was described. Specifically, a stable 5 mg/L Pb-phosphate (hydroxypyromorphite) nanoparticle “stock” suspension was synthesized via chemical precipitation of Pb and orthophosphate in water at pH 7.5 with 4.4 mg soluble PO4/L and 7 mg C/L DIC. The stock suspension was subsequently diluted to produce stable 0.100 mg/L Pb “challenge” water suspensions without compromising the nanoparticle size (average diameter of 0.039 μm), structure, mineralogy and solubility over 24 hours. The Pb-phosphate nanoparticle properties resembled particles and Pb corrosion by-product drinking previously reported in full-scale drinking water distribution systems. Lastly, the challenge water production protocol may inform future industry efforts to strengthen Pb-particle test standards applied to testing of POU and pitcher filter devices, for example.
Acknowledgements
The authors would like to acknowledge Robert Janke, Dr. Regan Murray, Dr. Thomas Speth (EPA ORD), and Dr. David Wahman with EPA ORD, and Valerie Bosscher (EPA Region 5) for providing technical manuscript reviews. We would also like to acknowledge EPA ORD management, and EPA’s Safe and Sustainable Water Resources Program for their support, Michael Schock for his encouragement and laboratory analyses assistance, and Mike DeSantis for assistance with XRD analyses.
Footnotes
Publisher's Disclaimer: Disclaimer
The information in this article has been reviewed in accordance with the U.S. Environmental Protection Agency’s policy and approved for publication. The views expressed in this article are those of the authors and do not necessarily represent the views or the policies of EPA. Any mention of trade names, manufacturers, or products does not imply an endorsement by the U.S. Government or EPA; EPA and its employees do not endorse any commercial products, services, or enterprises. This project was supported in part by an appointment to the Research Participation Program at the Office of Research and Development, U.S. EPA, administered by the Oak Ridge Institute for Science and Education through an interagency agreement between the U.S. Department of Energy and U.S. EPA.
References
- [1].Fowler BA; Du Val G Effects of Lead on the Kidney: Roles of High-Affinity Lead-Binding Proteins. Environ. Health Perspect. 1991, 91, 77–80. DOI: 10.1289/ehp.919177. [DOI] [PMC free article] [PubMed] [Google Scholar]
- [2].Agency for Toxic Substances and Disease Registry (ATSDR). 2019. Toxicological Profile for Lead (Draft for Public Comment); Atlanta, GA: U.S. Department of Health and Human Services, Public Health Service. https://www.atsdr.cdc.gov/toxprofiles/tp13.pdf (accessed March 11, 2020). [Google Scholar]
- [3].Lanphear BP; Rauch S; Auinger P; Allen RW; Hornung RW 2018. Low-Level Lead Exposure and Mortality in US Adults: A Population-Based Cohort Study. Lancet. Public Health. 2018, 3, e177–e184. DOI: 10.1016/S2468-2667(18)30025-2. [DOI] [PubMed] [Google Scholar]
- [4].U.S. EPA. Drinking Water Regulations: Maximum Contaminant Level Goals and National Primary Drinking Water Regulations for Lead and Copper. Fed. Regist. 1991a, 40 CRF Parts 141 and 142. U. S. EPA. 56, 32112. [Google Scholar]
- [5].U.S. EPA. Maximum Contaminant Level Goals and National Primary Drinking Water Regulations for Lead and Copper. Fed. Regist. 1991b, 40 CFR Part 141, Subpart I. 56, 26460. [Google Scholar]
- [6].U.S. EPA. Final Regulatory Impact Analysis of National Primary Drinking Water Regulations for Lead and Copper (1991.W.91.E.A). 1991c, EPA. [Google Scholar]
- [7].Schock MR Understanding Corrosion Control Strategies for Lead. Journal-American Water Works Association 1989, 81, 88–100. DOI: 10.1002/j.1551-8833.1989.tb03244.x. [DOI] [Google Scholar]
- [8].NSF/ANSI. NSF International/American National Standard Institute Standard 53 – 2018. Drinking Water Treatment Units — Health Effects. 2018a, p. 172. NSF International: Ann Arbor, MI, USA. [Google Scholar]
- [9].NSF/ANSI. NSF International/American National Standard Institute Standard 42 – 2018. Drinking Water Treatment Units – Aesthetic Effects. 2018b, p. 100. NSF International: Ann Arbor, MI, USA. [Google Scholar]
- [10].Bosscher V; Lytle DA; Schock MR; Porter A; Del Toral M POU Water Filters Effectively Reduce Lead in Drinking Water: A Demonstration Field Study in Flint, Michigan. J. Environ. Sci. Health A Tox. Hazard Subst. Environ. Eng. 2019, Part A 54, 484–493. DOI: 10.1080/10934529.2019.1611141. [DOI] [PMC free article] [PubMed] [Google Scholar]
- [11].CDM Smith. Filter Result Report — City of Newark Point-of-Use Filter Study August–September 2019. 2019, p. 99. Newark, NJ. [Google Scholar]
- [12].Koeske Z More than 6 Months after Elevated Lead Levels Were Discovered in University Park, Affected Residents Still Don’t Know When They’ll Be Able to Consume Water without Restrictions. Chicago Tribune Dec. 31, 2019. [Google Scholar]
- [13].AWWA. C810-17: Replacement and Flushing of Lead Service Lines. 2017. 10.12999/AWWA.C810.17. [DOI]
- [14].Del Toral MA; Porter A; Schock MR Detection and Evaluation of Elevated Lead Release from Service Lines: A Field Study. Environ. Sci. Technol. 2013, 47, 9300–9307. DOI: 10.1021/es4003636. [DOI] [PubMed] [Google Scholar]
- [15].Ohio Environmental Protection Agency (OEPA). Control of Lead and Copper-Lead Service Line Requirements (3745-81-84). Ohio Administrative Code 2018. [Google Scholar]
- [16].Lewis CM; Couillard LA; Klappa PJ; Vandenbush TD Lead Water Service Lines: Extensive Sampling and Field Protocol Protect Public Health. JAWWA. 2017, 109, 34–41. DOI: 10.5942/jawwa.2017.109.0016. [DOI] [Google Scholar]
- [17].Deshommes E; Laroche L; Deveau D; Nour S; Prévost M Short- and Long-Term Lead Release after Partial Lead Service Line Replacements in a Metropolitan Water Distribution System. Environ. Sci. Technol. 2017, 51, 9507–9515. DOI: 10.1021/acs.est.7b01720. [DOI] [PubMed] [Google Scholar]
- [18].Lytle DA; Schock MR; Formal C; Bennett- Stamper C; Harmon S; Nadagouda M; Williams D; DeSantis M; Tully J; Pham M Lead Particle Size Fractionation and Identification in Newark, New Jersey’s Drinking Water. 2020. [DOI] [PMC free article] [PubMed] [Google Scholar]
- [19].Formal C; Lytle DA; Harmon S; DeSantis M Effect of pH, Dissolved Inorganic Carbon and Orthophosphate on the Nature of Lead Particles and Associated Solubility in Water. Presented at 2019 AWWA Annual Conference, Denver, CO., June 9-12, 2019. [Google Scholar]
- [20].Ng D-Q; Strathmann TJ; Lin Y-P Role of Orthophosphate as a Corrosion Inhibitor in Chloraminated Solutions Containing Tetravalent Lead Corrosion Product PbO2. Environ. Sci. Technol. 2012, 46, 11062–11069. DOI: 10.1021/es302220t. [DOI] [PubMed] [Google Scholar]
- [21].Grimes SM; Johnston SR; Batchelder DN Lead Carbonate–Phosphate System: Solid–Dilute Solution Exchange Reactions in Aqueous Systems. Analyst 1995, 120, 2741–2746. DOI: 10.1039/AN9952002741. [DOI] [Google Scholar]
- [22].Thomas E Newark Handing Out Bottled Water as Filters Appear to Fail to Protect Residents from Lead. ABC News. August 12, 2019. https://abcnews.go.com/Politics/newark-handing-bottled-water-filters-fail-protect-residents/story?id=64925237. [Google Scholar]