

Abstract
Aims
A blood pressure (BP)-independent metabolic shift towards a catabolic state upon high sodium (Na+) diet, ultimately favouring body fluid preservation, has recently been described in pre-clinical controlled settings. We sought to investigate the real-life impact of high Na+ intake on measures of renal Na+/water handling and metabolic signatures, as surrogates for cardiovascular risk, in hypertensive patients.
Methods and results
We analysed clinical and biochemical data from 766 consecutive patients with essential hypertension, collected at the time of screening for secondary causes. The systematic screening protocol included 24 h urine (24 h-u-) collection on usual diet and avoidance of renin–angiotensin–aldosterone system-confounding medications. Urinary 24 h-Na+ excretion, used to define classes of Na+ intake (low ≤2.3 g/day; medium 2.3–5 g/day; high >5 g/day), was an independent predictor of glomerular filtration rate after correction for age, sex, BP, BMI, aldosterone, and potassium excretion [P = 0.001; low: 94.1 (69.9–118.8) vs. high: 127.5 (108.3–147.8) mL/min/1.73 m2]. Renal Na+ and water handling diverged, with higher fractional excretion of Na+ and lower fractional excretion of water in those with evidence of high Na+ intake [FENa: low 0.39% (0.30–0.47) vs. high 0.81% (0.73–0.98), P < 0.001; FEwater: low 1.13% (0.73–1.72) vs. high 0.89% (0.69–1.12), P = 0.015]. Despite higher FENa, these patients showed higher absolute 24 h Na+ reabsorption and higher associated tubular energy expenditure, estimated by tubular Na+/ATP stoichiometry, accordingly [Δhigh–low = 18 (12–24) kcal/day, P < 0.001]. At non-targeted liquid chromatography/mass spectrometry plasma metabolomics in an unselected subcohort (n = 67), metabolites which were more abundant in high versus low Na+ intake (P < 0.05) mostly entailed intermediates or end products of protein catabolism/urea cycle.
Conclusion
When exposed to high Na+ intake, kidneys dissociate Na+ and water handling. In hypertensive patients, this comes at the cost of higher glomerular filtration rate, increased tubular energy expenditure, and protein catabolism from endogenous (muscle) or excess exogenous (dietary) sources. Glomerular hyperfiltration and the metabolic shift may have broad implications on global cardiovascular risk independent of BP.
Keywords: Salt, Hypertension, Kidney, Glomerular hyperfiltration, Metabolism
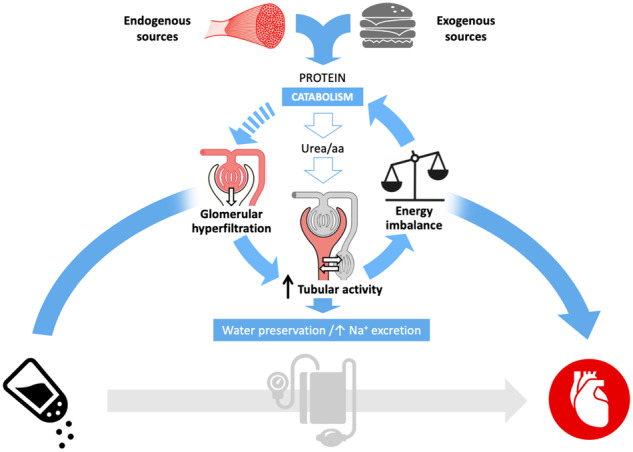
Graphical Abstract
1. Introduction
A close association between sodium (Na+) and blood pressure (BP) is well recognized, although BP response to increased or reduced sodium intake (salt sensitivity) varies across populations and individuals.1–4 The rationale for World Health Organization reduced sodium intake recommendations is based on the predicted benefit in terms of incidence of cardiovascular events that would follow a population-level decrease in BP.3,5 While there is reasonable agreement that high salt intake (generally identified as > 5 g Na+/day) is associated with worse outcomes, there is no consensus on the optimal range of intake and the role for its effect on BP as the sole causal determinant of cardiovascular events has not been proved.6–9
Recently, an independent link between high Na+ intake and a shift in metabolism has been suggested, whereby a catabolic state induced by Na+ would ultimately serve preservation of body water. In particular, in the experimental setting of a long-term salt balance study in 10 healthy male subjects simulating a space flight, Rakova et al.10 demonstrated that endogenous water generation and accrual prevented extra water intake upon high salt diet. Further mechanistic insights from a rodent study pointed to urea excess as a key osmotic force to minimize water loss.11 This was achieved by renal urea recycling and extrarenal endogenous generation, via a salt-driven catabolic state. Based on evidence of increased 24 h-u-glucocorticoids excretion in both humans and mice, the authors suggested hypercortisolism to mediate this metabolic shift.10,11
These mechanisms, which would lead to increased cardiovascular risk regardless of BP salt-sensitivity, lack demonstration in humans out of a dietary- and environmentally controlled experimental setting.
This study sought to investigate the impact of high salt intake on renal Na+/water handling and metabolism in real-life in hypertensive patients undergoing systematic biochemical screening for secondary causes of hypertension following a pre-defined standardized protocol. We herein report the results for the large cohort of patients who received a final diagnosis of essential hypertension.
2. Methods
An expanded version is available in the Supplementary material online.
2.1 Patients and diagnostic protocol
The study included clinical and biochemical data from consecutive patients referred to the tertiary Hypertension Center of the University of Padua, who underwent a biochemical screening for secondary causes of hypertension and provided informed written consent (2012–17; local biobank Prot.1925P/2009; international ENSAT-HT network, http://www.ensat-ht.eu/, local approval prot. 3998/AO/16; in compliance with the Declaration of Helsinki). The screening entailed plasma electrolytes, aldosterone, renin, cortisol, 24 h-u-Na+, and K+ excretion; additional biochemical data, including renal function, 24 h creatinine excretion, 24 h urinary catecholamines/metanephrines, and urinary free cortisol were measured as recommended by guidelines.12–15 Patients were not instructed to change their usual dietary habits before the screening. They were asked to undertake a 24 h-u-collection on the day before and to bring the entire volume on the morning of blood sampling, which was performed after 1 h in supine position, between 8 and 10 a.m. If patients were already treated, screening was performed after appropriate washout from agents affecting the renin–angiotensin–aldosterone system and switch to calcium channels blockers and/or doxazosin, as per guidelines,13 unless contraindicated. Exclusion criteria entailed reported/biochemical evidence of oral, intramuscular or intravenous steroid use or abuse and cases with a final diagnosis of secondary hypertension after appropriate work-up (biochemistry, anatomical/functional imaging, adrenal/renal vein sampling), and follow-up at the time of data-lock (1 January 2019). Patients with a conclusive diagnosis of essential hypertension were grouped according to classes of Na+ intake. Intake estimates were based on 24 u-Na+-excretion, which has limitations when applied to a single subject16 but is only minimally affected by within-individual day-to-day variability when applied to groups with sufficient number of participants included.17 Intakes were defined as low ≤2.3 g Na+/day (100 mmol/day); medium 2.3–5 g Na+/day; high >5 g Na+/day (216 mmol/day; Supplementary material online, Figure S1), according to commonly used cut-offs.18,19
2.2 Laboratory methods
Plasma and urinary electrolytes, plasma renin, aldosterone and cortisol, and additional biochemistry as appropriate and detailed above, were measured at the time of the secondary hypertension screening in an International Standard Organisation (ISO) 15189:2012 accredited clinical laboratory (University of Padua) by routine methods. Normal values and within‐ and inter-assay coefficient of variation for aldosterone and renin, as well as aldosterone-to-renin ratio (ARR) criteria for primary aldosteronism and further diagnostic work-up have already been reported13,20,21 and are recapitulated in the Supplementary material online. Plasma cortisol concentration was measured by a chemiluminescence competitive immunoassay and urinary 24 h free cortisol (UFC) by a liquid chromatography–mass spectrometry (LC-MS)/MS, as described in detail elsewhere.22,23 Urinary catecholamines and metanephrines were measured by HPLC with electrochemical detection with a CE-IVD kit (see Supplementary material online).
Plasma and 24 h urinary urea and creatinine were not routinely determined in all screened patients; the available biochemical dataset was expanded by analysing urine samples stored in the local biobank since the time of the screening and validating the results against the original dataset according to Passing and Bablok method (Supplementary material online, Figures S2–S4 and Table S1).
2.3 Renal function and energetics
Urine samples collected over the 24 h immediately before plasma sampling were used for estimation of glomerular and tubular function, according to standard equations. In particular, glomerular filtration rate (GFR) was estimated by 24 h creatinine clearance and also by the CKD-EPI formula.24 Tubular Na+ handling was assessed by fractional excretions (FEs) (i.e. the percentage of the filtered amount that is excreted), as well as the absolute amount of filtered, reabsorbed, and excreted Na+ (mmol/day). FE of water (FEWater) was calculated as urine flow rate/GFR. Estimated tubular energy expenditure (kcal/day) was calculated based on a tubular 4.6 Na+/ATP stoichiometry and the free energy equivalent of ATP.25
2.4 Metabolomics
Available EDTA-plasma samples from a non-selected sub-cohort of patients in the low and the high Na+ intake groups, stored in Padua biobank from the time of screening, were extracted with chloroform/methanol/water (1:3:1 v/v) and stored at −80°C until analysis by LC-MS. Briefly, samples were eluted on a hydrophilic interaction LC column (ZIC-pHILIC, Merck) and analysed on a Thermo Q-Exactive (Thermo Scientific), operated in polarity switching mode to record both positive and negative ionization mode data for each sample. A pooled sample, prepared by combining an aliquot from each individual sample, was injected every 5th injection to confirm the stability of the analysis. The raw MS data were processed in a non-targeted way, using a pipeline consisting of XCMS (peak picking) and MZMatch (grouping and filtering).26–30
2.5 Statistics
Categorical variables are presented as absolute numbers and percentages and compared by χ2 test. Quantitative variables were tested for normal distribution in the whole cohort and in individual groups by graphical plot and Kolmogorov–Smirnov test; they are presented as mean±SD, or median and inter-quartile range in case of a skewed distribution. Parametric and nonparametric statistics were used for normally and non-normally distributed variables, respectively. In particular, one-way analysis of variance (ANOVA) or Kruskal–Wallis test was used to compare anthropometric, clinical, and biochemical data across study groups, with Tukey or Dunn’s as post hoc tests, as appropriate; crude correlations were ascertained by Pearson or Spearman tests.
Multivariable-adjusted comparisons (ANCOVA) and linear regression models included significant covariates identified at comparison of Na-intake groups, that is, age, sex, BMI, aldosterone, and systolic BP, upon appropriate transformation to attain normal distribution. Little’s missing completely at random (MCAR) test was used beforehand to test the assumption that variables were missing completely at random, including the above covariates and urinary (u-) Na+ excretion in the analysis; no imputation methods were adopted and missing data were excluded, with valid numbers for each analysis reported in the manuscript.
Slopes of the regression lines for FEs, assessing tubular Na+ and water handling, were compared between high and low Na+ intake groups using the extra-sum-of-squares F test, with automatic outliers exclusion (conservative Q for ROUT approach set at 0.5%) and normality of residuals confirmed with Kolmogorov–Smirnov test.
For metabolomics, the intensity of peaks with a matching database formula31 was log-transformed and t-test comparisons were conducted between high and low Na+ intake groups, using a moderated linear model. The P-values for the targeted and non-targeted analysis were corrected to control the false discovery rate.32
The α level was set at 0.05 and all statistical tests were 2-tailed. SPSS (version 25, IBM) and Prism (version 8.02, GraphPad Software) were used for the analysis.
3. Results
3.1 Cohort characteristics
Out of 1464 patients, we excluded 592 in whom washout of confounding medications was not possible and 106 who received a final diagnosis of secondary hypertension (Supplementary material online, Figure S1). The final study cohort therefore included data from 766 patients, almost exclusively of Caucasian ethnicity. Their clinical and biochemical general characteristics by Na+ intake groups are reported in Table 1. Of note, pre-defined 24 u-Na+ cut-off values for group allocation closely approximated the extreme quintiles of the distribution (102 and 219 mmol/day for 20th and 80th percentile, respectively).
Table 1.
Clinical and biochemical characteristics of patients, by Na+ intake group
| n valid | Whole cohort | Low-Na+ (n = 146) | Medium-Na+ (n = 464) | High-Na+ (n = 156) | P | |
|---|---|---|---|---|---|---|
| Age (years) | 766 | 47±13 | 47±13 | 47±13 | 44±13*,† | 0.015 |
| Sex (M; n/%) | 766 | 428/55.9 | 49/33.6 | 248/53.4* | 132/84.1*,† | <0.001 |
| BMI (kg/m2) | 537 | 25.6 (23.0–29.0) | 24.1 (21.0–27.4) | 25.7 (23.2–29.1)* | 26.7 (24.5–29.8)*,† | <0.001 |
| SBP (mmHg) | 647 | 150±18 | 153±20 | 149±18 | 149±15 | 0.165 |
| DBP (mmHg) | 647 | 93±10 | 93±10 | 93±10 | 94±11 | 0.801 |
| Medications | ||||||
| None (n/%) | 766 | 138/18.0 | 27/18.5 | 89/19.2 | 22/14.0 | 0.356 |
| Dihydropiridine CCB (n/%) | 766 | 444/58.0 | 82/56.2 | 261/56.3 | 102/65 | 0.158 |
| Non-dihydropiridine CCB (n/%) | 766 | 160/20.9 | 30/20.5 | 103/22.2 | 27/17.2 | 0.427 |
| α-blockers (n/%) | 766 | 173/22.6 | 24/16.4 | 102/22.0* | 47/29.9*,† | 0.016 |
| Diabetes (n/%) | 630 | 24/3.8 | 4/3.3 | 15/4.0 | 5/3.6 | 0.927 |
| Chronic kidney disease (n/%) | 645 | 24/3.7 | 4/3.3 | 18/4.7 | 2/1.4 | 0.222 |
| p-Na+ (mmol/L) | 675 | 141±2 | 141±2 | 141±2 | 141±2 | 0.650 |
| p-K+ (mmol/L) | 703 | 4.0±0.4 | 4.0±0.4 | 4.1±0.4 | 4.0±0.4 | 0.070 |
| PAC (pmol/L) | 766 | 241 (183–340) | 265 ( 189–386) | 232 (182–323)* | 254 (174–344)* | 0.040 |
| PRA (ng/mL/h), 2012–15 | 313 | 0.64 (0.33–1.26) | 1.00 (0.29–1.50) | 0.61 (0.30–1.21) | 0.62 (0.41–1.17) | 0.361 |
| DRC (mIU/L), 2015–17 | 452 | 7.9 (3.3–14.8) | 9.5 (4.1–15.9) | 7.7 (3.1–13.6) | 7.6 (2.7–15.7) | 0.155 |
| ARRPRA (ng/dl/ng/mL/h) | 313 | 15.9 (9.1–29.4) | 14.9 (9.1–29.7) | 16.5 (8.2–31.2) | 15.7 (9.8–24.7) | 0.823 |
| ARRDRC (ng/dl/mIU/L) | 452 | 1.09 (0.61–2.25) | 0.99 (0.62–2.00) | 1.14 (0.62–2.46) | 1.03 (0.53–2.15) | 0.514 |
| 24h-u-Diuresis (L/day) | 766 | 1.8 ( 1.4–2.3) | 1.5 (1.0–2.1) | 1.8 (1.4–2.3)* | 2.0 (1.6–2.4)*,† | <0.001 |
| 24h-u-Na+ (mmol/day) | 766 | 155 (112–205) | 80 (66–92) | 154 (128–183)* | 252 (236–294)*,† | <0.001 |
| 24h-u-K+ (mmol/day) | 766 | 60 (48–77) | 49 (38–65) | 60 (48–74)* | 73 (61–90)*,† | <0.001 |
n valid, number of patients with available information; BMI, body mass index; SBP and DBP, systolic and diastolic blood pressure, respectively; CCB, calcium channel blockers; p-, plasma; 24 h-u-, 24 h urine; PAC, plasma aldosterone concentration; PRA, plasma renin activity; DRC, direct renin concentration; ARR, aldosterone-to-renin ratio.
Post hoc tests: P < 0.05 versus low-Na+; †P < 0.05 versus medium-Na+.
Patients on high Na+ intake were generally younger, had a higher BMI and similar BP values, although more frequently required doxazosin on top of a first-line calcium channel blocker, compared with other Na+ groups. Prevalence of diabetes and/or CKD (KDIGO stage ≥ 3) in the cohort was low (<4% for both) and did not differ across study groups.
While plasma Na+ and K+ did not differ, plasma aldosterone was higher with low Na+ intake (P = 0.040). Renin showed a similar trend, which reached statistical significance upon correction for age and sex, significant predictors at multivariate regression analysis (Supplementary material online, Tables S2 and S3 and Figures S5 and S6). Overall, the ARR did not differ across study groups. In the 24 h urine, higher Na+ excretion was paralleled by a higher K+ excretion and total urinary volume (P < 0.001 for both).
3.2 Renal Na+ and water handling
We first tested the association between the FEs of Na+ and water (n = 282, Little’s MCAR test Sig. = 0.185 and n = 303, Sig. = 0.163, respectively), as expression of the traditional osmotic natriuresis mechanism challenged by Rakova et al.10 In the context of an expected positive correlation (Spearman ρ = 0.402, P < 0.001), the slope of the regression line was steeper at low compared to high salt intake (P = 0.005; Figure 1A). In fact, the FE of Na+ increased with increasing Na+ intake [P < 0.001 across groups; post hoc low vs. high: 0.39% (0.30–0.47) vs. 0.81% (0.73–0.98), P < 0.001] while that of water decreased [P = 0.016 across groups; post hoc low vs. high: 1.13% (0.73–1.72) vs. 0.89% (0.69–1.12), P = 0.015; Figure 1B]. No such difference was observed for K+ FE (P = 0.892).
Figure 1.

Renal Na and water handling upon differential Na+ intake. (A) The positive association between Water and Na+ fractional excretions (FE) reflects he osmotic effect of Na+, driving a parallel excretion of accompanying water (ntot = 282); however, the slope of this association is steeper at low (white dots; n = 61) compared to high (red dots; n = 63) Na+ intake [1.62 (95% CI: 1.14–2.09) vs. 0.81 (95% CI: 0.56–1.06), respectively; P = 0.005, extra-sum-of-squares F test; X indicate automatically excluded outliers (ROUT approach, Q = 0.5%) from high and low Na+ intake groups]. (B) With increasing Na+ intake, Na+ FE increases while water FE decreases (Kruskall–Wallis test: P < 0.001 and P = 0.017, respectively; Dunn’s post hoc test results on top of bars); no significant difference across groups was noted for K+. Cases are the same as for panel A; n > 60 per bar. Data are shown as median and IQR; *P < 0.05, **P < 0.01; ****P < 0.0001.
To dissect the determinants of the above differences, we compared GFRs and absolute measures of tubular activity across study groups.
3.3 Excess Na excretion is paralleled by glomerular hyperfiltration
In keeping with evidence of a higher excretion of creatinine in the 24 h, BSA-corrected (and uncorrected) creatinine clearance was greater in high than in medium- and low-Na+ intake (P < 0.001 across groups; n = 249; Little’s MCAR test Sig. = 0.221; Table 2). In the high Na+ group 36.7% of the patients met the definition of ‘glomerular hyperfiltration’ according to a commonly used cut-off (135 mL/min/1.73 m2),33,34 compared to 16.4% and 8.2% in the medium and low Na+ intake group, respectively (χ2, P < 0.001). Similar trends were confirmed with use of CKD-EPI formula, although with lower estimates of eGFR and of glomerular hyperfiltration prevalence, accordingly (Table 2 and Supplementary material online, Table S4).
Table 2.
Renal function by Na+ intake group
| n valid | Whole cohort | Low-Na+ | Medium-Na+ | High-Na+ | P | p adj | |
|---|---|---|---|---|---|---|---|
| p-Creatinine (μmol/L) | 664 | 73 (63–84) | 69 (59–78) | 73 (63–84)* | 75 (68–85)* | 0.002 | 0.027 |
| u-Creatinine (mmol/L) | 325 | 7.0 (5.0–10.4) | 5.7 (4.1–9.4) | 6.7 (4.6–10.3) | 9.1 (6.3–10.5)*,† | 0.001 | <0.001 |
| 24h u-Creatinine excretion (mmol/day) | 325 | 12.0 (8.8–15.6) | 8.8 (7.1–11.9) | 11.7 (8.9–15.3)* | 16.0 (13.9–19.7)*,† | <0.001 | <0.001 |
| Estimated GFR: | |||||||
| Creatinine clearance (mL/min) | 303 | 119.2 (93.0–151.1) | 100.5 (75.1–117.8) | 116.6 (91.7–142.4)* | 150.3 (125.6–178.1)*,† | <0.001 | <0.001 |
| Creatinine clearance/BSA (mL/min/1.73 m2) | 249 | 108.6 (86.7–128.8) | 94.1 (69.9–118.8) | 103.8 (86.9–126.0)* | 127.5 (108.3–147.8)*,† | <0.001 | <0.001 |
| Glomerular hyperfiltration—n/tot (%) | 48/249 (19.3) | 5/61 (8.2) | 21/128 (16.4) | 22/60 (36.7)*,† | <0.001 | ||
| eGFR—CKD-EPI (mL/min/1.73 m2) | 664 | 98.4 (86.6–107.6) | 98.8 (86.8–106.0) | 97.0 (85.4–106.3) | 100.8 (91.4–111.7)*,† | 0.001 | 0.02 |
| Glomerular hyperfiltration—n/tot (%) | 8/664 (1.2) | 0/122 (0) | 3/405 (0.7) | 5/137 (3.6)* | 0.011 | ||
| p-Urea (mmol/L) | 498 | 4.8 (4.0–5.7) | 4.7 (4.0–5.6) | 4.7 (3.9–5.6) | 5.1 (4.2–6.1)† | 0.026 | 0.724 |
| u-Urea (mmol/L) | 173 | 196.6 (127.2–271.3) | 145.5 (100.3–237.4) | 177.4 (125.9–257.8) | 260.2 (177.9–314.1)*,† | 0.001 | 0.015 |
| 24h-u-Urea excretion (mmol/day) | 173 | 337.5 (239.6–499.0) | 242.9 (178.3–343.0) | 332.1 (244.8–453.9)* | 496.8 (373.0–610.6)*,† | <0.001 | <0.001 |
p-, plasma; u-, urine; GFR, glomerular filtration rate; BSA, body surface area; padj, analysis of variance adjusted for age, sex, systolic blood pressure, BMI, and aldosterone.
Post hoc tests: P < 0.05 versus low-Na+; †P < 0.05 versus medium-Na+.
An independent association between 24 h urinary Na+ excretion and creatinine clearance was confirmed at multivariate regression analysis, after correction for age, sex, systolic BP, BMI, and aldosterone (P < 0.001). In a regression model including also 24 h urinary K+, as an independent surrogate marker for global food intake based on the above demonstration of a constant tubule handling, both variables remained significant predictors (P = 0.003 and P < 0.001, respectively; Supplementary material online, Tables S5 and S6).
3.4 High Na+ intake increases tubular reabsorption and renal energy expenditure
Although the FE was higher with high Na+ intake, the total amount of Na+ filtered by the glomerulus and reabsorbed by the tubules per day was far larger compared to medium and low Na+ intake (P < 0.001, regardless of adjustment for the above covariates, including stratification by sex; Figure 2A and Supplementary material online, Table S4).
Figure 2.
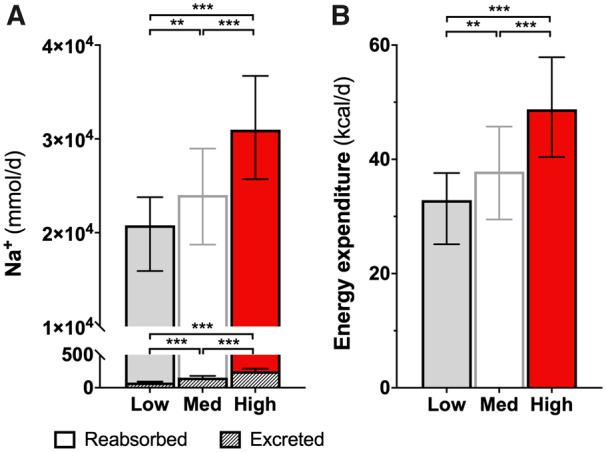
Absolute Na+ excretion and reabsorption and energy cost. (A) The total excreted Na+ (shaded bars) is a trivial proportion of the reabsorbed amount; the latter is much higher upon high Na+ intake and resulted in 18 kcal of estimated excess energy expenditure per day (B). Data are shown as median and IQR; ntot = 282, nlow Na = 61, nhigh Na = 63. Kruskall–Wallis and Dunn’s post hoc tests: **P < 0.01; ***P < 0.001.
The estimated energy cost for this excess reabsorptive tubular activity is shown in Figure 2B [Δ high vs. low Na+ intake groups = 18 (12–24) kcal/day; P < 0.001].
Urinary norepinephrine excretion, as a surrogate measure of renal sympathetic nerve activity contribution to tubular Na+ reabsorption,35,36 increased across groups of Na+ intake (P < 0.001) and was independently associated with 24 h-u-Na+ excretion (Supplementary material online, Figure S7 and Tables S7–S10).
3.5 Re-setting of nitrogen balance and metabolic signatures
While 24 h-urine excretion data suggested a higher daily loss of both creatinine and urea with high Na+ intake (P ≤ 0.001 for both), plasma values increased or did not differ, respectively (Table 2). No difference in the FE of urea was observed across groups (P = 0.724). Overall, this suggested a global re-setting of the nitrogen balance.
Analysis of non-targeted metabolomics showed that the majority of metabolites significantly increased in the high Na+ (n = 35) compared to low Na+ group (n = 32) entailed intermediates or end products of protein catabolism (i.e. dipeptides, single amino acids, or their derivatives) or urea cycle (N-acetyl-l-glutamate 5-semialdehyde: fold change = 1.52, pcorr = 0.02; Figure 3B). In particular, plasma levels of all detectable amino acids (including the branched-chain leucine, isoleucine, and valine and with the exception of few conditionally essential or non-essential amino acids) were increased with high Na+ intake (Figure 3B).
Figure 3.

Metabolomics signature. (A) Volcano plot showing the metabolomics comparison between high and low (reference) Na+ intake (ntot = 67 subjects; nlowNa = 32, nHighNa = 35). Y-axis: uncorrected P-values; curved lines: multiple comparisons-corrected significance (pcorr<0.05). Red dots: intermediates/end products of the urea cycle or protein catabolism; empty dots: other identified metabolites (Supplementary material online, Table S11). (B) Comparative profile of plasma amino acids LC/MS signals (mean, 95% CI); for visualization, the x scale was made homogeneous by Z-score transformation, based on mean and SD from the low Na+ group, as a reference; n = 35 (high Na). Background: white = essential amino acids; light grey = conditionally essential, dark grey = dispensable amino acids. Bars: dashed for branched-chain amino acids; red for significance (pcorr < 0.05). Peaks for asparagine, cysteine, glutamine, and methionine could not be unequivocally identified. For all statistical comparisons, log-transformed peak intensities of the n = 67 subjects were compared by t-tests with a false discovery rate correction.
Other significantly increased metabolites identified by the non-targeted approach included products of triglycerides and fatty acid metabolism (diacylglycerols and acyl-glycines), acyl-carnitines, and some industrial food/tobacco-related compounds (Figure 3A). A complete list of significantly different metabolites is provided in the see Supplementary material online, Table S11.
While no obvious shift in carbohydrate metabolism was observed at metabolomics analysis, higher Na+ intake was associated with higher plasma glucose [n = 171; high Na+: 4.9 (4.6–5.4) mmol/L, medium Na+: 4.7 (4.3–5.0) mmol/L, low Na+: 4.5 (4.2–5.0) mmol/L; P = 0.004] and insulin [n = 47; high Na+: 7.46 (4.75–11.80) µU/mL, medium Na+: 5.81 (3.79–9.24) µU/mL, low Na+: 4.89 (3.72–8.04) µU/mL; P = 0.001]; however, these associations did not persist at multivariable analysis, where BMI stood out as the strongest common independent predictor (r = 0.38, P = 0.002 and r = 0.48, P < 0.001, respectively; Supplementary material online, Tables S12–S15).
3.6 Excess cortisol excretion upon high Na+ intake
We additionally explored whether cortisol excess could be a primary drive for muscle catabolism upon high Na+ intake, as suggested previously.11 In our study, UFC increased across groups of Na+ intake [n = 137, Little’s MCAR test Sig. = 0.161; low Na+: 63 (36–72) nmol, medium Na+: 60 (47–86) nmol, high Na+: 86 (75–139) nmol; P < 0.001]. The positive association of UFC with 24 h-u-Na+ excretion persisted at multivariable analysis after correction for age, sex, systolic BP, BMI, and aldosterone (P = 0.017), and also for creatinine clearance (P = 0.035); however, the latter stood out as the strongest independent predictor (P < 0.001; Supplementary material online, Tables S16 and S17).
Morning plasma-cortisol showed an opposite trend [n = 658; low Na+: 246 (203–309) nmol/L, medium Na+: 238 (194–294) nmol/L, high Na+: 217 (171–294) nmol/L; P = 0.047]; no independent association with 24 h-u-Na+ was observed (P = 0.284; Supplementary material online, Tables S18 and S19).
4. Discussion
Our study examined the hypothesis that high Na+ intake could induce mechanisms of water preservation and adversely affect metabolic signatures, surrogates for global cardiovascular risk, in a large real-life population of hypertensive patients. This idea was first proposed by Titze et al.10,11 based on the diet-controlled experimental settings of a rodent study and a long-term simulated space flight of 10 healthy subjects. Our results, obtained under normal dietary conditions and salt excretions comparable to those reported in other populations,17 showed that the higher excretion of Na+ was indeed coupled with a higher excretion of water, in keeping with the classic concept of osmotic natriuresis. However, we identified opposite trends relative to their filtered amount: while the FE increased for Na+ upon high Na+ intake, it decreased for water and this was paralleled by a plasma metabolomic signature consistent with protein catabolism and with the results obtained by Titze et al. in rodent models. These findings indicate that kidneys can effectively dissociate Na+ and water handling upon high Na+ intake and that the associated catabolic state, likely participating in this water preservation mechanism, could independently affect the risk of cardiovascular disease.
Previous clinical studies suggested a different body water handling, assessed as body weight change and diuretic response upon salt load and depletion, between salt-sensitive and salt-resistant (insensitive) subjects.37 Our study, albeit lacking a formal assessment of salt sensitivity, rather focused on the renal-specific differential regulation of Na+/water excretion and its correlates, independently of BP (Supplementary material online, Tables S5 and S6). Such fine regulation relies upon a larger amount of processed urine and a higher GFR. A recent meta-analysis identified this association also in interventional trials,38 but was limited in its conclusions by the heterogeneity in study designs, populations, and approaches to estimation of GFR. In the present study, we employed a standardized screening approach and a rigorous protocol that included washout of confounding medications, the use of 24 h urine collections for the assessment of both Na+ and creatinine excretion and non-targeted metabolomics. In a large sample size, we showed that a considerable proportion of patients exhibit glomerular hyperfiltration upon high Na+ intake: although estimates differ depending on the method used for GFR assessment,24 this proportion is consistently higher compared to both medium and low Na+ groups. Glomerular hyperfiltration, traditionally linked to obesity and diabetes,33 is a recognized marker of early kidney damage, precedes microalbuminuria and/or decline in renal function and predicts cardiovascular events.34 Our study suggests Na+ intake, independent of BP values and of a surrogate for total food consumption, as a key determinant in the pathogenesis of glomerular hyperfiltration in hypertension, thus confirming previous suggestions from a smaller study.39
While higher filtration carries the ultimate advantage of more precise distal regulation of solutes,40 not only has it negative long-term prognostic implications but also comes at the cost of a much higher tubular activity at more proximal segments (Figure 2). The increase in Na+ reabsorption in response to the increased filtered Na+ load is known as glomerulo-tubular balance and is primarily active via Na+/K+ ATPase, with ancillary passive mechanisms facilitated by changes in tubular, interstitial, and capillary physical forces. The extra Na+/K+ ATPase activity implicates a higher oxygen and energy consumption.41 Pruijm et al.42 found that one week of high-Na+ diet reduced renal medullary oxygenation in both normotensive and hypertensive subjects by using blood oxygen level-dependent (BOLD) MRI, thus pointing to a higher oxygen extraction by tubular cells, which ultimately supports our contentions.
Our estimate of the excess energy cost upon high versus low Na+ intake was 18 kcal. This is a rough (potentially over- or under-) estimate, based on a stoichiometry value that averages different tubular segments with different activity and was validated in ‘standard’ conditions.25 Albeit imprecise, it offers an order of magnitude that corresponds approximately to 4.5 g of protein or 2 g of fat per day. These values should be considered in a lifespan or population perspective. Of note, with the due haemo- and tubule-dynamic corrections required between species, the magnitude of this energy cost well justifies the weight loss observed in high Na+-fed mice when their total caloric food intake was paired with low Na+-fed controls.11 In that animal model, the catabolic state primarily oriented towards protein degradation and muscle loss served to generate both endogenous water and osmotically active urea. Overall, these mechanisms allowed water preservation against Na+ excess and a potentially volume-depleting osmotic diuresis.11 In our study, a similar re-setting in nitrogen balance was observed: along with evidence of massive excretions of urea and creatinine upon high Na+ intake, we identified a catabolic signature at non-targeted metabolomics, mostly entailing intermediates or end products of the urea cycle or protein catabolism. In particular, plasma levels of all the identifiable essential amino acids were increased, thus ruling out endogenous generation or the sole renal recycling as sources for their excess. To the best our knowledge, this is the first metabolomics approach to the topic of salt balance in humans.
Based on the increase in 24 h urinary glucocorticoid excretion upon high Na+ diet, Titze et al. suggested a Na+-induced subclinical hypercortisolism as the intermediate determinant of the above catabolic state.10,11 In our human cohort, we could not confirm a cortisol increase in plasma. The UFC excretion, although increased and independently associated with Na+ excretion, had GFR as its strongest predictor and its increase was clinically trivial, particularly when GFR-adjusted. This appears in keeping with human physiological studies assessing the renal clearance of plasma cortisol,43 or UFC excretion in other glomerular hyperfiltration-associated conditions, like obesity44 or simple water load.45 In fact, only subtle increases in adrenal cortisol secretion in response to Na+ loading, possibly due to the cross stimulation of the hypothalamic–pituitary–adrenal axis by the water-preserving vasopressin,46 were observed by Ehrlich et al.47 despite marked changes in urinary excretion. As discussed above, we propose that glomerular hyperfiltration and the consequent glomerulo-tubular balance per se would suffice to induce extra energy requirements and the development of a catabolic state.
The main limitation of our study is its cross-sectional nature, unsuitable to prove causality. However, mechanistic evidence of a metabolic shift had already been provided in preclinical models11 and our study has the advantage to offer a perspective on real-life, where caloric and/or water intake is not restricted or fixed. Obviously, this prevented discrimination as to how this energy cost, predominantly but not exclusively in the form of protein, was paid. Although the association between Na+ intake and renal haemodynamics/energetics was independent of K+ excretion, a crude surrogate for total food intake, this could reflect catabolism of either endogenous (muscle mass) or exogenous (dietary excess) sources. Based on the higher BMI and a larger urea clearance in our high Na+ group, we speculate that both options could be exploited to different degrees in different individuals, according to multiple determinants. These would include cultural and socio-economical aspects, favouring or limiting food access. In this regard, the per-protocol controlled caloric intake in the 10 healthy male cosmonauts could account for the reduced excretion and increased recycling of urea observed in the original study by Rakova et al.,10 but not in our real-life cohort. Similarly, it could account for the discrepancy of those preclinical data with the recent findings by Juraschek et al.,48 who found increased thirst upon high Na+ diet in a secondary analysis of the randomized DASH-Sodium trial, where caloric intake was not fixed. Juraschek et al. also provided reassurance against a putative weight gain effect of low salt intake, if endogenous sources were the only available for Na+-induced catabolism. At variance, they could not draw definite conclusions regarding high Na+ intake, since the trial failed at adjusting the energy intake of participants to maintain a stable weight, further confounded by unmeasured fluid retention.
Overall, the importance of an altered caloric balance is such that the excess exploitation of exogenous protein sources would ultimately result in excess fat deposition regardless of food relative composition.49 Therefore, excess food consumption and lean mass loss, alternative or complementary sources for the catabolic state observed in our study, are both likely to favour a long-term adverse insulin-resistant metabolic phenotype, universally associated to worse cardiovascular outcomes (please see Graphical Abstract).
Additional limitations of the study include: use of a single 24 h urine collection, which might not accurately estimate an individual’s usual long-term daily sodium intake; missing data that potentially reduced the power of some analyses, for example, for UFC; the lack of a formal BP ‘salt-sensitivity’ assessment in the protocol, as mentioned, as well as the ethnicity distribution of our almost exclusively Caucasian cohort, which might require validation in other groups like African–Americans. However, estimates of intake by 24 h urine collections in properly sized groups are not significantly affected by random variability across individuals,17 particularly when they are not instructed to artificially change their dietary habits. Moreover, use of the same 24 urine samples for the assessment of all renal handling parameters provides an intra-patient control, with all fluctuations going in the same biological direction and, overall, levelling off in large numbers. Finally, absence of evidence of systematic bias and strong statistical significance for most of our results makes type II error or any considerable impact of missing data on the overall message unlikely.
In conclusion, our results confirmed the activation of water-preserving mechanisms upon high Na+ intake in a large real-life cohort of patients with essential hypertension. These mechanisms appear to involve glomerular hyperfiltration, enhanced glomerulo-tubular balance, increased tubular energy expenditure, and protein catabolism, with broad implications on cardiovascular risk. The preferential endogenous or exogenous source of protein to compensate for these energy costs in different subjects/populations remains to be established in interventional studies, where caloric intake is controlled but not restricted. However, it is already tempting to speculate that specific dietary strategies and/or novel medications like SGLT-2 inhibitors, reducing both glomerular hyperfiltration and the energy-demanding tubular Na+ reabsorption, could favourably impact the metabolic consequences of excess Na+ intake and the global risk profile of hypertensive patients.
Summary (graphical abstract): High salt intake is traditionally linked to cardiovascular risk via its effect on blood pressure (BP, in grey). Preclinical studies recently described a metabolic shift toward catabolism upon high sodium (Na+) diet, ultimately favouring body water preservation and possibly impacting cardiovascular risk, irrespective of BP. In a large cohort of hypertensive patients we confirmed that kidneys preserve water and excrete sodium excess upon high salt intake; this was associated with glomerular hyperfiltration, higher tubular workload and a plasma metabolomic signature suggestive of protein catabolism. Muscle loss and/or excess food consumption, paralleled by adverse renal haemodynamics in a putative vicious circle, could represent a novel BP-independent link between salt intake and cardiovascular disease.
Data availability
Access to fully deidentified data generated or analysed during this study can be provided upon reasonable request from qualified researchers trained in human subject confidentiality protocols.
Translational perspective
We herein show that high Na intake can adversely impact not only blood pressure control but also renal function and metabolic balance in hypertensive patients. At variance with experimental preclinical studies, the catabolism of proteins appears to include also exogenous sources. Interventional studies where caloric intake is controlled but not restricted may identify preferential metabolic handling in different subjects/populations and test the effect of specific dietary strategies. Similarly, the potential benefit of medications like sodium–glucose cotransporter (SGLT)-2 inhibitors, which are known to reduce both glomerular hyperfiltration and excess tubular Na+ reabsorption, in non-diabetic hypertensive patients deserves further investigation in relation to the described Na+-reno-metabolic mechanisms.
Supplementary material
Supplementary material is available at Cardiovascular Research online.
Authors’ contributions
G.R. had full access to all of the data in the study and take responsibility for the integrity of the data and the accuracy of the data analysis. Concept and design: G.R. and C.D.; recruitment of participants and diagnosis: G.R., G.M., C.B., V.B., M.C., T.M.S., and G.P.R.; acquisition, analysis, or interpretation of biochemical data: G.R., G.M., S.L., G.C., G.A., C.B., V.B., M.C., T.M.S., L.L., A.P., P.W., M.P., G.P.R., and C.D.; acquisition, analysis, or interpretation of metabolomic data: G.R., G.C., G.B., S.M., R.D., and C.D.; drafting of the manuscript: G.R.; critical revision of the manuscript for important intellectual content: G.R., G.M., G.B., S.M., A.M., R.M.T., M.C.P., G.P.R., and C.D.; statistical analysis: G.R., S.M., R.D., and C.D.; supervision: R.M.T., M.C.P., C.D., and G.P.R.; obtained funding: G.R., G.B., R.M.T., C.D., and G.P.R.
Supplementary Material
Acknowledgements
We thank Jun Chen, BSc, and David Brennan for their contribution to metabolomic samples extraction; Mrs Elaine Butler for her contribution to the biochemistry analysis of plasma and urine samples; Alice Beniero, for the help in the design of the graphical abstract; Maria Christina Zennaro, for coordinating the multicentre international project ENSAT-HT, which includes both University of Padua and University of Glasgow and provided a framework for collaboration and data sharing between the two institutions. None of the persons acknowledged above received compensation for their contributions to this study.
Conflict of interest: none declared.
Funding
This work was supported by the British Heart Foundation (BHF) Centre of Research Excellence Awards, RE/13/5/30177 and RE/18/6/34217 to R.M.T., C.D., and G.R.; Wellcome Trust Institutional Strategic Support Fund (ref. 204820/Z/16/Z)—Excellence and Innovation Catalyst Funding to C.D., G.R., G.P.R., and G.B; research grants from FORICA (The FOundation for advanced Research In Hypertension and CArdiovascular diseases); and the Società Italiana dell’Ipertensione Arteriosa to G.P.R.
References
- 1.Intersalt Cooperative Research Group. Intersalt: an international study of electrolyte excretion and blood pressure. Results for 24 hour urinary sodium and potassium excretion. BMJ 1988;297:319–328. [DOI] [PMC free article] [PubMed] [Google Scholar]
- 2. Mente A, O’Donnell MJ, Rangarajan S, McQueen MJ, Poirier P, Wielgosz A, Morrison H, Li W, Wang X, Di C, Mony P, Devanath A, Rosengren A, Oguz A, Zatonska K, Yusufali AH, Lopez-Jaramillo P, Avezum A, Ismail N, Lanas F, Puoane T, Diaz R, Kelishadi R, Iqbal R, Yusuf R, Chifamba J, Khatib R, Teo K, Yusuf S.. Association of urinary sodium and potassium excretion with blood pressure. N Engl J Med 2014;371:601–611. [DOI] [PubMed] [Google Scholar]
- 3. Graudal NA, Hubeck-Graudal T, Jurgens G. Effects of low sodium diet versus high sodium diet on blood pressure, renin, aldosterone, catecholamines, cholesterol, and triglyceride. Cochrane Database Syst Rev.2017;Cd004022:1–308. [DOI] [PMC free article] [PubMed] [Google Scholar]
- 4. Elijovich F, Weinberger MH, Anderson CA, Appel LJ, Bursztyn M, Cook NR, Dart RA, Newton-Cheh CH, Sacks FM, Laffer CL.. Salt sensitivity of blood pressure: a scientific statement from the American Heart Association. Hypertension 2016;68:e7–e46. [DOI] [PubMed] [Google Scholar]
- 5. He FJ, Burnier M, Macgregor GA.. Nutrition in cardiovascular disease: salt in hypertension and heart failure. Eur Heart J 2011;32:3073–3080. [DOI] [PubMed] [Google Scholar]
- 6. Kotchen TA, Cowley AW Jr, Frohlich ED.. Salt in health and disease–a delicate balance. N Engl J Med 2013;368:1229–1237. [DOI] [PubMed] [Google Scholar]
- 7. O’Donnell MJ, Yusuf S, Mente A, Gao P, Mann JF, Teo K, McQueen M, Sleight P, Sharma AM, Dans A, Probstfield J, Schmieder RE.. Urinary sodium and potassium excretion and risk of cardiovascular events. Jama 2011;306:2229–2238. [DOI] [PubMed] [Google Scholar]
- 8. Mente A, O’Donnell M, Rangarajan S, McQueen M, Dagenais G, Wielgosz A, Lear S, Ah STL, Wei L, Diaz R, Avezum A, Lopez-Jaramillo P, Lanas F, Mony P, Szuba A, Iqbal R, Yusuf R, Mohammadifard N, Khatib R, Yusoff K, Ismail N, Gulec S, Rosengren A, Yusufali A, Kruger L, Tsolekile LP, Chifamba J, Dans A, Alhabib KF, Yeates K, Teo K, Yusuf S.. Urinary sodium excretion, blood pressure, cardiovascular disease, and mortality: a community-level prospective epidemiological cohort study. Lancet 2018;392:496–506. [DOI] [PubMed] [Google Scholar]
- 9. Mozaffarian D, Fahimi S, Singh GM, Micha R, Khatibzadeh S, Engell RE, Lim S, Danaei G, Ezzati M, Powles J.. Global sodium consumption and death from cardiovascular causes. N Engl J Med 2014;371:624–634. [DOI] [PubMed] [Google Scholar]
- 10. Rakova N, Kitada K, Lerchl K, Dahlmann A, Birukov A, Daub S, Kopp C, Pedchenko T, Zhang Y, Beck L, Johannes B, Marton A, Muller DN, Rauh M, Luft FC, Titze J.. Increased salt consumption induces body water conservation and decreases fluid intake. J Clin Investig 2017;127:1932–1943. [DOI] [PMC free article] [PubMed] [Google Scholar]
- 11. Kitada K, Daub S, Zhang Y, Klein JD, Nakano D, Pedchenko T, Lantier L, LaRocque LM, Marton A, Neubert P, Schröder A, Rakova N, Jantsch J, Dikalova AE, Dikalov SI, Harrison DG, Müller DN, Nishiyama A, Rauh M, Harris RC, Luft FC, Wasserman DH, Sands JM, Titze J.. High salt intake reprioritizes osmolyte and energy metabolism for body fluid conservation. J Clin Investig 2017;127:1944–1959. [DOI] [PMC free article] [PubMed] [Google Scholar]
- 12. Mancia G, Fagard R, Narkiewicz K, Redon J, Zanchetti A, Bohm M, Christiaens T, Cifkova R, De Backer G, Dominiczak A, Galderisi M, Grobbee DE, Jaarsma T, Kirchhof P, Kjeldsen SE, Laurent S, Manolis AJ, Nilsson PM, Ruilope LM, Schmieder RE, Sirnes PA, Sleight P, Viigimaa M, Waeber B, Zannad F, Redon J, Dominiczak A, Narkiewicz K, Nilsson PM, Burnier M, Viigimaa M, Ambrosioni E, Caufield M, Coca A, Olsen MH, Schmieder RE, Tsioufis C, van de Borne P, Zamorano JL, Achenbach S, Baumgartner H, Bax JJ, Bueno H, Dean V, Deaton C, Erol C, Fagard R, Ferrari R, Hasdai D, Hoes AW, Kirchhof P, Knuuti J, Kolh P, Lancellotti P, Linhart A, Nihoyannopoulos P, Piepoli MF, Ponikowski P, Sirnes PA, Tamargo JL, Tendera M, Torbicki A, Wijns W, Windecker S, Clement DL, Coca A, Gillebert TC, Tendera M, Rosei EA, Ambrosioni E, Anker SD, Bauersachs J, Hitij JB, Caulfield M, De Buyzere M, De Geest S, Derumeaux GA, Erdine S, Farsang C, Funck-Brentano C, Gerc V, Germano G, Gielen S, Haller H, Hoes AW, Jordan J, Kahan T, Komajda M, Lovic D, Mahrholdt H, Olsen MH, Ostergren J, Parati G, Perk J, Polonia J, Popescu BA, Reiner Z, Ryden L, Sirenko Y, Stanton A, Struijker-Boudier H, Tsioufis C, van de Borne P, Vlachopoulos C, Volpe M, Wood DA.. 2013 ESH/ESC guidelines for the management of arterial hypertension: the Task Force for the Management of Arterial Hypertension of the European Society of Hypertension (ESH) and of the European Society of Cardiology (ESC). Eur Heart J 2013;34:2159–2219. [DOI] [PubMed] [Google Scholar]
- 13. Funder JW, Carey RM, Mantero F, Murad MH, Reincke M, Shibata H, Stowasser M, Young WF Jr.. The management of primary aldosteronism: case detection, diagnosis, and treatment: an Endocrine Society Clinical Practice Guideline. J Clin Endocrinol Metab 2016;101:1889–1916. [DOI] [PubMed] [Google Scholar]
- 14. Nieman LK, Biller BM, Findling JW, Newell-Price J, Savage MO, Stewart PM, Montori VM.. The diagnosis of Cushing’s syndrome: an Endocrine Society Clinical Practice Guideline. J Clin Endocrinol Metab 2008;93:1526–1540. [DOI] [PMC free article] [PubMed] [Google Scholar]
- 15. Lenders JW, Duh QY, Eisenhofer G, Gimenez-Roqueplo AP, Grebe SK, Murad MH, Naruse M, Pacak K, Young WF Jr.. Pheochromocytoma and paraganglioma: an endocrine society clinical practice guideline. J Clin Endocrinol Metab 2014;99:1915–1942. [DOI] [PubMed] [Google Scholar]
- 16. Lerchl K, Rakova N, Dahlmann A, Rauh M, Goller U, Basner M, Dinges DF, Beck L, Agureev A, Larina I, Baranov V, Morukov B, Eckardt KU, Vassilieva G, Wabel P, Vienken J, Kirsch K, Johannes B, Krannich A, Luft FC, Titze J.. Agreement between 24-hour salt ingestion and sodium excretion in a controlled environment. Hypertension 2015;66:850–857. [DOI] [PMC free article] [PubMed] [Google Scholar]
- 17. Cogswell ME, Loria CM, Terry AL, Zhao L, Wang CY, Chen TC, Wright JD, Pfeiffer CM, Merritt R, Moy CS, Appel LJ.. Estimated 24-hour urinary sodium and potassium excretion in US adults. Jama 2018;319:1209–1220. [DOI] [PMC free article] [PubMed] [Google Scholar]
- 18.Institute of Medicine/ Panel on dietary reference intakes for electrolytes and water: dietary reference intakes for water, potassium sodium, chloride, and sulfate. Washington, DC: National Academies Press; 2005. [Google Scholar]
- 19.Institute of Medicine. Strategies to reduce sodium intake in the United States. Washington, DC: National Academies Press; 2010. [DOI] [PMC free article] [PubMed] [Google Scholar]
- 20. Rossi GP, Ceolotto G, Rossitto G, Seccia TM, Maiolino G, Berton C, Basso D, Plebani M.. Prospective validation of an automated chemiluminescence-based assay of renin and aldosterone for the work-up of arterial hypertension. Clin Chem Lab Med 2016;54:1441–1450. [DOI] [PubMed] [Google Scholar]
- 21. Maiolino G, Rossitto G, Bisogni V, Cesari M, Seccia TM, Plebani M, Rossi GPPAPY Study Investigators. . Quantitative value of aldosterone-renin ratio for detection of aldosterone-producing adenoma: the aldosterone-renin ratio for primary aldosteronism (AQUARR) study. J Am Heart Assoc 2017;6: 1–9. [DOI] [PMC free article] [PubMed] [Google Scholar]
- 22. Antonelli G, Artusi C, Marinova M, Brugnolo L, Zaninotto M, Scaroni C, Gatti R, Mantero F, Plebani M.. Cortisol and cortisone ratio in urine: LC-MS/MS method validation and preliminary clinical application. Clin Chem Lab Med 2014;52:213–220. [DOI] [PubMed] [Google Scholar]
- 23. Ceccato F, Antonelli G, Barbot M, Zilio M, Mazzai L, Gatti R, Zaninotto M, Mantero F, Boscaro M, Plebani M, Scaroni C.. The diagnostic performance of urinary free cortisol is better than the cortisol: cortisone ratio in detecting de novo Cushing’s syndrome: the use of a LC-MS/MS method in routine clinical practice. Eur J Endocrinol 2014;171:1–7. [DOI] [PubMed] [Google Scholar]
- 24. Levey AS, Stevens LA, Schmid CH, Zhang YL, Castro AF III, Feldman HI, Kusek JW, Eggers P, Van Lente F, Greene T, Coresh J, for the CKD-EPI (Chronic Kidney Disease Epidemiology Collaboration)/ A new equation to estimate glomerular filtration rate. Ann Intern Med 2009;150:604–612. [DOI] [PMC free article] [PubMed] [Google Scholar]
- 25. Klahr S, Hamm LL, Hammerman MR, Mandel LJ. Renal metabolism: integrated responses. Compr Physiol 2011;25:2263. [Google Scholar]
- 26. Chambers MC, Maclean B, Burke R, Amodei D, Ruderman DL, Neumann S, Gatto L, Fischer B, Pratt B, Egertson J, Hoff K, Kessner D, Tasman N, Shulman N, Frewen B, Baker TA, Brusniak MY, Paulse C, Creasy D, Flashner L, Kani K, Moulding C, Seymour SL, Nuwaysir LM, Lefebvre B, Kuhlmann F, Roark J, Rainer P, Detlev S, Hemenway T, Huhmer A, Langridge J, Connolly B, Chadick T, Holly K, Eckels J, Deutsch EW, Moritz RL, Katz JE, Agus DB, MacCoss M, Tabb DL, Mallick P.. A cross-platform toolkit for mass spectrometry and proteomics. Nat Biotechnol 2012;30:918–920. [DOI] [PMC free article] [PubMed] [Google Scholar]
- 27. Smith CA, Want EJ, O’Maille G, Abagyan R, Siuzdak G.. XCMS: processing mass spectrometry data for metabolite profiling using nonlinear peak alignment, matching, and identification. Anal Chem 2006;78:779–787. [DOI] [PubMed] [Google Scholar]
- 28. Scheltema RA, Jankevics A, Jansen RC, Swertz MA, Breitling R.. PeakML/mzMatch: a file format, Java library, R library, and tool-chain for mass spectrometry data analysis. Anal Chem 2011;83:2786–2793. [DOI] [PubMed] [Google Scholar]
- 29. Gloaguen Y, Morton F, Daly R, Gurden R, Rogers S, Wandy J, Wilson D, Barrett M, Burgess K.. PiMP my metabolome: an integrated, web-based tool for LC-MS metabolomics data. Bioinformatics 2017;33:4007–4009. [DOI] [PMC free article] [PubMed] [Google Scholar]
- 30. Sumner LW, Amberg A, Barrett D, Beale MH, Beger R, Daykin CA, Fan TW, Fiehn O, Goodacre R, Griffin JL, Hankemeier T, Hardy N, Harnly J, Higashi R, Kopka J, Lane AN, Lindon JC, Marriott P, Nicholls AW, Reily MD, Thaden JJ, Viant MR.. Proposed minimum reporting standards for chemical analysis Chemical Analysis Working Group (CAWG) Metabolomics Standards Initiative (MSI). Metabolomics 2007;3:211–221. [DOI] [PMC free article] [PubMed] [Google Scholar]
- 31. Wishart DS, Feunang YD, Marcu A, Guo AC, Liang K, Vazquez-Fresno R, Sajed T, Johnson D, Li C, Karu N, Sayeeda Z, Lo E, Assempour N, Berjanskii M, Singhal S, Arndt D, Liang Y, Badran H, Grant J, Serra-Cayuela A, Liu Y, Mandal R, Neveu V, Pon A, Knox C, Wilson M, Manach C, Scalbert A.. HMDB 4.0: the human metabolome database for 2018. Nucleic Acids Res 2018;46:D608–D617. [DOI] [PMC free article] [PubMed] [Google Scholar]
- 32. Dabney A, Storey JD. qvalue: Q-value estimation for false discovery rate control. R package version 2.16.0. 2019.
- 33. Tonneijck L, Muskiet MH, Smits MM, van Bommel EJ, Heerspink HJ, van Raalte DH, Joles JA.. Glomerular hyperfiltration in diabetes: mechanisms, clinical significance, and treatment. J Am Soc Nephrol 2017;28:1023–1039. [DOI] [PMC free article] [PubMed] [Google Scholar]
- 34. Reboldi G, Verdecchia P, Fiorucci G, Beilin LJ, Eguchi K, Imai Y, Kario K, Ohkubo T, Pierdomenico SD, Schwartz JE, Wing L, Saladini F, Palatini P.. Glomerular hyperfiltration is a predictor of adverse cardiovascular outcomes. Kidney Int 2018;93:195–203. [DOI] [PubMed] [Google Scholar]
- 35. Kopp UC. Neural control of renal function. San Rafael, CA: Morgan & Claypool Life Sciences; 2011. [PubMed] [Google Scholar]
- 36. Eisenhofer G, Goldstein DS, Walther MM, Friberg P, Lenders JW, Keiser HR, Pacak K.. Biochemical diagnosis of pheochromocytoma: how to distinguish true- from false-positive test results. J Clin Endocrinol Metab 2003;88:2656–2666. [DOI] [PubMed] [Google Scholar]
- 37. Laffer CL, Scott RC III, Titze JM, Luft FC, Elijovich F.. Hemodynamics and salt-and-water balance link sodium storage and vascular dysfunction in salt-sensitive subjects. Hypertension 2016;68:195–203. [DOI] [PMC free article] [PubMed] [Google Scholar]
- 38. Nomura K, Asayama K, Jacobs L, Thijs L, Staessen JA.. Renal function in relation to sodium intake: a quantitative review of the literature. Kidney Int 2017;92:67–78. [DOI] [PubMed] [Google Scholar]
- 39. Mallamaci F, Leonardis D, Bellizzi V, Zoccali C.. Does high salt intake cause hyperfiltration in patients with essential hypertension? J Hum Hypertens 1996;10:157–161. [PubMed] [Google Scholar]
- 40. Guyton AC, Hall JE.. Textbook of medical physiology. Philadelphia, PA: Elsevier; 2011. [Google Scholar]
- 41. Hansell P, Welch WJ, Blantz RC, Palm F.. Determinants of kidney oxygen consumption and their relationship to tissue oxygen tension in diabetes and hypertension. Clin Exp Pharmacol Physiol 2013;40:123–137. [DOI] [PMC free article] [PubMed] [Google Scholar]
- 42. Pruijm M, Hofmann L, Maillard M, Tremblay S, Glatz N, Wuerzner G, Burnier M, Vogt B.. Effect of sodium loading/depletion on renal oxygenation in young normotensive and hypertensive men. Hypertension 2010;55:1116–1122. [DOI] [PubMed] [Google Scholar]
- 43. Schedl HP, Chen PS Jr, Greene G, Redd D.. The renal clearance of plasma cortisol. J Clin Endocrinol Metab 1959;19:1223–1229. [DOI] [PubMed] [Google Scholar]
- 44. Rask E, Olsson T, Soderberg S, Andrew R, Livingstone DE, Johnson O, Walker BR.. Tissue-specific dysregulation of cortisol metabolism in human obesity. J Clin Endocrinol Metab 2001;86:1418–1421. [DOI] [PubMed] [Google Scholar]
- 45. Fenske M. Urinary free cortisol and cortisone excretion in healthy individuals: influence of water loading. Steroids 2006;71:1014–1018. [DOI] [PubMed] [Google Scholar]
- 46. Tanoue A, Ito S, Honda K, Oshikawa S, Kitagawa Y, Koshimizu TA, Mori T, Tsujimoto G.. The vasopressin V1b receptor critically regulates hypothalamic-pituitary-adrenal axis activity under both stress and resting conditions. J Clin Invest 2004;113:302–309. [DOI] [PMC free article] [PubMed] [Google Scholar]
- 47. Ehrlich EN, Lugibihl K, Laves M, Janulis M.. Reciprocal variations in urinary cortisol and aldosterone in response to increased salt intake in humans. J Clin Endocrinol Metab 1966;26:1160–1169. [DOI] [PubMed] [Google Scholar]
- 48. Juraschek SP, Miller ER, Chang AR, Anderson CAM, Hall JE, Appel LJ.. Effects of sodium reduction on energy, metabolism, weight, thirst, and urine volume: results from the DASH (Dietary Approaches to Stop Hypertension)-Sodium trial. Hypertension 2020;75:723–729. [DOI] [PMC free article] [PubMed] [Google Scholar]
- 49. Bray GA, Smith SR, de Jonge L, Xie H, Rood J, Martin CK, Most M, Brock C, Mancuso S, Redman LM.. Effect of dietary protein content on weight gain, energy expenditure, and body composition during overeating: a randomized controlled trial. Jama 2012;307:47–55. [DOI] [PMC free article] [PubMed] [Google Scholar]
Associated Data
This section collects any data citations, data availability statements, or supplementary materials included in this article.
Supplementary Materials
Data Availability Statement
Access to fully deidentified data generated or analysed during this study can be provided upon reasonable request from qualified researchers trained in human subject confidentiality protocols.
Translational perspective
We herein show that high Na intake can adversely impact not only blood pressure control but also renal function and metabolic balance in hypertensive patients. At variance with experimental preclinical studies, the catabolism of proteins appears to include also exogenous sources. Interventional studies where caloric intake is controlled but not restricted may identify preferential metabolic handling in different subjects/populations and test the effect of specific dietary strategies. Similarly, the potential benefit of medications like sodium–glucose cotransporter (SGLT)-2 inhibitors, which are known to reduce both glomerular hyperfiltration and excess tubular Na+ reabsorption, in non-diabetic hypertensive patients deserves further investigation in relation to the described Na+-reno-metabolic mechanisms.