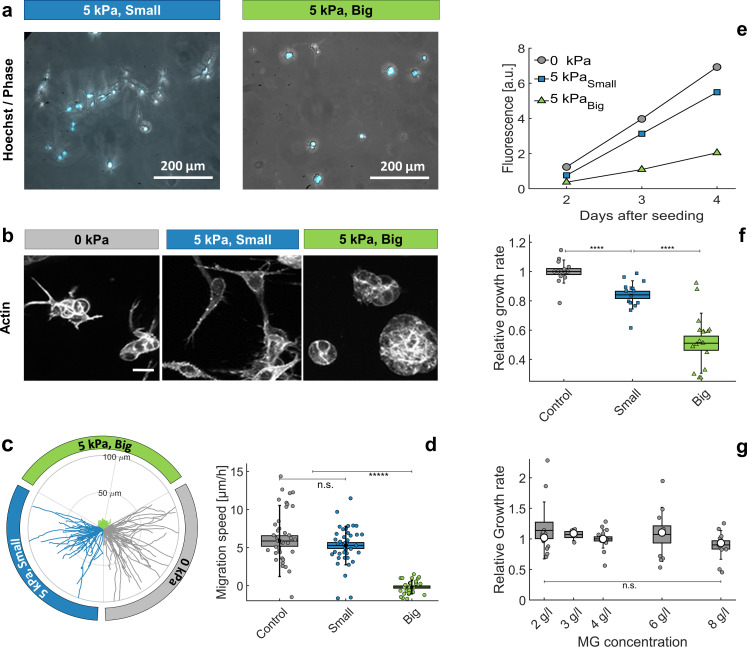
Figure 5. Individual cells in Matrigel.
(a) Hoechst-labeled cell nuclei superimposed to phase image. Images are taken after 2 days of proliferation in MG, either with small (left panel) or big (right panel) dextran molecules. Maximal projection from epifluorescence stacks. (b) Cell morphology and anisotropy revealed by labeling of cytoplasmic actin. Maximal projection of 50 μ m confocal Z-stack. In relaxed MG, the cells appear more elongated and with long protrusions. (c) Cell motility in MG under different compression states. Starting points of trajectories are translated to the origin, to highlight the typical distance over which cells move in the three compressive states. (d) Quantification of in-plane velocity extracted from mean square displacements, under different compression conditions. With no pressure or with small dextran (5 kPa), the average velocities are respectively 5.8 ± 0.8 / hr and 5.2 ± 0.5 / hr. Under 5 kPa exerted by big dextran, the cells are immobile (v = 0.5 ± 0.4 ), where the error is due to tracking uncertainties. (e) Temporal evolution of nuclear fluorescence intergrated over the whole sample. No pressure (ο), 5 kPa with small dextran () and 5 kPa with big dextran (). (f) Cell proliferation rate in the three conditions. n = 15, from eight independent experiments. (g) Cell proliferation rate at different initial matrigel concentration, with no pressure. Boxes represent the mean values ± SEM, error bars correspond to the standard deviation, small markers are individual experiments and large markers the median.

