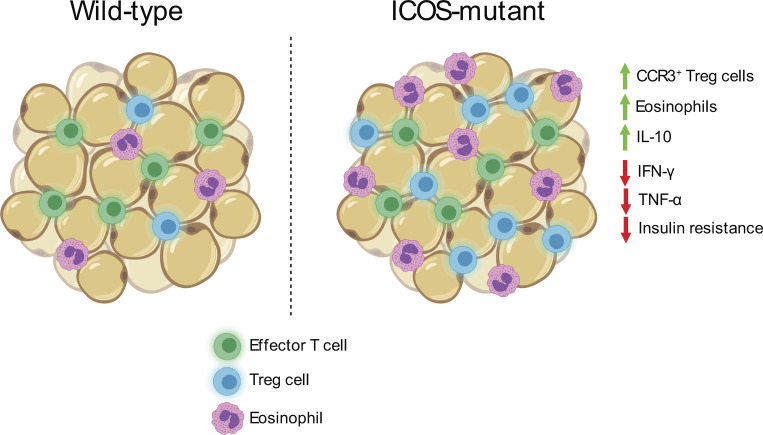
The authors demonstrate that loss of ICOS-dependent PI3-kinase signaling supports visceral adipose tissue (VAT) TR abundance and function, and correlates with reduced adipose inflammation and improved insulin sensitivity after a high-fat diet. This highlights a new pathway regulating VAT-TR activity.
Abstract
A unique population of Foxp3+ regulatory T cells (TRs) resides in visceral adipose tissue (VAT) that regulates adipose inflammation and helps preserve insulin sensitivity. Inducible T cell co-stimulator (ICOS) is highly expressed on effector (e)TRs that migrate to nonlymphoid tissues, and contributes to their maintenance and function in models of autoimmunity. In this study, we report an unexpected cell-intrinsic role for ICOS expression and downstream phosphoinositide 3-kinase (PI3K) signaling in limiting the abundance, VAT-associated phenotype, and function of TRs specifically in VAT. Icos−/− mice and mice expressing a knock-in form of ICOS that cannot activate PI3K had increased VAT-TR abundance and elevated expression of canonical VAT-TR markers. Loss of ICOS signaling facilitated enhanced accumulation of TRs to VAT associated with elevated CCR3 expression, and resulted in reduced adipose inflammation and heightened insulin sensitivity in the context of a high-fat diet. Thus, we have uncovered a new and surprising molecular pathway that regulates VAT-TR accumulation and function.
Graphical Abstract
Introduction
CD4+Foxp3+ regulatory T cells (TRs) are critical for maintaining immune tolerance and for the resolution of ongoing inflammation after infection (Dominguez-Villar and Hafler, 2018; Noval Rivas and Chatila, 2016; Smigiel et al., 2014a). Specialized subsets of tissue-specific TRs also function in tissue repair and homeostasis. For example, Areg+ TRs expand in skeletal muscle and the lungs in response to injury and are required for proper tissue repair (Arpaia et al., 2015; Burzyn et al., 2013), whereas TRs within hair follicles and skin are essential for hair generation and inhibiting fibrosis (Ali et al., 2017; Kalekar et al., 2019). TRs are also found in the visceral adipose tissue (VAT) of both mice and humans, where they regulate adipose inflammation and preserve metabolic homeostasis (Deiuliis et al., 2011; Eller et al., 2011; Feuerer et al., 2009; Ilan et al., 2010). As such, TR ablation in diphtheria toxin–treated Foxp3DTR mice results in increased inflammatory mediators in VAT and reduced insulin sensitivity, whereas augmentation of TRs by administration of IL-2 immune complexes or IL-33 results in improved metabolic readouts in mice on a high-fat diet (HFD; Feuerer et al., 2009; Han et al., 2015; Vasanthakumar et al., 2015).
Given that TRs modulate diverse responses in different anatomical and inflammatory settings, it is not surprising that they exhibit considerable phenotypic and functional heterogeneity. Expression of CD62L and CD44 broadly divides TRs into distinct subsets that are enriched in lymphoid and nonlymphoid tissues (Campbell, 2015; Smigiel et al., 2014b). We term these populations central TRs (cTRs) and effector TRs (eTRs), respectively. Differential activation of phosphoinositide 3-kinase (PI3K), unique epigenetic landscapes, and distinct transcriptional programs underlie the diversification of TRs, and selective expression of chemokine receptors and cell adhesion molecules give subsets of TRs access to specific tissues (Delacher et al., 2017; DiSpirito et al., 2018; Luo et al., 2016). The proper distribution of TRs across tissues is crucial for maintaining immune tolerance and tissue homeostasis (Sather et al., 2007; Yamaguchi et al., 2011). Hence, understanding the signals that control the development, maintenance, and function of tissue-specific TRs is vital to fully harnessing their therapeutic potential.
TR occupancy in different tissues is met with unique homeostatic maintenance requirements. Generally, IL-2 signaling maintains cTRs within T cell zones of secondary lymphoid tissues by driving pro-survival signals, whereas maintenance of eTRs in nonlymphoid tissues can be IL-2 independent, and instead relies on TCR and costimulatory molecule engagement (Levine et al., 2014; Smigiel et al., 2014b; Tang et al., 2003). Inducible T cell co-stimulator (ICOS) is expressed on highly suppressive TRs and can control TR abundance by inhibiting apoptosis and stimulating proliferation (Burmeister et al., 2008; Redpath et al., 2013). IL-10 is essential for control of local immune responses and is primarily expressed by Blimp-1+ICOS+ eTRs (Cretney et al., 2011). ICOS costimulation in vitro superinduces IL-10 expression (Arimura et al., 2002; Hutloff et al., 1999), and this depends on its ability to activate PI3K (Feito et al., 2003; Okamoto et al., 2003). Although mice deficient in ICOS or ICOS ligand (ICOSL) do not develop spontaneous inflammatory or autoimmune disease, genetic or antibody (Ab)-mediated blockade of ICOS signaling promotes inflammation in mouse models of autoimmunity and infection as a result of reduced TR abundance and/or IL-10 production (Busse et al., 2012; Dong et al., 2001; Herman et al., 2004; Kohyama et al., 2004; Kornete et al., 2012; Landuyt et al., 2019; Miyamoto et al., 2005; Redpath et al., 2013).
ICOS potently activates PI3K and downstream AKT (also known as protein kinase B) via a unique YMFM motif in its cytoplasmic tail (Arimura et al., 2002; Fos et al., 2008). AKT can act on several different substrates, including the transcription factor Foxo1, to modulate transcription of genes involved in proliferation, survival, metabolic reprogramming, and migration/tissue tropism (So and Fruman, 2012). Indeed, inactivation of Foxo1 by AKT is essential for the differentiation of eTRs and their migration to nonlymphoid tissues (Luo et al., 2016). The mammalian target of rapamycin (mTOR) pathway is also activated by PI3K signaling and regulates TR metabolism and differentiation. Thus, engagement of ICOS may facilitate the development and/or maintenance of eTRs via multiple PI3K-dependent signaling pathways.
Accumulation of TRs in VAT is dependent on several signals. VAT-TRs consist of clonally expanded populations, suggesting that recognition of one or more adipose tissue antigens promotes their tissue residence (Feuerer et al., 2009; Kolodin et al., 2015). Additionally, mice lacking expression of IL-33 or its receptor ST2 are deficient in VAT-TRs, whereas injection of exogenous IL-33 results in increased VAT-TR abundance with little impact on lymphoid TRs (Han et al., 2015; Vasanthakumar et al., 2015). Recent work also identified a cell-intrinsic role for CCR2 in the ability of donor TR to repopulate VAT (Vasanthakumar et al., 2020). Finally, TR expression of peroxisome proliferator–activated receptor γ, the master regulator of adipocyte differentiation, supports VAT-TR phenotype and accumulation and drives expression of factors important for lipid metabolism (Cipolletta et al., 2012; Cipolletta et al., 2015). However, despite having an eTR phenotype, the role of costimulatory molecule signaling in VAT-TRs is poorly understood.
In this study, we demonstrate an unexpected role for cell-intrinsic ICOS-dependent PI3K signaling in restricting VAT-TR accumulation and function. Moreover, we implicate the CCL11/24-CCR3 axis as an additional factor capable of driving recruitment of TRs to VAT, which is enhanced in the absence of ICOS signaling. These surprising findings challenge the current model regarding signals that support diverse TR subsets and highlight the cell- and tissue-specific effects of ICOS expression and signaling on TR development, accumulation, and function.
Results
Mice lacking ICOS signaling have reduced TRs in lymphoid tissues and altered expression of PI3K targets
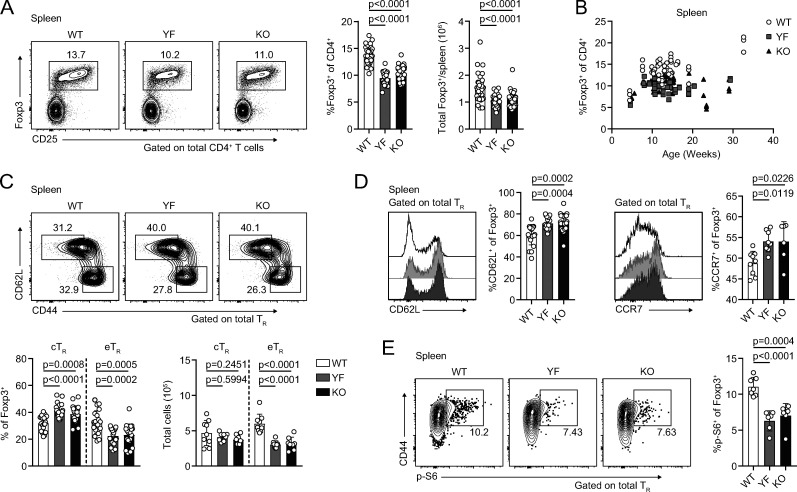
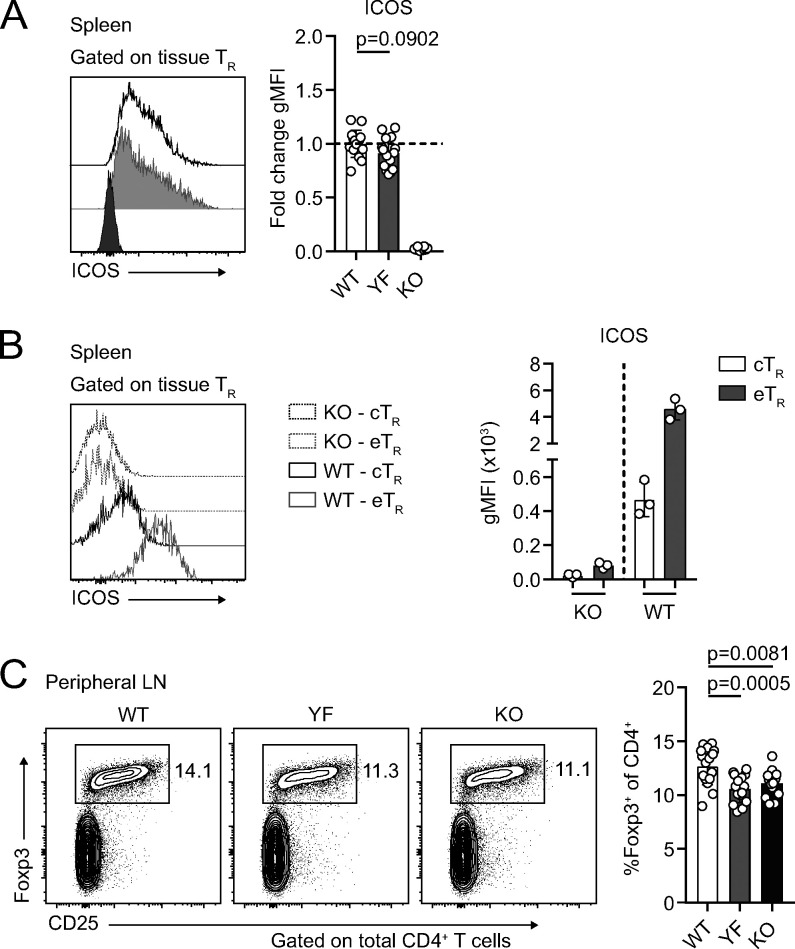
To determine how ICOS signaling impacts TR abundance in different tissues, we crossed Foxp3mRFP mice (Wan and Flavell, 2005) to Icos−/− (KO) mice and to IcosY181F (YF) mice, which carry a tyrosine-to-phenylalanine knock-in mutation in the YMFM motif in the cytoplasmic tail of ICOS, thereby specifically abolishing ICOS-mediated PI3K activation (Gigoux et al., 2009). In line with published data, we found a ∼30% reduction in the frequency and number of TRs in the spleens of KO compared with WT Foxp3mRFP mice (Fig. 1 A; Burmeister et al., 2008; Landuyt et al., 2019). This was even more pronounced in older animals, as TRs accumulate with age (Fig. 1 B; Nishioka et al., 2006). Despite normal ICOS expression on the cell surface (Fig. S1 A) and intact MAPK signaling (Gigoux et al., 2009), we saw a similar reduction in splenic TR abundance in YF mice, indicating that activation of PI3K signaling is the critical pathway by which ICOS regulates TR abundance (Fig. 1, A and B). ICOS is expressed on cTRs, but its expression is further up-regulated on eTRs (Fig. S1 B). The loss of TRs we observed in YF and KO spleens was associated with a disproportionate reduction in the frequency and number of eTRs, whereas cTR abundance was unchanged, consistent with results using Ab blockade of ICOS signaling (Fig. 1 C; Smigiel et al., 2014b). Loss of TRs was also observed in the peripheral LNs (pLNs) of YF and KO mice, indicating that ICOS signaling is important for eTR maintenance in multiple secondary lymphoid organs (Fig. S1 C). Both YF and KO TRs in the spleen had elevated expression of the lymphoid homing molecules CD62L and CCR7, which are down-regulated upon PI3K activation via phosphorylation and sequestration of Foxo1 (Fig. 1 D; Kerdiles et al., 2009). This reflects both an increased frequency of splenic cTRs as well as increased CD62L and CCR7 expression by gated CD44hi TRs in YF and KO mice. When examined directly ex vivo, YF and KO splenic TRs also exhibited reduced phosphorylation of the mTORC1 target, ribosomal protein S6, consistent with diminished activation of PI3K (Fig. 1 E). Thus, the absence of ICOS-mediated PI3K activation drives the altered lymphoid TR frequency and phenotype in YF and KO mice.
Figure 1.
Absence of ICOS signaling results in loss of lymphoid TRs and altered expression of PI3K targets. (A) Representative flow cytometry plots and quantification of splenic TRs (n = 3–6 per group from nine independent experiments). (B) Splenic TR frequencies at indicated ages (n = 3–5 per group from 16 independent experiments). (C) Representative flow cytometry plots and quantification of splenic cTRs (CD44loCD62Lhi) and eTRs (CD44hiCD62Llo; n = 3–5 per group from seven independent experiments). (D) Expression of CD62L and CCR7 in splenic TRs (CD62L: n = 3–5 per group from five independent experiments; CCR7: n = 3–5 per group from two independent experiments). (E) S6 phosphorylation (p-S6) measured directly ex vivo in splenic TRs by flow cytometry (n = 3 or 4 per group from two independent experiments). Mice were age matched within independent experiments, and pooled data are from experiments using mice aged 8–16 wk, except in B, where age is indicated. Statistical significance was determined using one-way ANOVA with Tukey’s post-test. All graphical data are presented as mean values ± SD.
Figure S1.
Despite normal surface expression of ICOS, YF mice phenocopy KO with equivalent loss of lymphoid TRs (goes with Fig. 1). (A) ICOS expression on gated WT, YF, and KO splenic TRs. Fold change of ICOS gMFI is compared with average expression in WT TR for each individual experiment. Dashed line marks average value of WT control samples (n = 3 per group from five independent experiments). (B) Representative ICOS expression on gated splenic KO and WT CD44loCD62Lhi cTR and CD44hiCD62Llo eTRs as measured by flow cytometry (n = 3 per group from five independent experiments). (C) TR frequencies of total CD4+ T cells in pLNs (n = 2–5 per group from five independent experiments). Mice were age matched within individual experiments, and quantified data are pooled from experiments using male mice 8–16 wk of age. Statistical significance was determined using one-way ANOVA with Tukey’s post-test. All data are presented as mean values ± SD.
TRs are enriched in VAT in the absence of ICOS signaling
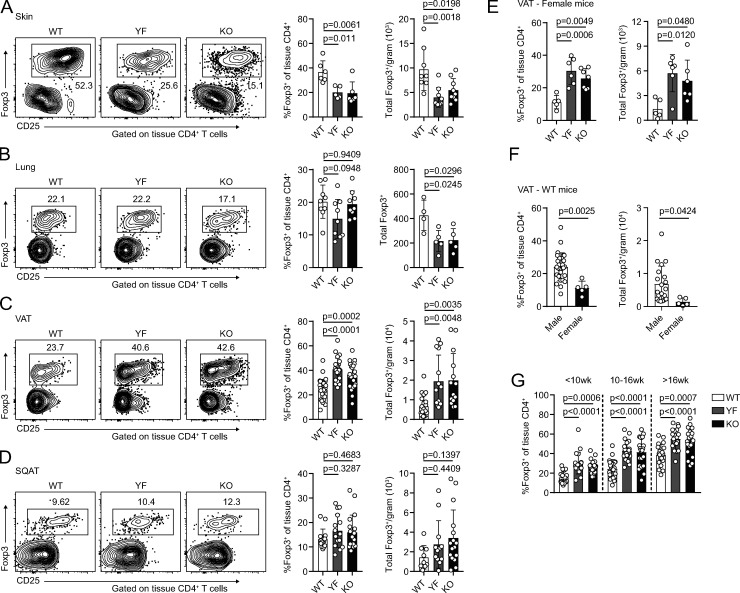
As eTRs are highly enriched in nonlymphoid sites (Lee et al., 2007; Smigiel et al., 2014b), we next assessed whether maintenance of TRs in peripheral tissues was diminished in YF and KO mice. Using intravascular labeling to identify tissue-localized TRs (Anderson et al., 2014), we observed a reduction in the frequency and number of TRs in the skin and a decrease in the absolute number of TRs in the lungs of YF and KO mice (Fig. 2, A and B). However, TR frequency and total number were actually elevated in the VAT of both ICOS mutant strains (Fig. 2 C). This was specific to VAT, as frequency and total number of TRs in subcutaneous adipose tissue (SQAT) remained similar between genotypes (Fig. 2 D). Male and female YF and KO mice demonstrated increased VAT-TR abundance compared with WT mice of the same sex; however, the frequency and number of VAT-TRs in females was significantly less than that observed in males (Fig. 2, E and F). Consistent with previous studies, we observed age-dependent accumulation of VAT-TRs across all three genotypes in male mice (Feuerer et al., 2009), but despite considerable mouse-to-mouse variability, VAT-TRs remained elevated in YF and KO mice across all age groups analyzed (Fig. 2 G).
Figure 2.
TR frequency and number are increased in VAT in the absence of ICOS signaling. (A–D) Representative flow cytometry plots and quantification of TRs among tissue-localized TCRβ+CD4+ cells in WT, YF, and KO ear skin (A), lung (B), VAT (C), and inguinal SQAT (D) of male mice (skin: n = 3 per group from two independent experiments; lung: n = 3 per group from three independent experiments; VAT: n = 3–6 from eight independent experiments; SQAT: n = 3–5 for five independent experiments). (E) Tissue-localized VAT-TR frequency and total number in female WT, YF, and KO mice (n = 3 per group for three independent experiments). (F) TR frequency and total number in VAT of male versus female WT mice (combined data from WT groups in C and E). (G) VAT-TR frequencies by noted age bins in male mice as measured by flow cytometry (n = 3–5 mice per group from 18 independent experiments). Mice were age matched within independent experiments, and pooled data are from experiments using mice aged 8–16 wk, except in G, where age is indicated. Statistical significance was determined using one-way ANOVA with Tukey’s post-test or two-tailed Student’s t test where appropriate. All data are presented as mean values ± SD.
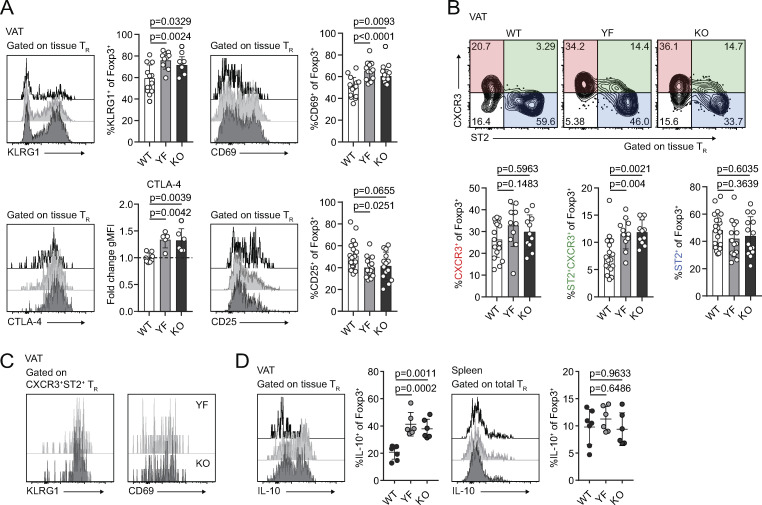
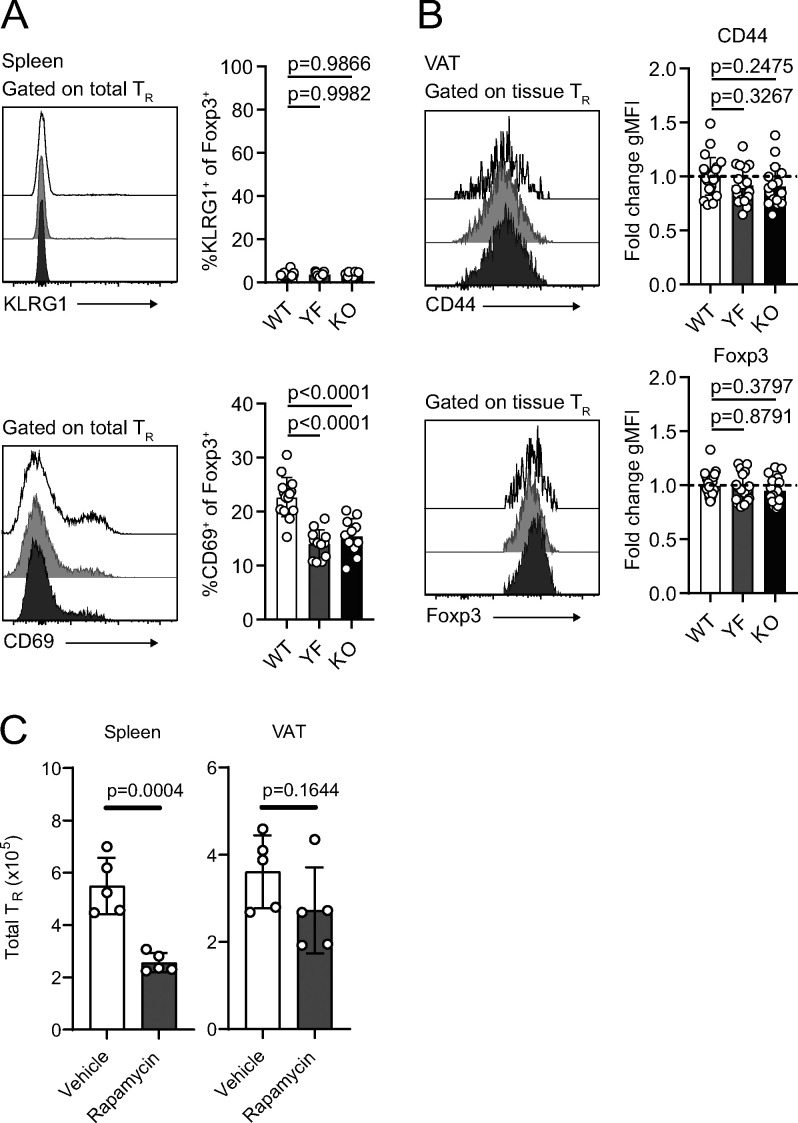
We used male mice for the remainder of our studies as we found female mice harbor approximately fourfold to fivefold fewer TRs/gram VAT than age-matched males, and female mice are protected from the development of diet-induced metabolic syndrome (Ahnstedt et al., 2018; Pettersson et al., 2012; Vasanthakumar et al., 2020). The frequency of VAT-TRs expressing KLRG1 and CD69 was significantly elevated in YF and KO mice compared with WT controls (Fig. 3 A). By contrast, in the spleen there was a reduced frequency of YF and KO TR-expressed CD69, and very few TRs were KLRG1+ (Fig. S2 A). We assessed VAT-TR Foxp3 and CD44 expression and found no difference in the absence of ICOS (Fig. S2 B). We did, however, observe a modest increase in the expression of CTLA-4 and a slight reduction in the frequency of CD25+ TRs in YF and KO VAT (Fig. 3 A). Therefore, TRs in the VAT of YF and KO mice are enriched in expression of markers indicative of an eTR and VAT-TR phenotype (Feuerer et al., 2009; Smigiel et al., 2014b).
Figure 3.
Loss of ICOS signaling supports an eTR phenotype in VAT. (A) Representative flow cytometry plots and quantification of KLRG1, CD69, CTLA-4, and CD25 expression in tissue-localized VAT-TRs. CTLA-4 gMFI was calculated as fold change compared with average expression in WT TRs for each individual experiment. Dashed line marks average value of WT control samples (n = 3–6 per group from three independent experiments or, for CTLA-4, two independent experiments). (B) Representative gating of VAT-TRs on CXCR3 and ST2 expression and quantification of VAT-TRs positive for CXCR3 (left) or ST2 (right) alone or double-expressers of CXCR3 and ST2 (middle; n = 3–5 per group from five independent experiments). (C) Representative histograms showing expression of KLRG1 and CD69 in CXCR3+ST2+ YF and KO VAT-TRs as measured by flow cytometry. (D) Representative flow cytometry plots and quantification of IL-10 expression in TRs from VAT and spleen after 4-h PMA/I + monensin stimulation ex vivo (n = 3–5 per group from two independent experiments). Mice were age matched within independent experiments, and pooled data are from experiments using male mice aged 8–16 wk. Statistical significance was determined using one-way ANOVA with Tukey’s post-test. All data are presented as mean values ± SD.
Figure S2.
Expression of activation markers on splenic and VAT-TRs (goes with Fig. 3). (A) KLRG1 and CD69 expression in gated WT, YF, and KO splenic TRs (n = 3–6 per group from three independent experiments). (B) CD44 and Foxp3 expression in tissue-localized VAT-TRs. gMFI was calculated as fold change compared with average expression in WT TRs for each individual experiment (n = 3–6 per group from six independent experiments). (C) Mice were age matched within individual experiments, and pooled data are from experiments using 8–16-wk-old male mice. Statistical significance was determined using one-way ANOVA with Tukey’s post-test. (C) Number of CD4+Foxp3+ TRs in spleen (left) and VAT (right) in mice treated with rapamycin (1 mg/kg) or vehicle as indicated (n = 5 mice per group from one experiment). Statistical significance was determined using two-tailed unpaired Student’s t test. All data are presented as mean values ± SD.
In addition to prototypical eTR markers, a fraction of VAT-TRs express the IL-33 receptor ST2 (Kolodin et al., 2015; Vasanthakumar et al., 2015). Signaling downstream of ST2 is required for the establishment and maintenance of VAT-TRs, and expansion of VAT-TRs through administration of IL-33 can reduce VAT inflammation and improve metabolic indices in models of diet-induced obesity (Han et al., 2015; Kolodin et al., 2015; Vasanthakumar et al., 2015). In addition to ST2-expressing TRs, we found a substantial population of CXCR3+ TRs in the VAT of lean mice, confirming previously reported findings (Fig. 3 B; Li et al., 2018). Although there were no significant differences in the frequency of WT, YF, or KO VAT-TRs singly expressing ST2 or CXCR3, we found a unique population of double-expressing ST2+CXCR3+ TRs in YF and KO VAT, which resembled canonical VAT-TRs in their expression of KLRG1 and CD69 (Fig. 3, B and C). Furthermore, whereas the abundance of splenic TRs in WT mice was dramatically reduced following treatment with the mTORC1 inhibitor rapamycin, there was no significant change in the number of TRs in the VAT (Fig. S2 C), indicating that ICOS-dependent PI3K activation regulates VAT TRs independently of mTORC1 activity.
ICOS signaling can potentiate IL-10 production (Busse et al., 2012; Dong et al., 2001; Herman et al., 2004; Hutloff et al., 1999; Kohyama et al., 2004; Kornete et al., 2012; Landuyt et al., 2019; Miyamoto et al., 2005; Redpath et al., 2013). Surprisingly, compared with VAT-TRs from WT mice, a substantially higher frequency of YF and KO VAT-TRs were poised to produce IL-10 upon ex vivo stimulation with phorbo-myristate-acetate and ionomycin (PMA/I), with no appreciable differences in IL-10 expression by splenic TRs (Fig. 3 D). Thus, absence of ICOS-dependent PI3K signaling supports both the accumulation and suppressive phenotype of TRs in VAT.
Baseline adipose inflammation is reduced in YF and KO mice
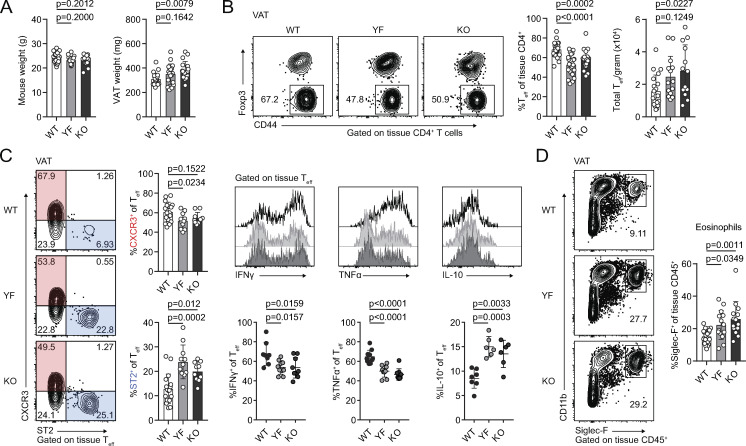
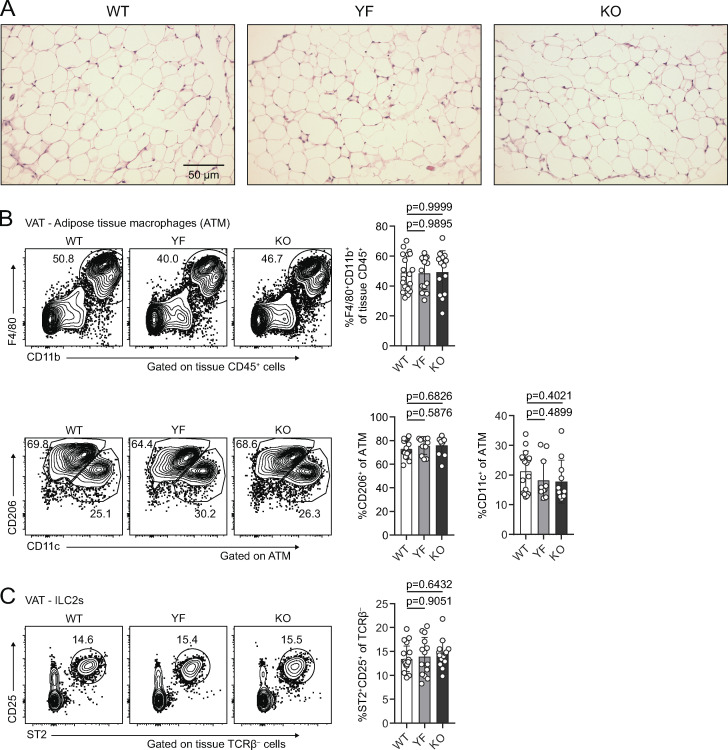
VAT inflammation is modulated through a balance of different immune cells. TRs, eosinophils, anti-inflammatory adipose tissue macrophages (ATMs), and type 2 innate lymphoid cells (ILC2s) maintain a type 2 immune environment that supports metabolic homeostasis in lean animals. Inflammation drives recruitment of neutrophils and cytotoxic T cells, differentiation of inflammatory ATM, and production of pro-inflammatory cytokines like TNFα (Burhans et al., 2019; Molofsky et al., 2013). Although there was no difference in mouse weights between WT, YF, and KO mice across different ages, we did observe a trend toward increased VAT weight in YF mice and a significant increase in KO mice (Fig. 4 A). By histology, we did not observe any overt morphological differences in VAT from WT, YF, and KO mice, including no observable differences in adipocyte size (Fig. S3 A). The increase in VAT weight, however, did correlate with a modest increase in the total number of CD4+ effector T cells (Teffs) per gram of tissue (Fig. 4 B). Despite this increase in VAT-Teff number, there was a substantially lower frequency of YF and KO VAT-Teffs expressing features of inflammatory T helper type 1 cells (Th1 cells), including CXCR3, IFN-γ, and TNFα (Fig. 4 C). Rather, ST2-expressing Teffs were enriched in YF and KO VAT (Fig. 4 C). Similar to VAT-TRs, YF and KO VAT-Teffs were superior at producing IL-10 upon stimulation, suggesting that absence of ICOS signaling in Teffs supports a self-regulatory function (Fig. 4 C). IL-33 signaling induces production of Th2 cytokines (Schmitz et al., 2005), which maintain ATMs in an anti-inflammatory state. While we didn’t find any significant changes in ATM or ILC2 populations (Fig. S3, B and C), we did note an increased frequency of eosinophils in YF and KO VAT (Fig. 4 D), which produce IL-4 to maintain anti-inflammatory ATMs (Molofsky et al., 2013; Wu et al., 2011). Overall, global loss of ICOS expression and signaling impacts TRs along with other adipose-resident immune cells to maintain an anti-inflammatory state in VAT.
Figure 4.
Reduced expression of inflammatory markers in YF and KO VAT. (A) Summary of total mouse and VAT weight in male WT, YF, and KO mice (n = 3–6 per group from six independent experiments). (B) Representative flow cytometry plots and quantification of tissue-localized VAT-Teffs in WT, YF, and KO mice (n = 3–6 per group from eight independent experiments). (C) Representative gating of VAT-Teffs on CXCR3 and ST2 expression and quantification of VAT-Teffs positive for CXCR3 or ST2 (left; n = 3–5 per group from five independent experiments). Representative flow cytometry plots (top panels) and quantification (bottom panels) of IFN-γ, TNFα, and IL-10 expression in VAT-Teffs after 4-h PMA/I + monensin stimulation ex vivo (right; n = 3–5 per group from two independent experiments). (D) Tissue-localized eosinophil frequencies in VAT (n = 2–6 from six independent experiments). Mice were age matched within independent experiments, and pooled data are from experiments using male mice aged 8–16 wk. Statistical significance was determined using one-way ANOVA with Tukey’s post-test. All graphical data are presented as mean values ± SD.
Figure S3.
Adipocyte, ATM, and ILC2 populations are unchanged in YF and KO VAT (goes with Fig. 4). (A) H&E staining of VAT from 8-wk-old male mice. (B) Representative flow cytometry plots and quantification of tissue-localized ATM in WT, YF, and KO mice (top). Representative gating of ATM on CD11c and CD206 to identify M1-like and M2-like macrophages, respectively (bottom; n = 2–6 per group from six independent experiments). (C) Frequency of tissue-localized ILC2s in VAT as measured by flow cytometry (n = 2–6 per group from six independent experiments). Mice were age matched within individual experiments, and pooled data are from experiments using 8–16-wk-old male mice. Statistical significance was determined using one-way ANOVA with Tukey’s post-test. All data are presented as mean values ± SD.
YF and KO mice are protected from HFD-induced insulin resistance
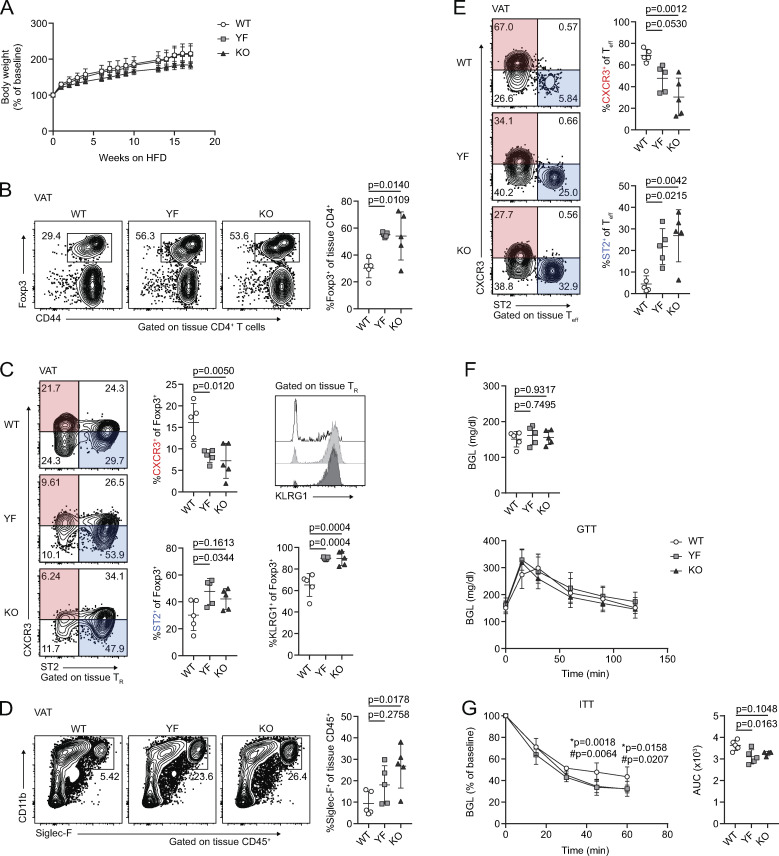
Given the abundance and suppressive phenotype of TRs and other anti-inflammatory immune cells in VAT in YF and KO mice, we asked if they were more resistant to developing HFD-induced adipose inflammation and metabolic changes. Mice placed on an 18-wk HFD steadily gained body mass, with a modest reduction in weight gained by KO mice compared with WT (Fig. 5 A). After 18 wk on HFD, YF and KO mice sustained elevated TR frequencies in VAT compared with WT mice, with an increased fraction of cells expressing the canonical VAT-TR markers ST2 and KLRG1 and a smaller proportion of TRs expressing CXCR3 (Fig. 5, B and C). Additionally, YF and KO mice placed on an HFD retained a greater frequency of eosinophils, and Teffs skewed toward a type 2, ST2-expressing phenotype (Fig. 5, D and E). Fasting blood glucose levels (BGLs) were similar among genotypes after 18 wk, and WT, YF, and KO mice were able to clear glucose to the same extent, as measured by glucose tolerance test (GTT; Fig. 5 F). However, in an insulin tolerance test (ITT), YF and KO mice demonstrated improved insulin sensitivity compared with WT mice (Fig. 5 G). Thus, loss of ICOS supports TRs and other anti-inflammatory cells in VAT during an HFD, and this has functional consequences in maintaining metabolic homeostasis.
Figure 5.
Mice deficient in ICOS signaling maintain anti-inflammatory immune cell abundance and phenotype in VAT after a long-term HFD, correlating with improved insulin sensitivity. (A) Percentage of baseline body weight at indicated time points following initiation of an HFD. (B) Tissue-localized VAT-TR frequency after 18 wk of an HFD. (C) VAT-TR phenotypic data as measured by flow cytometry showing expression of CXCR3, ST2, and KLRG1. (D) Frequency of tissue-localized eosinophils in VAT. (E) Representative gating of VAT-Teffs on CXCR3 and ST2 with summarized graphical data. (F) Fasting BGL (top) and GTT (bottom) in HFD-fed mice. (G) ITT in HFD-fed mice. * indicates significant difference between WT and YF; # indicates significant difference between WT and KO. ITT area under the curve (AUC) was calculated for each individual mouse. All data are representative of two independent experiments with n = 4 or 5 per group. For weight (A), GTT (F), and ITT (G), statistical significance was determined using two-way repeated-measures ANOVA with Tukey’s post-test for multiple comparisons. For fasted BGL (F), ITT AUC (G), and all flow cytometry summary graphs, statistical significance was determined using one-way ANOVA with Tukey’s post-test. All graphs are presented as mean values ± SD.
Absence of ICOS supports the accumulation and phenotype of VAT-TRs in a cell-intrinsic manner
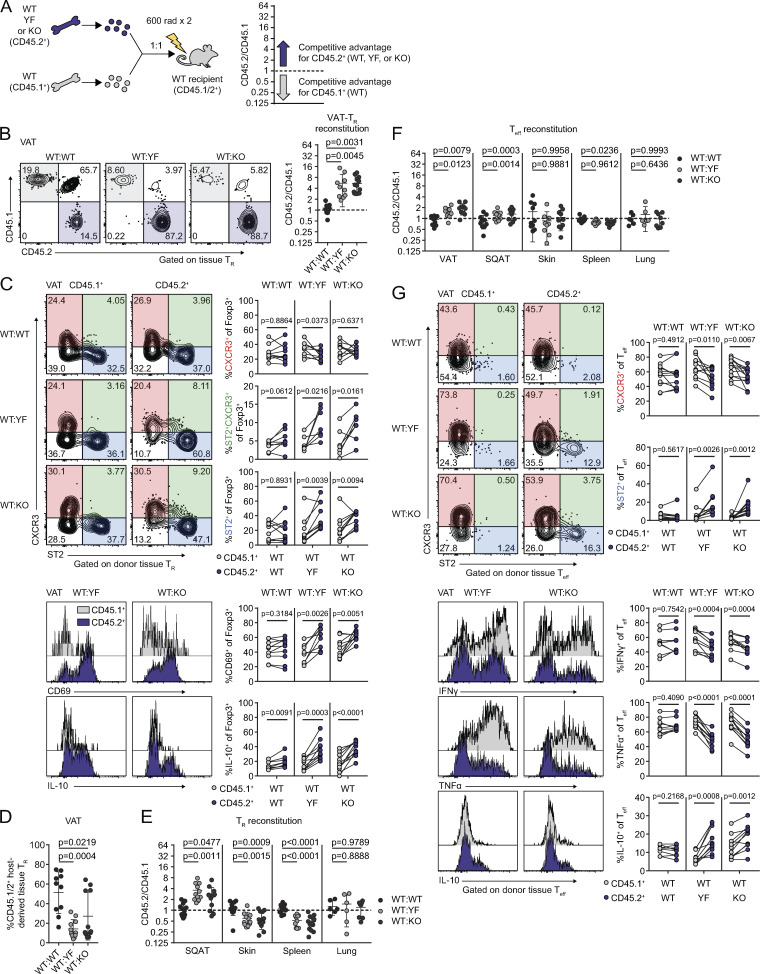
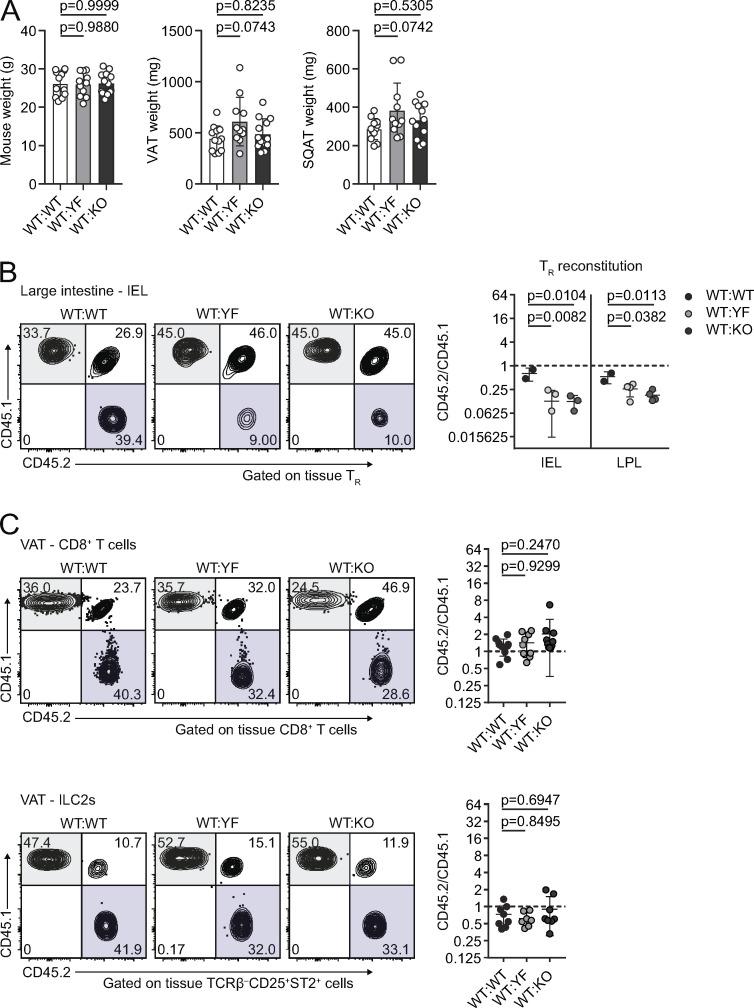
ICOS signaling supports a wide array of cellular processes in the context of adaptive immunity (Panneton et al., 2019). To determine which of the T cell phenotypes we observed in intact YF and KO mice were the result of cell-intrinsic ICOS expression and signaling, we generated mixed bone marrow chimeras using congenically marked CD45.1+ WT and CD45.2+ WT, YF, or KO donors (Fig. 6 A). Body and adipose depot weights were similar between groups of chimeric mice (Fig. S4 A). Consistent with the increased abundance of VAT-TRs that we observed at baseline in intact YF and KO mice, both CD45.2+ YF and KO TRs displayed a competitive advantage compared with CD45.1+ WT TRs in repopulating VAT in our chimeric mice. Whereas WT:WT chimeras reconstituted VAT-TRs at an ∼1:1 ratio, YF and KO TRs exhibited a significantly higher reconstitution ratio of ∼5.5:1 (Fig. 6 B). In addition to supporting VAT-TR abundance, absence of cell-intrinsic ICOS signaling also promoted a canonical VAT-TR phenotype. Within the same chimeras, a higher frequency of YF and KO VAT-TRs expressed CD69 and ST2 (Fig. 6 C). Aligned with data from intact mice, more YF and KO VAT-TRs within chimeras were double-expressers of CXCR3 and ST2 (Fig. 6 C). Functionally, a larger proportion of YF and KO VAT-TRs were poised to produce IL-10 after ex vivo stimulation (Fig. 6 C). Mixed bone marrow chimeras retain a population of radioresistant host TRs, which proliferate to replenish a portion of the available niche after irradiation (Komatsu and Hori, 2007), and this is particularly evident in many nonlymphoid tissues. Remarkably, in addition to preferentially reconstituting VAT compared with WT donor TRs, YF and KO VAT-TRs were able to outcompete endogenous WT VAT-TRs as well, nearly replacing the entire TR compartment in some chimeras (Fig. 6 D).
Figure 6.
Cell-intrinsic ICOS signaling limits TR and Teff abundance and phenotype in VAT. (A) Schematic of mixed bone marrow chimera setup (left) and analysis (right). The dashed line in all subsequent graphs indicates a CD45.2/CD45.1 ratio of 1. (B) Representative gating of CD45.1 versus CD45.2 expression in chimeric mice on tissue-localized TRs in VAT and quantification of donor TR reconstitution in VAT. (C) Representative gating on CXCR3- and ST2-expressing CD45.1+ and CD45.2+ donor VAT-TRs in chimeric mice (top). Lines connect points indicating CD45.1+ and CD45.2+ cells within the same chimeric mouse. Histogram and quantification of CD69 expression in donor VAT-TRs. Histogram and graphical summary of donor VAT-TR expression of IL-10 after 4-h PMA/I + monensin stimulation ex vivo (bottom). (D) Frequency of endogenous CD45.1/2+ VAT-TRs in chimeric mice. (E) Reconstitution of donor TRs in the indicated tissues. (F) Summary of donor Teff reconstitution in the indicated tissues. (G) CXCR3 and ST2 expression by gated VAT-Teff (top). Histograms and summary of donor VAT-Teff expression of IFN-γ, TNFα, and IL-10 after 4-h PMA/I + monensin stimulation ex vivo (bottom). Data are pooled from three independent experiments with n = 3–5 per group. Statistical significance for cell population reconstitution was determined using one-way ANOVA with Tukey’s post-test for each tissue analyzed. Data are presented as mean values ± SD. A two-tailed, paired Student’s t test was used to assess statistical significance when comparing expression in donor cells within the same chimeric mouse.
Figure S4.
Cell- and tissue-specific changes in reconstitution in ICOS mutant mixed bone marrow chimeras (goes with Fig. 6). (A) Summary of total mouse (left), VAT (middle), and SQAT (right) weights in mixed bone marrow chimeras. (B) Representative gating of CD45.1 versus CD45.2 expression on tissue-restricted TRs in IELs from the large intestine. Graphs summarize reconstitution of donor TRs of IELs and lamina propria lymphocytes (LPLs) in the large intestine. (C) Representative gating of CD45.1 versus CD45.2 expression in chimeric mice on total CD8+ T cells (top) and ILC2s (bottom) in VAT. Graphs summarize reconstitution of donor CD8+ T cells (top) and ILC2s (bottom) in VAT. Dashed lines in all graphs indicate a CD45.2/CD45.1 ratio of 1. Data are pooled from three independent mixed bone marrow chimera experiments with n = 3–5 male chimeric mice per group. Statistical significance was determined using one-way ANOVA with Tukey’s post-test for each individual tissue. All data are presented as mean values ± SD.
Contrary to our findings in VAT, YF and KO TRs were at a selective disadvantage in the skin, spleen, and large intestine, with no difference in reconstitution in the lungs (Fig. 6 E and Fig. S4 B). TRs found in SQAT are phenotypically distinct from VAT-TRs and do not appear to accumulate with age (Feuerer et al., 2009; Li et al., 2018). However, unlike in intact mice, we did note that YF and KO donor TRs displayed a competitive advantage in repopulating SQAT in chimeric mice at a ratio of ∼3:1 (Fig. 6 E). This could be due to low-level inflammation following irradiation of the recipient mice that drives reconstitution of the SQAT niche, with TRs exhibiting a VAT-TR phenotype.
Although CD8+ T cells and ILC2s of either genotype were similarly represented (Fig. S4 C), we did find that YF and KO Teffs were modestly, but significantly, enriched in VAT at a ∼2:1 ratio compared with WT Teffs, with no difference in reconstitution of other tissues (Fig. 6 F). A higher frequency of YF and KO VAT-Teffs were ST2+ within the same chimeras, with a reduction in CXCR3-expressing Teffs (Fig. 6 G). Functionally, YF and KO VAT-Teffs were composed of fewer IFN-γ+ and TNFα+ and more IL-10+ cells when stimulated ex vivo (Fig. 6 G), indicating that in addition to driving increased TR abundance, the absence of ICOS signaling also promotes a regulatory phenotype in VAT-Teffs. Taken together, loss of ICOS signaling supports VAT-TR and, to a lesser extent, Teff accumulation and phenotype through cell-intrinsic mechanisms.
ICOS signaling impacts expression of homing receptors in TRs that allow access to VAT
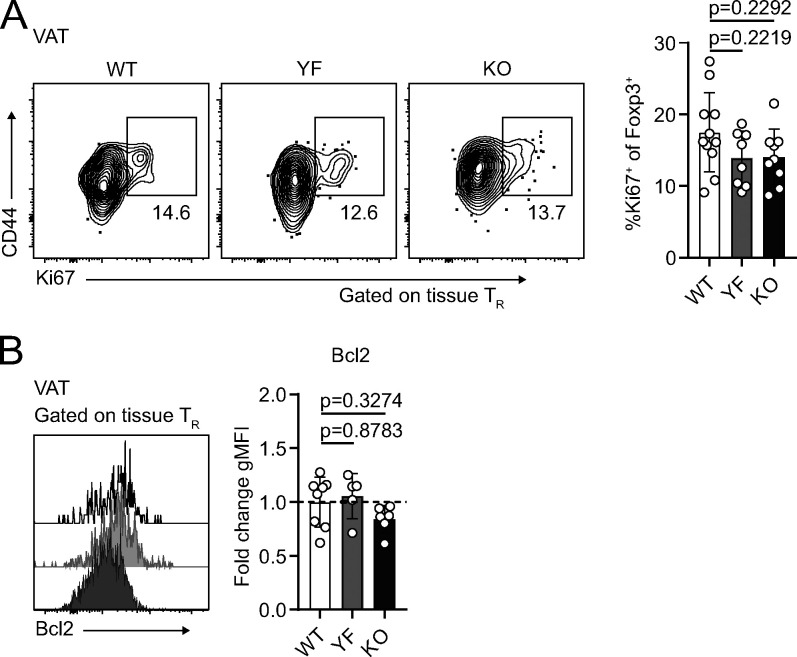
The increased abundance of VAT-TRs from YF and KO mice could result from the combination of increased proliferation, increased survival, or increased migration to the VAT. The proliferation marker Ki67 was expressed by ∼10–20% of VAT-TRs, and we found no significant difference in the frequency of Ki67+ VAT-TRs between WT, YF, and KO mice (Fig. 7 A). Similarly, WT, YF, and KO VAT-TRs expressed similar levels of the prosurvival protein Bcl2 (Fig. 7 B). Despite the lack of differences in Ki67 or Bcl-2 expression, we cannot rule out that changes in cellular turnover contribute to the differences we see, as TRs express other prosurvival factors. However, recent data demonstrating continuous recruitment of TRs to VAT via the circulation led us to assess potential differences in the migration of cells (Vasanthakumar et al., 2020).
Figure 7.
Increased abundance of YF and KO VAT-TR is not due to enhanced proliferation or Bcl2 expression. (A and B) Ki67 (%, A) and Bcl2 (gMFI) expression (B) in tissue-localized VAT-TRs as measured by flow cytometry directly ex vivo. Bcl2 gMFI was calculated as fold change compared with average expression in WT TRs for each individual experiment. Dashed line in B marks average value of WT control samples (Ki67: n = 3–5 per group from three independent experiments; Bcl-2: n = 3–5 per group from two independent experiments). Mice were age matched within independent experiments, and pooled data are from experiments using male mice aged 8–16 wk. Statistical significance was determined using one-way ANOVA with Tukey’s post-test. All data are presented as mean values ± SD.
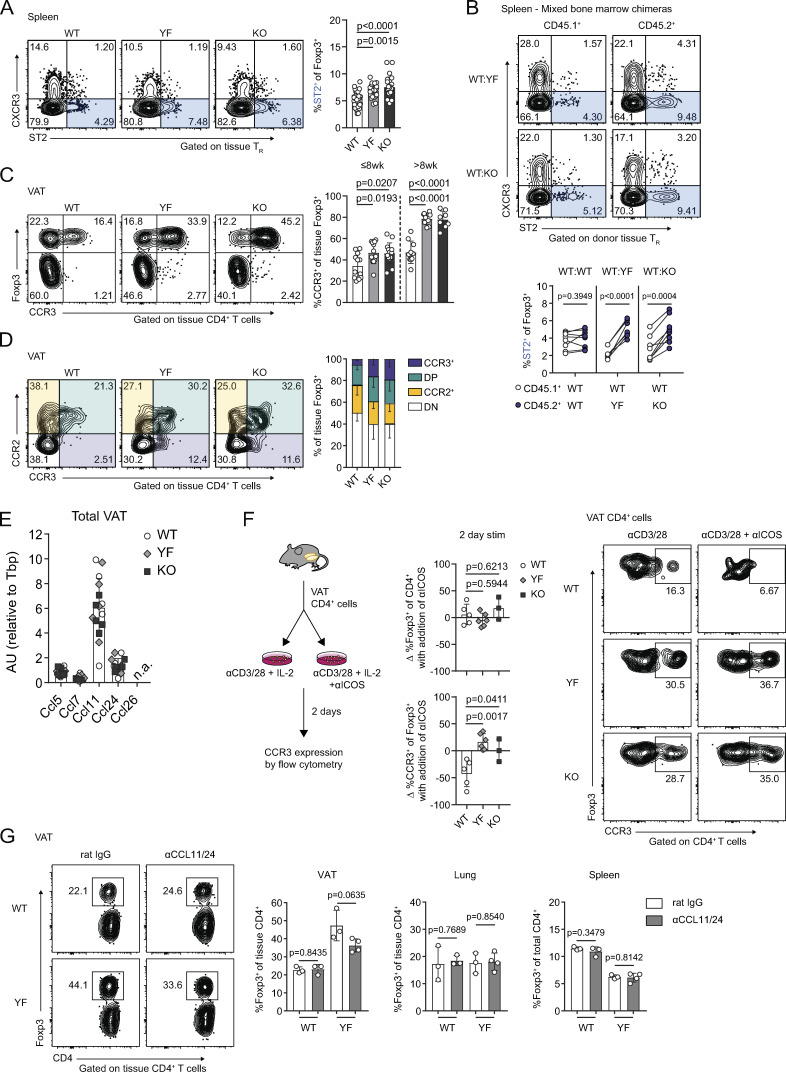
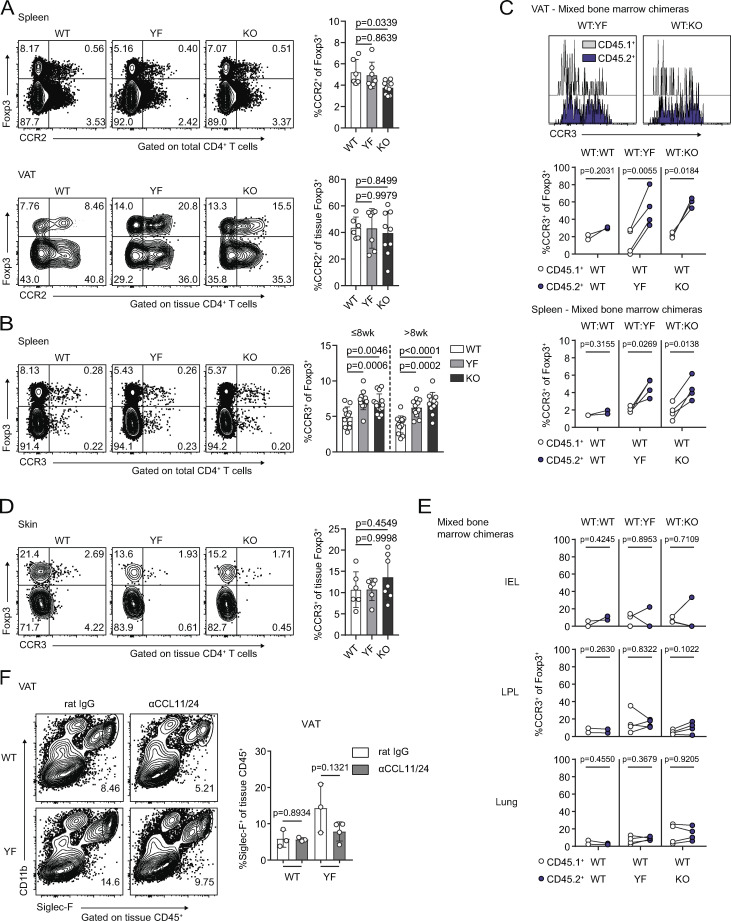
In both intact and mixed bone marrow chimeric mice, YF and KO splenic TRs contained a small but significantly increased population of ST2+ TRs (Fig. 8, A and B), a subset of TRs that is both transcriptionally and epigenetically poised to take up residence in peripheral tissues (Delacher et al., 2017; Delacher et al., 2020). Given this, we hypothesized that superior migration and accumulation could account for the increased frequency of VAT-TRs in YF and KO mice. Although CCR2 facilitates recruitment of TRs to VAT (Vasanthakumar et al., 2020), we detected no difference in CCR2 expression among genotypes and a modest decrease in CCR2+ TRs in KO spleens (Fig. S5 A), arguing against enhanced CCR2-mediated recruitment of YF and KO TRs to VAT.
Figure 8.
Increased VAT-TR accumulation in the absence of ICOS signaling is associated with elevated CCR3 expression. (A) ST2 expression in splenic TRs (n = 3–5 per group from eight independent experiments). (B) ST2 expression in CD45.1+ and CD45.2+ donor splenic TRs in WT:YF and WT:KO chimeric mice. Lines connect CD45.1+ and CD45.2+ donor splenic TRs within the same chimera (n = 3–5 chimeric mice per group from three independent experiments). (C) Expression of CCR3 in VAT-TRs in mice ≤8 wk and >8 wk of age (n = 3–5 per group from seven independent experiments). (D) Expression of CCR2 and CCR3 by VAT-TRs (n = 3–5 per group from two independent experiments). DP, CCR2+CCR3+; DN, CCR2−CCR3−. (E) Expression of indicated CCR3 ligands in total VAT normalized to Tbp as measured by qPCR (n.d. indicates not detected; n = 5 per group). (F) Schematic of in vitro culture experiments examining the impact of ICOS signaling on CCR3 expression (left). Graphs indicating fold change in TR frequency of CD4+ cells and %CCR3+ of TRs between individual culture samples stimulated (stim) with or without αICOS for 2 d (middle). Representative flow cytometry plots with frequency of CCR3+ TRs after 2 d in specified culture conditions (right; n = 1–3 per group from three independent experiments). (G) Left: Representative flow cytometry plots indicating VAT-TR frequency with or without CCL11/24 blockade. Graphs summarize TR frequencies in indicated tissues after 2 wk (n = 3–4 per group). Mice were age matched within independent experiments and collectively; pooled data are from experiments using male mice aged 8–16 wk unless otherwise indicated. Statistical significance was determined using one-way ANOVA with Tukey’s post-test (A and C); two-tailed, paired Student’s t test for expression in donor cells within the same chimeric mouse (B); and two-tailed Student’s t test (F and G). All data are presented as mean values ± SD.
Figure S5.
Increased accumulation of CCR3+ TRs in the absence of ICOS signaling is specific to VAT (goes with Fig. 8). (A) CCR2 expression by splenic (top) and VAT-TRs (bottom) as measured by flow cytometry (n = 3–5 per group from two independent experiments). (B) Expression of CCR3 in splenic TRs in mice ≤8 wk and >8 wk of age (n = 3–5 per group from seven independent experiments). (C) Expression of CCR3 by gated CD45.1+ and CD45.2+ donor VAT-TRs in chimeric mice. Graphs summarize CCR3 expression by donor TRs in VAT and spleen. Line connects point representing CD45.1+ and CD45.2+ cells within the same chimeric mouse (n = 2–4 per group from two independent experiments). (D) CCR3 expression by tissue-localized skin TRs as measured by flow cytometry (n = 2–4 per group from two independent experiments). (E) CCR3 expression by CD45.1+ and CD45.2+ donor TRs within the same chimeric mouse in indicated tissues. Line connects CD45.1+ and CD45.2+ cells within the same chimeric mouse (n = 2–4 per group from two independent experiments). (F) Frequency of tissue-restricted VAT eosinophils with and without in vivo CCL11/24 blockade as measured by flow cytometry (n = 3 or 4 mice per group). Mice were age matched within individual experiments, and pooled data are from experiments using 8–16-wk-old male mice. Statistical significance was determined using one-way ANOVA with Tukey’s post-test (A, B, and D); two-tailed, paired Student’s t test for expression in donor cells within the same chimeric mouse (C and E); and two-tailed Student’s t test (F). All data are presented as mean values ± SD. LPL, lamina propria lymphocyte.
Previous studies identified an open chromatin landscape around the Ccr3 locus as well as high Ccr3 transcript levels in VAT-TRs (Cipolletta et al., 2012; Li et al., 2018). The frequency of CCR3-expressing splenic TRs was slightly elevated in both young (≤8 wk) and older (>8 wk) YF and KO mice (Fig. S5 B), indicating the presence of a TR population primed for both potential early seeding and continuous repopulation of peripheral tissues. In line with this, YF and KO VAT contained more CCR3+ TRs compared with WT mice, and this population increased with age (Fig. 8 C). In mixed bone marrow chimeras, a significantly greater frequency of YF and KO donor TRs were CCR3+ in spleen and VAT (Fig. S5 C). Additionally, YF and KO VAT contained a unique population of TRs that expressed CCR3 alone, while WT VAT-TRs expressing CCR3 were also positive for CCR2 (Fig. 8 D). CCR3 expression was unique to VAT-TRs, unlike CCR2, which we found to be also highly expressed on VAT-Teffs (Fig. 8 C). Additionally, the accumulation of CCR3+ TRs was unique to VAT, as we detected very little CCR3 expression in skin, lungs, and large intestine TRs, and no differences across genotypes (Fig. S5, D and E). We detected substantial expression of the CCR3 ligands Ccl11 and Ccl24 in the VAT, with no differences detected either by age or genotype and little expression of Ccl5, Ccl7, and Ccl26 (Fig. 8 E).
To determine if ICOS signaling could directly impact expression of CCR3 on TRs, WT, YF, and KO VAT-CD4+ cells were cultured with αCD3/αCD28 in the presence or absence of an agonistic αICOS Ab (Fig. 8 F). We additionally added 500 U/ml IL-2 to all conditions to account for any deficiencies in IL-2 production by YF and KO VAT-Teffs. After 48 h in culture, TR frequency remained unchanged in both groups. However, the frequency of CCR3+ TRs in WT cultures significantly decreased after 2 d with addition of an ICOS agonist, whereas no changes were observed in YF or KO cultures, indicating that ICOS-dependent PI3K signaling can directly antagonize CCR3 expression in TRs (Fig. 8 F).
To address the impact of CCR3 signaling on continuous TR seeding of VAT in vivo, we administered blocking antibodies to the CCR3 ligands CCL11 and CCL24 to 8–10-wk-old WT and YF mice. Blockade of CCL11/24 for ∼2 wk resulted in a modest, although not statistically significant, decrease in the frequency of VAT-TRs specifically in YF mice, with no differences in TR abundance in spleen or lungs between treated and untreated mice (Fig. 8 G). We additionally noted a slight reduction in VAT eosinophils in YF mice treated with αCCL11/24 (Fig. S5 F). Together, these results suggest a potential mechanism by which loss of ICOS-dependent PI3K signaling can drive increased recruitment of TRs to VAT by CCR3-CCL11/24 interactions.
Discussion
We have identified surprising tissue-specific effects of ICOS signaling on TR abundance and phenotype. Although there was a significant loss of CD44+ eTRs in the spleen, pLN, skin, and lungs of YF and KO mice compared with WT, there was a substantial increase in TR abundance in VAT. TR frequency and phenotype were similar in YF and KO mice, including comparably altered readouts of PI3K signaling, suggesting that ICOS primarily impacts TR abundance and homeostasis via PI3K-dependent mechanisms.
In addition to supporting VAT-TR abundance, loss of ICOS signaling promoted a highly suppressive VAT-TR phenotype, including an increased proportion of TRs expressing KLRG1, CD69, and IL-10. In vitro, addition of ICOS stimulation augments IL-10 production in CD4+ T cells, while loss of ICOS signaling in vivo results in reduced TR abundance and IL-10 expression in models of autoimmunity, allergy, and infection (Busse et al., 2012; Hutloff et al., 1999; Kohyama et al., 2004; Kornete et al., 2012; Landuyt et al., 2019; Redpath et al., 2013). Although ICOS expression is associated with IL-10–producing TRs, ICOS signaling does not appear to be intrinsically required for IL-10 production. CD4+ T cells from KO mice are capable of producing WT levels of IL-10 in vitro and, interestingly, appear to produce more IL-10 than WT counterparts under Th2-polarizing conditions (Dong et al., 2001). Furthermore, recent studies assessing TRs in the brain during chronic Toxoplasma gondii infection and lamina propria TRs at baseline report no changes in IL-10 production in the presence or absence of ICOS signaling (Landuyt et al., 2019; O’Brien et al., 2019). Therefore, the reduction in IL-10+ TRs with ICOS blockade observed in specific in vivo models is likely due to insufficient activation or access to specific environmental cues within tissues rather than an inherent requirement for ICOS signaling to drive IL-10 production.
VAT is a complex tissue, consisting of triglyceride-containing adipocytes and a variety of immune cells that function to maintain metabolic homeostasis. In YF and KO mice, other immune cells in addition to TRs showed evidence of an anti-inflammatory phenotype. Although ATM and VAT-ILC2 abundance was similar across genotypes at baseline, eosinophil frequency was significantly elevated in YF and KO VAT. In YF and KO mice, VAT-Teffs were skewed toward a Th2 phenotype in a cell-intrinsic manner, with an increased frequency of ST2-expressing and IL-10–producing cells. Therefore, in addition to promoting an anti-inflammatory state by sustaining VAT-TRs, global loss of ICOS signaling sup-ports the abundance and phenotype of other anti-inflammatory adipose-resident immune cells. These combined changes in cellular composition in VAT in the absence of ICOS signaling were maintained in the setting of a long-term HFD and rendered YF and KO mice more resistant to HFD-induced loss of insulin sensitivity. Changes in insulin responsiveness were subtle, despite a significant increase in TRs in YF and KO mice. A recent study demonstrated that ablation of IL-10 improved insulin sensitivity in mice (Rajbhandari et al., 2018). Thus, it is possible that the increased IL-10 production we observed in VAT-TRs and VAT-Teffs in the absence of ICOS signaling offsets the insulin-sensitizing effects of increased VAT-TR abundance in these mice.
YF and KO donor TRs preferentially repopulated VAT in mixed bone marrow chimeras and were able to outcompete both donor and endogenous WT TRs. ST2 is expressed on a large fraction of VAT-TRs (Vasanthakumar et al., 2015), and although the frequency of ST2-expressing VAT-TRs was not changed in intact mice, YF and KO VAT-TRs in mixed bone marrow chimeras were composed of significantly more ST2+ cells compared with WT donor TRs, suggesting that the competitive advantage of YF and KO donor TRs in chimeric VAT is in part due to an enhanced ability to access available IL-33 through increased ST2 expression. The transcriptional regulators BATF and IRF4 cooperate to induce expression of ST2 in TRs, possibly down-stream of TCR signals as well as through IL-33 signaling itself (Vasanthakumar et al., 2015). Additionally, IL-2 can work synergistically with IL-33 to up-regulate ST2 and specifically expand ST2+ TRs (Guo et al., 2009; Matta et al., 2014). TRs are unable to produce IL-2 themselves due to Foxp3-mediated transcriptional repression at the Il2 locus (Wu et al., 2006; Ono et al., 2007) and therefore are dependent on paracrine sources of IL-2 produced by, for example, autoreactive Teffs (Setoguchi et al., 2005; Stolley and Campbell, 2016). However, KO Teffs are defective in production of IL-2 compared with Teffs from WT mice (Dong et al., 2001). The absence of an enriched population of ST2-expressing YF and KO VAT-TRs at baseline may be explained by this lack of IL-2, which is rescued in the presence of WT IL-2–producing cells in mixed bone marrow chimeras.
Molofsky et al. (2015) have argued that IL-33 signaling on TRs in VAT is mediated through ICOS/ICOSL interactions with ILC2s and that absence of this interaction results in loss of VAT-TRs. In their system, blockade of ICOS signaling was assessed in Icosl−/− mice. Consistent with their data in Icosl−/− mice, we did not observe any differences in ILC2 frequency or number in VAT of KO or YF mice. However, given that ILC2s express both ICOS and ICOSL, loss of one versus the other could differentially impact ILC2 function, resulting in unique cell-extrinsic impacts on TRs. Additionally, recent work revealed ligand-independent, constitutive ICOS signaling through PI3K-dependent pathways, which relies on p85 association with the ICOS cytoplasmic YMFM motif and interactions between the ICOS transmembrane domain and the tyrosine kinase Lck (Feito et al., 2003; Wan et al., 2020). Thus, the reported differences observed in our study and Molofsky’s may be the result of low-level, cell-intrinsic PI3K activation in ICOS-expressing TRs from Icosl−/− mice.
Although CCR2 plays an important role in recruitment of TRs to VAT, we did not detect any differences in CCR2 expression in the absence of ICOS signaling. However, the frequency of CCR3+ TRs was increased in the spleen and VAT of YF and KO mice, which was due to cell-intrinsic loss of ICOS signaling and was enhanced with age. CCR3 is primarily associated with type 2 responses (Danilova et al., 2015; Francis et al., 2007; Humbles et al., 2002; Ma et al., 2002; Nagakubo et al., 2016), and lean, metabolically healthy VAT is maintained in an anti-inflammatory state by the presence of Th2-associated cells. In vivo blockade of CCL11/24 resulted in a modest reduction of TRs in YF VAT with no changes in other tissues analyzed. Para-biosis experiments demonstrated recruitment of circulating parabiont-derived TRs to VAT after months of shared circulation (Kolodin et al., 2015; Vasanthakumar et al., 2020), indicating that recruitment of TRs to VAT occurs throughout adulthood. Thus, longer-term Ab-mediated blockade may be necessary to observe significant effects on TR accumulation in our system. Additionally, addressing the role of CCR3 is further complicated by its promiscuity, and whether compensation through other ligands occurs during in vivo blockade is unknown. In vitro, we found that ICOS stimulation resulted in reduced CCR3 expression in WT VAT-TRs, with no changes in YF or KO cultures, suggesting that ICOS-dependent PI3K signaling inhibits expression of CCR3. Control of CCR3 expression in T cells has not been extensively characterized; however, there is evidence that the transcription factor GATA3 is able to bind to a regulatory region in the Ccr3 locus (Kong et al., 2013). Nonlymphoid TRs, including VAT-TRs, express high levels of GATA3 (Cipolletta et al., 2012; Delacher et al., 2020). However, whether ICOS signaling impacts CCR3 expression by modulating GATA3 expression or activity and whether GATA3 is involved in controlling CCR3 expression in TRs remain to be explored.
Most studies assessing VAT-TR biology use older male mice due to an increased abundance of canonical VAT-TRs with age (Cipolletta et al., 2015). However, mediators of tissue inflammation, including IL-6, TNFα, and IL1β, are up-regulated in the VAT of aged male mice (older than 24 wk; Wu et al., 2007). We observed consistent accumulation of VAT-TRs from 5 wk on in all three genotypes, which was correlated with an increase in CCR3+ TRs up to ∼20 wk of age. CCR2 regulates T cell access to sites of inflammation (Lee et al., 2007), and studies assessing the contribution of CCR2 on TR migration to VAT use mice aged 25–30 wk, when measures of VAT inflammation are increasing. CCR2 and CCR3 likely both have important roles for promoting recruitment of TRs to VAT; however, it will be necessary to evaluate whether these receptors are used differentially based on age, sex, and inflammation. For example, CCR3 may be one important factor for early seeding and continuous recruitment of TRs to VAT in comparatively younger mice when VAT inflammation is low. With increasing age and inflammation (particularly in male mice), a switch to CCL2-CCR2–mediated migration may dominate.
Future studies are required to understand how ICOS exerts tissue-specific effects. The skin and lungs are under chronic stimulation by environmental antigens and commensal microbes, whereas the sterile VAT is maintained in a Th2-skewed environment in metabolically healthy mice. The milieu of chemokines and cytokines expressed at baseline in these tissues is likely very different. Indeed, TRs express distinct patterns of homing receptors and adhesion molecules to appropriately access specific nonlymphoid tissues (reviewed in Campbell and Koch, 2011). Absence of ICOS signaling may support expression of chemokine receptors that preferentially drive TRs to VAT due to constitutive expression of unique chemokines within this tissue. Additionally, VAT-TRs may rely less on PI3K signals than TRs found from other tissues, due to the presence of other supporting factors in the VAT of naive mice, such as high levels of IL-33. Indeed, a recent study demonstrated that insulin receptor deletion in TRs, which also results in reduced PI3K signaling, led to an increased suppressive phenotype in VAT-TRs and enhanced insulin sensitivity (Wu et al., 2020).
We describe a surprising, antagonistic role for ICOS-dependent PI3K signaling in the accumulation, prototypical phenotype, and function of TRs specifically in VAT. We suggest that absence of ICOS signaling supports enhanced recruitment of TRs to VAT associated with increased expression of CCR3. Further studies will be needed to identify the molecular mechanisms by which ICOS inhibits the VAT-TR phenotype and CCR3 expression. This highlights the complexity of tissue-specific TR development and accumulation and the importance of considering how signals from the immune environment elicit both cell- and tissue-specific effects.
Materials and methods
Mice
CD45.1+ B6.SJL (B6.SJL-PtprcaPepcb/BoyJ), B6.Icos−/− (B6.129P2-Icostm1Mak/J), and B6.Foxp3mRFP (C57BL/6-Foxp3tm1Flv/J) mice were purchased from The Jackson Laboratory. B6.IcosY181F mice were provided by M. Pepper (University of Washington, Seattle, WA). All mice were backcrossed to a C57BL/6J background for at least 10 generations. Foxp3mRFP mice were used as WT controls, and mice from different genotypes used were cohoused at weaning. CD45.1+ B6.SJL mice were crossed to B6.Foxp3mRFP mice to generate Foxp3mRFP mice expressing CD45.1, CD45.2, and CD45.1/.2 allelic variants. B6.Icos−/− and B6.IcosY181F mice were crossed to B6.Foxp3mRFP mice to generate B6.Icos−/− and B6.IcosY181F mice expressing Foxp3mRFP. All animals were bred and housed in specific pathogen–free conditions under the approval of the Institutional Animal Care and Use Committee of the Benaroya Research Institute. Males were used unless specified otherwise. Age of mice is indicated per experiment.
Mixed bone marrow chimeras
Bone marrow cells were prepared from donor mice by flushing femurs and tibias with PBS. RBCs from filtered cells were lysed in ammonium-chloride-potassium lysis buffer (Life Technologies) for 5 min at room temperature (RT). Recipient mice were lethally irradiated (2 × 600 rad separated by ≥4 h). Mixed bone marrow chimeras were generated by retro-orbitally injecting a 1:1 ratio (≥2 × 10⁶ total cells) of bone marrow cells of the appropriate genotypes into anesthetized recipient mice. Chimeric mice were rested for ≥10 wk.
Intravascular labeling
Mice were anesthetized with 4% isoflurane, and 3 µg BV510- or BV650-conjugated CD45 (30-F11) was injected into mice retro-orbitally in 200 µl PBS 5 min before sacrifice. Single-cell suspensions were prepared for flow cytometry as described below, and localization of cells was determined by positive (blood-exposed) and negative (tissue-restricted) staining.
Cell isolation
Single-cell suspensions were prepared from spleen and pLNs (pooled inguinal, axillary, brachial, and superficial cervical nodes) by tissue disruption with frosted glass slides into RPMI with 10% bovine calf serum (BCS; R-10) and filtered through nitex mesh. Blood was collected via cardiac puncture into PBS containing 2 mM EDTA. Epididymal VAT and inguinal SQAT were excised, finely minced with scissors, and digested in RPMI basal medium with 0.14 U/ml Liberase (Roche) and 10 U/ml DNase I (Roche) for 30 min at 37°C with shaking (200 rpm). Supernatants were filtered through a 100-µM cell strainer and washed several times to remove mature adipocytes from the stromal vascular fraction. Ears were harvested for skin-infiltrating cells. Dorsal and ventral sides were separated using forceps and digested as described for VAT/SQAT for 45 min. Lungs were digested as described for skin. Large intestines were cleaned, stripped of fatty tissue, and inverted. Tissue was placed into extraction media (RPMI basal medium, 2 mM dithiothreitol, 1 mM EDTA, and 2% BCS) and shaken at 37°C for 20 min to release intraepithelial lymphocytes (IELs). IEL-containing supernatant was removed and filtered into 50-ml conical tubes. For lamina propria lymphocyte isolation immediately following incubation with extraction media, tissue was finely minced and placed into digestion media (RPMI basal media, 300 U/ml collagenase I [Worthington Biochemical Corporation], and 1% BCS), shaken for 30 min at 37°C, and filtered into 50-ml conical tubes. Isolated cells from all tissues were incubated in ammonium-chloride-potassium lysis buffer for 5 min, washed with R-10, and stained for flow cytometry or cultured for intracellular cytokine or chemokine receptor staining.
Flow cytometry and intracellular cytokine staining
Single-cell suspensions were stained with Fixable Viability Dye eFluor 780 (eBioscience) in PBS for 10 min at RT. For surface staining, cells were incubated at 4°C for 30 min in FACS buffer (PBS, 2% BCS) with directly conjugated Abs for murine proteins. Abs were purchased from BioLegend unless noted: CD4 (RM4-5), CD8 (53–6.7), CD11b (M1/70), CD11c (N418), CD25 (PC61), CD44 (IM7), CD45 (30-F11), CD45.1 (A20), CD45.2 (104), CD62L (MEL-14), CD69 (H1.2F3), CD206 (C068C2), CXCR3 (CXCR3-173), F4/80 (BM8), Gr1 (RB6-8C5), ICOS (15F9), KLRG1 (2F1/KLRG1), Siglec-F (E50-2440; BD Biosciences), ST2 (U29-93; BD Biosciences), and TCRβ (H57-597). For intracellular staining, cells were stained for surface antigens as described above, washed, and permeabilized for 20 min with eBioscience Fix/Perm buffer at 4°C. Cells were washed and stained in PermWash buffer (eBioscience) for 30 min at 4°C with Abs (purchased from BioLegend unless noted) against Bcl2 (BCL/10C4), CTLA-4 (UC10-4B9), Foxp3 (FJK-16s; Invitrogen), IFN-γ (XMG1.2; BD Biosciences), IL-10 (JES5-16E3), Ki67 (11F6), and TNFα (MP6-XT22). For intracellular cytokine staining following restimulation, cells were incubated in FACS tubes with PMA (50 ng/ml) and ionomycin (1 µg/ml) plus monensin (2 µM) in 0.3 ml complete RPMI medium (RPMI with 10% [vol/vol] fetal bovine serum, 100 U/ml penicillin, 100 µg/ml streptomycin, 25 µg/ml gentamycin, 1 mM sodium pyruvate, 10 mM Hepes, 2 mM L-glutamine, and 55 µM β-ME) for 4 h at 37°C, 5% CO2 before staining as described above. Loss of monomeric RFP expression occurred with our fixation/permeabilization protocols, requiring intracellular Foxp3 staining. Data were acquired on LSR II or FACSCanto flow cytometers (BD Biosciences) and analyzed using FlowJo software (TreeStar). Due to intraexperimental variability, geometric mean fluorescence intensity (gMFI) was normalized as fold change compared with average expression in WT samples per experiment. Polybead polystyrene nonfluorescent microspheres (15 mm; Polysciences) were used to determine absolute cell numbers in flow cytometry samples. 100 µl of a fixed concentration (CB) of beads was mixed with 100 µl cells to be counted. Samples were acquired on a flow cytometer, with gates drawn on lymphocyte and bead populations based on their forward- and side-scatter properties. The ratio of lymphocyte gate events (NL) to bead gate events (NB) was determined and used to calculate the concentration (CL) of the original cell suspension as follows: CL = (NL/NB) × CB.
Phospho-flow cytometry staining
Approximately one fourth of each spleen was immediately disrupted between frosted glass slides into BD Fix/Perm buffer (BD Biosciences). Cells were incubated for 20 min at RT, washed in FACS buffer, and resuspended in 90% ice-cold methanol for ≥30 min. Cells were washed with BD Perm/Wash buffer (BD Biosciences) and stained for surface and intracellular antigens, including p-S6 (D57.2.2E; Cell Signaling Technology), for 45 min at RT.
Chemokine receptor staining
Freshly isolated cells were incubated for 2.5 h at 37°C, 5% CO2 in RPMI-C. For CCR7 expression, cells were incubated with CCL19-human IgGFc fusion protein for 20 min at 4°C, washed, and then incubated with PE-conjugated goat anti-human IgGFc (Jackson ImmunoResearch Laboratories) for 20 min at 4°C. To detect CCR2 (475301; R&D Systems) and CCR3 (J073E5; BioLegend), cells were incubated for 30 min at 37°C with directly conjugated antibodies diluted in FACS buffer. Cells were washed twice with FACS buffer before being acquired on the flow cytometer.
Histology
VAT was excised, immediately fixed in 10% formalin for 24 h, and then paraffin embedded. H&E staining was performed on 6-µm tissue sections by the Benaroya Research Institute Histology Core. Slides were imaged at RT with a Leica DM E brightfield microscope with a 10× eyepiece and 20× objective lens (together, 200×). Images were captured with a Leica EC3 3.1 megapixel digital color camera and imported into Leica Application Suite EZ imaging software.
RNA extraction and quantitative PCR (qPCR)
VAT was dissected, immediately stabilized in RNAlater (Thermo Fisher), and frozen at −20°C until ready for processing. ∼100 mg tissue was homogenized in 1 ml Qiazol, and RNA was extracted using RNeasy Lipid Tissue Mini Kit (Qiagen) according to the manufacturer’s instructions. RNA quality and quantity were determined using an ND-1000 spectrophotometer (NanoDrop; Thermo Fisher). 500 ng template RNA was reverse transcribed with random hexamer primers in 20 µl using the RevertAid First Strand cDNA Synthesis Kit (Thermo Fisher) and subsequently diluted 1:3.3 with nuclease-free water. qPCR was performed using 2 µl diluted cDNA and presynthesized TaqMan Gene Expression assays in TaqMan Gene Expression Master Mix (Applied Biosystems) for amplification of the following transcripts in a final volume of 20 µl: Ccl5 (Mm01302427_m1), Ccl7 (Mm00443113_m1), Ccl11 (Mm0441238_m1), Ccl24 (Mm00444701_m1), and Ccl26 (Mm02763057_u1). Samples were run in technical triplicates using the QuantStudio 5 Real-Time PCR System (Thermo Fisher) with 10-min initial activation at 95°C followed by 40 cycles of 15 s at 95°C, 60 s at 60°C. Mean target mRNA levels were calculated by the ΔΔCT method and normalized to Tbp (Mm01277042_m1) expression using QuantStudio Design and Analysis Software (Thermo Fisher).
In vitro stimulation of VAT T cells
VAT was pooled from two or three mice of the same genotype to ensure adequate cell number for culture. Cells were isolated as described above, and CD4+ T cells were enriched by incubating cells with CD4 MicroBeads and positively selecting with MACS cell separation MS columns (Miltenyi Biotec). Purified cells were resuspended in RPMI-C with 500 U/ml recombinant IL-2 (eBioscience). Cells were cultured for 48 h in 96-well flat-bottom plates with plate-bound αCD3 (2C11) and αCD28 (37.51) from Bio X Cell at 1 µg/µl, with or without the addition of plate-bound αICOS (C398.4A; BioLegend) at 2 µg/µl. Expression of CCR3 was assessed by flow cytometry as described above.
Rapamycin treatment
Mice were given rapamycin (1 mg/kg) three times per week for 3 wk by i.p. injection in PBS containing 5.2% PEG-400, 5.2% Tween 80, and 0.5% ethanol. Control animals were given vehicle only. Mice were euthanized for analysis of TR abundance in the spleen and VAT 2 d after the final injection.
In vivo Ab blockade
Mice aged 8–10 wk were given 0.75 µg/g body weight αCCL11 and αCCL24 (MAB420 and MAB528; R&D Systems) or an equivalent amount of rat IgG (Sigma) diluted in PBS by i.p. injection on days 0, 5, and 10 and sacrificed for analysis on day 13.
HFD
Mice were placed on an 18-wk HFD (60% kcal fat diet; Research Diets D124928, ad libitum) beginning at 5–7 wk of age. Weights and BGL by tail prick (Contour Next One glucose meter; Ascensia Diabetes Care) were taken weekly after 6 h of fasting.
ITT and GTT
ITTs were performed in conscious mice fasted for 6 h. 1 U/kg human insulin (Sigma) was given i.p., and blood was collected by tail prick for BGL at 0, 15, 30, 45, and 60 min after insulin administration. 3 d later, GTTs were performed in conscious mice fasted for 6 h. 1 g/kg glucose (Sigma) was administered i.p. Blood was collected by tail prick for BGL at 0, 15, 30, 60, 90, and 120 min after glucose bolus.
Statistical analysis
All data are presented as mean values ± SD, and graphs were created and analyzed using Prism Software (GraphPad). Comparisons between genotypes were analyzed using one- or two-way ANOVA where appropriate, adjusted for multiple comparisons using Tukey’s post-test. For mixed bone marrow chimeras, statistical significance was determined using two-tailed, paired Student’s t tests when comparing cells within the same chimeric mouse.
Online supplemental material
Fig. S1 shows ICOS expression across gated splenic TR populations and summarizes pLN TR frequency. Fig. S2 shows further characterization of splenic and VAT-TRs by flow cytometry and the impact of rapamycin treatment on TR abundance in the spleen and VAT. Fig. S3 shows VAT histology (H&E staining) and frequencies of ATM and ILC2 populations by flow cytometry. Fig. S4 shows further characterization of mixed bone marrow chimeras. Fig. S5 expands on CCR2 and CCR3 expression in specific tissues in both intact and chimeric mice (flow cytometry) and characterizes eosinophil frequencies in VAT after in vivo CCL11/24 blockade.
Acknowledgments
We thank A. Wojno, K. Arumuganathan, and T. Nguyen for maintaining the Benaroya Research Institute Flow Cytometry Core; P. Johnson in the Benaroya Research Institute Histology/Imaging Core; and D. Hackney and S. Zraika from the University of Washington Diabetes Research Center Cell Function Analysis Core for help with metabolic profiling tests. M. Pepper generously provided IcosY181F mice with kind permission from W.-K. Suh. A. Burich, C. Toledano, and the Benaroya Research Institute vivarium staff helped maintain mouse colonies. We thank members of the Campbell laboratory for helpful discussion and laboratory support.
This work was supported by the National Institutes of Health (grants R01AI124693 and R01AI136475 to D.J. Campbell) and National Institutes of Health National Institute of Allergy and Infectious Diseases T32 grant AI106677 and National Institute of General Medical SciencesT32 grant GM007270 (to K.L. Mittelsteadt), and the University of Washington Diabetes Research Center Samuel and Althea Stroum Endowed Graduate Fellowship (2P30 DK17047) to K.L. Mittelsteadt.
Author contributions: K.L. Mittelsteadt and D.J. Campbell conceptualized the study and designed experiments. K.L. Mittelsteadt, E.T. Hayes, and D.J. Campbell performed experiments. K.L. Mittelsteadt and D.J. Campbell analyzed data and wrote the manuscript.
References
- Ahnstedt, H., Roy-O’Reilly M., Spychala M.S., Mobley A.S., Bravo-Alegria J., Chauhan A., Aronowski J., Marrelli S.P., and McCullough L.D.. 2018. Sex differences in adipose tissue CD8+ T cells and regulatory T cells in middle-aged mice. Front. Immunol. 9:659. 10.3389/fimmu.2018.00659 [DOI] [PMC free article] [PubMed] [Google Scholar]
- Ali, N., Zirak B., Rodriguez R.S., Pauli M.L., Truong H.-A., Lai K., Ahn R., Corbin K., Lowe M.M., Scharschmidt T.C., et al. 2017. Regulatory T cells in skin facilitate epithelial stem cell differentiation. Cell. 169:1119–1129.e11. 10.1016/j.cell.2017.05.002 [DOI] [PMC free article] [PubMed] [Google Scholar]
- Anderson, K.G., Mayer-Barber K., Sung H., Beura L., James B.R., Taylor J.J., Qunaj L., Griffith T.S., Vezys V., Barber D.L., and Masopust D.. 2014. Intravascular staining for discrimination of vascular and tissue leukocytes. Nat. Protoc. 9:209–222. 10.1038/nprot.2014.005 [DOI] [PMC free article] [PubMed] [Google Scholar]
- Arimura, Y., Kato H., Dianzani U., Okamoto T., Kamekura S., Buonfiglio D., Miyoshi-Akiyama T., Uchiyama T., and Yagi J.. 2002. A co-stimulatory molecule on activated T cells, H4/ICOS, delivers specific signals in T(h) cells and regulates their responses. Int. Immunol. 14:555–566. 10.1093/intimm/dxf022 [DOI] [PubMed] [Google Scholar]
- Arpaia, N., Green J.A., Moltedo B., Arvey A., Hemmers S., Yuan S., Treuting P.M., and Rudensky A.Y.. 2015. A distinct function of regulatory T cells in tissue protection. Cell. 162:1078–1089. 10.1016/j.cell.2015.08.021 [DOI] [PMC free article] [PubMed] [Google Scholar]
- Burhans, M.S., Hagman D.K., Kuzma J.N., Schmidt K.A., and Kratz M.. 2019. Contribution of adipose tissue inflammation to the development of type 2 diabetes mellitus. Compr. Physiol. 9:1–58. 10.1002/cphy.c170040 [DOI] [PMC free article] [PubMed] [Google Scholar]
- Burmeister, Y., Lischke T., Dahler A.C., Mages H.W., Lam K.-P.P., Coyle A.J., Kroczek R.A., and Hutloff A.. 2008. ICOS controls the pool size of effector-memory and regulatory T cells. J. Immunol. 180:774–782. 10.4049/jimmunol.180.2.774 [DOI] [PubMed] [Google Scholar]
- Burzyn, D., Kuswanto W., Kolodin D., Shadrach J.L., Cerletti M., Jang Y., Sefik E., Tan T.G., Wagers A.J., Benoist C., and Mathis D.. 2013. A special population of regulatory T cells potentiates muscle repair. Cell. 155:1282–1295. 10.1016/j.cell.2013.10.054 [DOI] [PMC free article] [PubMed] [Google Scholar]
- Busse, M., Krech M., Meyer-Bahlburg A., Hennig C., and Hansen G.. 2012. ICOS mediates the generation and function of CD4+CD25+Foxp3+ regulatory T cells conveying respiratory tolerance. J. Immunol. 189:1975–1982. 10.4049/jimmunol.1103581 [DOI] [PubMed] [Google Scholar]
- Campbell, D.J. 2015. Control of regulatory T cell migration, function, and homeostasis. J. Immunol. 195:2507–2513. 10.4049/jimmunol.1500801 [DOI] [PMC free article] [PubMed] [Google Scholar]
- Campbell, D.J., and Koch M.A.. 2011. Phenotypical and functional specialization of FOXP3+ regulatory T cells. Nat. Rev. Immunol. 11:119–130. 10.1038/nri2916 [DOI] [PMC free article] [PubMed] [Google Scholar]
- Cipolletta, D., Feuerer M., Li A., Kamei N., Lee J., Shoelson S.E., Benoist C., and Mathis D.. 2012. PPAR-γ is a major driver of the accumulation and phenotype of adipose tissue Treg cells. Nature. 486:549–553. 10.1038/nature11132 [DOI] [PMC free article] [PubMed] [Google Scholar]
- Cipolletta, D., Cohen P., Spiegelman B.M., Benoist C., and Mathis D.. 2015. Appearance and disappearance of the mRNA signature characteristic of Treg cells in visceral adipose tissue: age, diet, and PPARγ effects. Proc. Natl. Acad. Sci. USA. 112:482–487. 10.1073/pnas.1423486112 [DOI] [PMC free article] [PubMed] [Google Scholar]
- Cretney, E., Xin A., Shi W., Minnich M., Masson F., Miasari M., Belz G.T., Smyth G.K., Busslinger M., Nutt S.L., and Kallies A.. 2011. The transcription factors Blimp-1 and IRF4 jointly control the differentiation and function of effector regulatory T cells. Nat. Immunol. 12:304–311. 10.1038/ni.2006 [DOI] [PubMed] [Google Scholar]
- Danilova, E., Skrindo I., Gran E., Hales B.J., Smith W.A., Jahnsen J., Johansen F.E., Jahnsen F.L., and Baekkevold E.S.. 2015. A role for CCL28-CCR3 in T-cell homing to the human upper airway mucosa. Mucosal Immunol. 8:107–114. 10.1038/mi.2014.46 [DOI] [PubMed] [Google Scholar]
- Deiuliis, J., Shah Z., Shah N., Needleman B., Mikami D., Narula V., Perry K., Hazey J., Kampfrath T., Kollengode M., et al. 2011. Visceral adipose inflammation in obesity is associated with critical alterations in tregulatory cell numbers. PLoS One. 6:e16376. 10.1371/journal.pone.0016376 [DOI] [PMC free article] [PubMed] [Google Scholar]
- Delacher, M., Imbusch C.D., Weichenhan D., Breiling A., Hotz-Wagenblatt A., Träger U., Hofer A.-C., Kägebein D., Wang Q., Frauhammer F., et al. 2017. Genome-wide DNA-methylation landscape defines specialization of regulatory T cells in tissues. Nat. Immunol. 18:1160–1172. 10.1038/ni.3799 [DOI] [PMC free article] [PubMed] [Google Scholar]
- Delacher, M., Imbusch C.D., Hotz-Wagenblatt A., Mallm J.-P., Bauer K., Simon M., Riegel D., Rendeiro A.F., Bittner S., Sanderink L., et al. 2020. Precursors for nonlymphoid-tissue Treg cells reside in secondary lymphoid organs and are programmed by the transcription factor BATF. Immunity. 52:295–312.e11. 10.1016/j.immuni.2019.12.002 [DOI] [PMC free article] [PubMed] [Google Scholar]
- DiSpirito, J.R., Zemmour D., Ramanan D., Cho J., Zilionis R., Klein A.M., Benoist C., and Mathis D.. 2018. Molecular diversification of regulatory T cells in nonlymphoid tissues. Sci. Immunol. 3:eaat5861. 10.1126/sciimmunol.aat5861 [DOI] [PMC free article] [PubMed] [Google Scholar]
- Dominguez-Villar, M., and Hafler D.A.. 2018. Regulatory T cells in autoimmune disease. Nat. Immunol. 19:665–673. 10.1038/s41590-018-0120-4 [DOI] [PMC free article] [PubMed] [Google Scholar]
- Dong, C., Juedes A.E., Temann U.A., Shresta S., Allison J.P., Ruddle N.H., and Flavell R.A.. 2001. ICOS co-stimulatory receptor is essential for T-cell activation and function. Nature. 409:97–101. 10.1038/35051100 [DOI] [PubMed] [Google Scholar]
- Eller, K., Kirsch A., Wolf A.M., Sopper S., Tagwerker A., Stanzl U., Wolf D., Patsch W., Rosenkranz A.R., and Eller P.. 2011. Potential role of regulatory T cells in reversing obesity-linked insulin resistance and diabetic nephropathy. Diabetes. 60:2954–2962. 10.2337/db11-0358 [DOI] [PMC free article] [PubMed] [Google Scholar]
- Feito, M.J., Vaschetto R., Criado G., Sánchez A., Chiocchetti A., Jiménez-Periáñez A., Dianzani U., Portoles P., and Rojo J.M.. 2003. Mechanisms of H4/ICOS costimulation: effects on proximal TCR signals and MAP kinase pathways. Eur. J. Immunol. 33:204–214. 10.1002/immu.200390023 [DOI] [PubMed] [Google Scholar]
- Feuerer, M., Herrero L., Cipolletta D., Naaz A., Wong J., Nayer A., Lee J., Goldfine A.B., Benoist C., Shoelson S., and Mathis D.. 2009. Lean, but not obese, fat is enriched for a unique population of regulatory T cells that affect metabolic parameters. Nat. Med. 15:930–939. 10.1038/nm.2002 [DOI] [PMC free article] [PubMed] [Google Scholar]
- Fos, C., Salles A., Lang V., Carrette F., Audebert S., Pastor S., Ghiotto M., Olive D., Bismuth G., and Nunès J.A.. 2008. ICOS ligation recruits the p50alpha PI3K regulatory subunit to the immunological synapse. J. Immunol. 181:1969–1977. 10.4049/jimmunol.181.3.1969 [DOI] [PubMed] [Google Scholar]
- Francis, J.N., Lloyd C.M., Sabroe I., Durham S.R., and Till S.J.. 2007. T lymphocytes expressing CCR3 are increased in allergic rhinitis compared with non-allergic controls and following allergen immunotherapy. Allergy. 62:59–65. 10.1111/j.1398-9995.2006.01253.x [DOI] [PMC free article] [PubMed] [Google Scholar]
- Gigoux, M., Shang J., Pak Y., Xu M., Choe J., Mak T.W., and Suh W.-K.K.. 2009. Inducible costimulator promotes helper T-cell differentiation through phosphoinositide 3-kinase. Proc. Natl. Acad. Sci. USA. 106:20371–20376. 10.1073/pnas.0911573106 [DOI] [PMC free article] [PubMed] [Google Scholar]
- Guo, L., Wei G., Zhu J., Liao W., Leonard W.J., Zhao K., and Paul W.. 2009. IL-1 family members and STAT activators induce cytokine production by Th2, Th17, and Th1 cells. Proc. Natl. Acad. Sci. USA. 106:13463–13468. 10.1073/pnas.0906988106 [DOI] [PMC free article] [PubMed] [Google Scholar]
- Han, J.M., Wu D., Denroche H.C., Yao Y., Verchere C.B., and Levings M.K.. 2015. IL-33 reverses an obesity-induced deficit in visceral adipose tissue ST2+ T regulatory cells and ameliorates adipose tissue inflammation and insulin resistance. J. Immunol. 194:4777–4783. 10.4049/jimmunol.1500020 [DOI] [PubMed] [Google Scholar]
- Herman, A.E., Freeman G.J., Mathis D., and Benoist C.. 2004. CD4+CD25+ T regulatory cells dependent on ICOS promote regulation of effector cells in the prediabetic lesion. J. Exp. Med. 199:1479–1489. 10.1084/jem.20040179 [DOI] [PMC free article] [PubMed] [Google Scholar]
- Humbles, A.A., Lu B., Friend D.S., Okinaga S., Lora J., Al-Garawi A., Martin T.R., Gerard N.P., and Gerard C.. 2002. The murine CCR3 receptor regulates both the role of eosinophils and mast cells in allergen-induced airway inflammation and hyperresponsiveness. Proc. Natl. Acad. Sci. USA. 99:1479–1484. 10.1073/pnas.261462598 [DOI] [PMC free article] [PubMed] [Google Scholar]
- Hutloff, A., Dittrich A.M., Beier K.C., Eljaschewitsch B., Kraft R., Anagnostopoulos I., and Kroczek R.A.. 1999. ICOS is an inducible T-cell co-stimulator structurally and functionally related to CD28. Nature. 397:263–266. 10.1038/16717 [DOI] [PubMed] [Google Scholar]
- Ilan, Y., Maron R., Tukpah A.-M., Maioli T.U., Murugaiyan G., Yang K., Wu H.Y., and Weiner H.L.. 2010. Induction of regulatory T cells decreases adipose inflammation and alleviates insulin resistance in ob/ob mice. Proc. Natl. Acad. Sci. USA. 107:9765–9770. 10.1073/pnas.0908771107 [DOI] [PMC free article] [PubMed] [Google Scholar]
- Kalekar, L.A., Cohen J.N., Prevel N., Sandoval P.M., Mathur A.N., Moreau J.M., Lowe M.M., Nosbaum A., Wolters P.J., Haemel A., et al. 2019. Regulatory T cells in skin are uniquely poised to suppress profibrotic immune responses. Sci. Immunol. 4:eaaw2910. 10.1126/sciimmunol.aaw2910 [DOI] [PMC free article] [PubMed] [Google Scholar]
- Kerdiles, Y.M., Beisner D.R., Tinoco R., Dejean A.S., Castrillon D.H., DePinho R.A., and Hedrick S.M.. 2009. Foxo1 links homing and survival of naive T cells by regulating L-selectin, CCR7 and interleukin 7 receptor. Nat. Immunol. 10:176–184. 10.1038/ni.1689 [DOI] [PMC free article] [PubMed] [Google Scholar]
- Kohyama, M., Sugahara D., Sugiyama S., Yagita H., Okumura K., and Hozumi N.. 2004. Inducible costimulator-dependent IL-10 production by regulatory T cells specific for self-antigen. Proc. Natl. Acad. Sci. USA. 101:4192–4197. 10.1073/pnas.0400214101 [DOI] [PMC free article] [PubMed] [Google Scholar]
- Kolodin, D., van Panhuys N., Li C., Magnuson A.M., Cipolletta D., Miller C.M., Wagers A., Germain R.N., Benoist C., and Mathis D.. 2015. Antigen- and cytokine-driven accumulation of regulatory T cells in visceral adipose tissue of lean mice. Cell Metab. 21:543–557. 10.1016/j.cmet.2015.03.005 [DOI] [PMC free article] [PubMed] [Google Scholar]
- Komatsu, N., and Hori S.. 2007. Full restoration of peripheral Foxp3+ regulatory T cell pool by radioresistant host cells in scurfy bone marrow chimeras. Proc. Natl. Acad. Sci. USA. 104:8959–8964. 10.1073/pnas.0702004104 [DOI] [PMC free article] [PubMed] [Google Scholar]
- Kong, S.-K.K., Kim B.S., Uhm T.G., Lee W., Lee G.R., Park C.-S.S., Lee C.-H.H., and Chung I.Y.. 2013. Different GATA factors dictate CCR3 transcription in allergic inflammatory cells in a cell type-specific manner. J. Immunol. 190:5747–5756. 10.4049/jimmunol.1203542 [DOI] [PubMed] [Google Scholar]
- Kornete, M., Sgouroudis E., and Piccirillo C.A.. 2012. ICOS-dependent homeostasis and function of Foxp3+ regulatory T cells in islets of nonobese diabetic mice. J. Immunol. 188:1064–1074. 10.4049/jimmunol.1101303 [DOI] [PubMed] [Google Scholar]
- Landuyt, A.E., Klocke B.J., Colvin T.B., Schoeb T.R., and Maynard C.L.. 2019. Cutting Edge: ICOS-deficient regulatory T cells display normal induction of Il10 but readily downregulate expression of Foxp3. J. Immunol. 202:1039–1044. 10.4049/jimmunol.1801266 [DOI] [PMC free article] [PubMed] [Google Scholar]
- Lee, J.H., Kang S.G., and Kim C.H.. 2007. FoxP3+ T cells undergo conventional first switch to lymphoid tissue homing receptors in thymus but accelerated second switch to nonlymphoid tissue homing receptors in secondary lymphoid tissues. J. Immunol. 178:301–311. 10.4049/jimmunol.178.1.301 [DOI] [PubMed] [Google Scholar]
- Levine, A.G., Arvey A., Jin W., and Rudensky A.Y.. 2014. Continuous requirement for the TCR in regulatory T cell function. Nat. Immunol. 15:1070–1078. 10.1038/ni.3004 [DOI] [PMC free article] [PubMed] [Google Scholar]
- Li, C., DiSpirito J.R., Zemmour D., Spallanzani R.G., Kuswanto W., Benoist C., and Mathis D.. 2018. TCR transgenic mice reveal stepwise, multi-site acquisition of the distinctive fat-Treg phenotype. Cell. 174:285–299.e12. 10.1016/j.cell.2018.05.004 [DOI] [PMC free article] [PubMed] [Google Scholar]
- Luo, C.T., Liao W., Dadi S., Toure A., and Li M.O.. 2016. Graded Foxo1 activity in Treg cells differentiates tumour immunity from spontaneous autoimmunity. Nature. 529:532–536. 10.1038/nature16486 [DOI] [PMC free article] [PubMed] [Google Scholar]
- Ma, W., Bryce P.J., Humbles A.A., Laouini D., Yalcindag A., Alenius H., Friend D.S., Oettgen H.C., Gerard C., and Geha R.S.. 2002. CCR3 is essential for skin eosinophilia and airway hyperresponsiveness in a murine model of allergic skin inflammation. J. Clin. Invest. 109:621–628. 10.1172/JCI0214097 [DOI] [PMC free article] [PubMed] [Google Scholar]
- Matta, B.M., Lott J.M., Mathews L.R., Liu Q., Rosborough B.R., Blazar B.R., and Turnquist H.R.. 2014. IL-33 is an unconventional Alarmin that stimulates IL-2 secretion by dendritic cells to selectively expand IL-33R/ST2+ regulatory T cells. J. Immunol. 193:4010–4020. 10.4049/jimmunol.1400481 [DOI] [PMC free article] [PubMed] [Google Scholar]
- Miyamoto, K., Kingsley C.I., Zhang X., Jabs C., Izikson L., Sobel R.A., Weiner H.L., Kuchroo V.K., and Sharpe A.H.. 2005. The ICOS molecule plays a crucial role in the development of mucosal tolerance. J. Immunol. 175:7341–7347. 10.4049/jimmunol.175.11.7341 [DOI] [PubMed] [Google Scholar]
- Molofsky, A.B., Nussbaum J.C., Liang H.-E., Van Dyken S.J., Cheng L.E., Mohapatra A., Chawla A., and Locksley R.M.. 2013. Innate lymphoid type 2 cells sustain visceral adipose tissue eosinophils and alternatively activated macrophages. J. Exp. Med. 210:535–549. 10.1084/jem.20121964 [DOI] [PMC free article] [PubMed] [Google Scholar]
- Molofsky, A.B., Van Gool F., Liang H.-E.E., Van Dyken S.J., Nussbaum J.C., Lee J., Bluestone J.A., and Locksley R.M.. 2015. Interleukin-33 and Interferon-γ counter-regulate group 2 innate lymphoid cell activation during immune perturbation. Immunity. 43:161–174. 10.1016/j.immuni.2015.05.019 [DOI] [PMC free article] [PubMed] [Google Scholar]
- Nagakubo, D., Yoshie O., and Hirata T.. 2016. Upregulated CCL28 expression in the nasal mucosa in experimental allergic rhinitis: Implication for CD4(+) memory T cell recruitment. Cell. Immunol. 302:58–62. 10.1016/j.cellimm.2016.02.001 [DOI] [PubMed] [Google Scholar]
- Nishioka, T., Shimizu J., Iida R., Yamazaki S., and Sakaguchi S.. 2006. CD4+CD25+Foxp3+ T cells and CD4+CD25-Foxp3+ T cells in aged mice. J. Immunol. 176:6586–6593. 10.4049/jimmunol.176.11.6586 [DOI] [PubMed] [Google Scholar]
- Noval Rivas, M., and Chatila T.A.. 2016. Regulatory T cells in allergic diseases. J. Allergy Clin. Immunol. 138:639–652. 10.1016/j.jaci.2016.06.003 [DOI] [PMC free article] [PubMed] [Google Scholar]
- O’Brien, C.A., Batista S.J., Still K.M., and Harris T.H.. 2019. IL-10 and ICOS differentially regulate T cell responses in the brain during chronic Toxoplasma gondii infection. J. Immunol. 202:1755–1766. 10.4049/jimmunol.1801229 [DOI] [PMC free article] [PubMed] [Google Scholar]
- Okamoto, N., Tezuka K., Kato M., Abe R., and Tsuji T.. 2003. PI3-kinase and MAP-kinase signaling cascades in AILIM/ICOS- and CD28-costimulated T-cells have distinct functions between cell proliferation and IL-10 production. Biochem. Biophys. Res. Commun. 310:691–702. 10.1016/j.bbrc.2003.09.065 [DOI] [PubMed] [Google Scholar]
- Ono, M., Yaguchi H., Ohkura N., Kitabayashi I., Nagamura Y., Nomura T., Miyachi Y., Tsukada T., and Sakaguchi S.. 2007. Foxp3 controls regulatory T-cell function by interacting with AML1/Runx1. Nature. 446:685–689. 10.1038/nature05673 [DOI] [PubMed] [Google Scholar]
- Panneton, V., Chang J., Witalis M., Li J., and Suh W.-K.. 2019. Inducible T-cell co-stimulator: Signaling mechanisms in T follicular helper cells and beyond. Immunol. Rev. 291:91–103. 10.1111/imr.12771 [DOI] [PubMed] [Google Scholar]
- Pettersson, U.S., Waldén T.B., Carlsson P.-O., Jansson L., and Phillipson M.. 2012. Female mice are protected against high-fat diet induced metabolic syndrome and increase the regulatory T cell population in adipose tissue. PLoS One. 7:e46057. 10.1371/journal.pone.0046057 [DOI] [PMC free article] [PubMed] [Google Scholar]
- Rajbhandari, P., Thomas B.J., Feng A.-C., Hong C., Wang J., Vergnes L., Sallam T., Wang B., Sandhu J., Seldin M.M., et al. 2018. IL-10 signaling remodels adipose chromatin architecture to limit thermogenesis and energy expenditure. Cell. 172:218–233.e17. 10.1016/j.cell.2017.11.019 [DOI] [PMC free article] [PubMed] [Google Scholar]
- Redpath, S.A., van der Werf N., Cervera A.M., MacDonald A.S., Gray D., Maizels R.M., and Taylor M.D.. 2013. ICOS controls Foxp3(+) regulatory T-cell expansion, maintenance and IL-10 production during helminth infection. Eur. J. Immunol. 43:705–715. 10.1002/eji.201242794 [DOI] [PMC free article] [PubMed] [Google Scholar]
- Sather, B.D., Treuting P., Perdue N., Miazgowicz M., Fontenot J.D., Rudensky A.Y., and Campbell D.J.. 2007. Altering the distribution of Foxp3(+) regulatory T cells results in tissue-specific inflammatory disease. J. Exp. Med. 204:1335–1347. 10.1084/jem.20070081 [DOI] [PMC free article] [PubMed] [Google Scholar]
- Schmitz, J., Owyang A., Oldham E., Song Y., Murphy E., McClanahan T.K., Zurawski G., Moshrefi M., Qin J., Li X., et al. 2005. IL-33, an interleukin-1-like cytokine that signals via the IL-1 receptor-related protein ST2 and induces T helper type 2-associated cytokines. Immunity. 23:479–490. 10.1016/j.immuni.2005.09.015 [DOI] [PubMed] [Google Scholar]
- Setoguchi, R., Hori S., Takahashi T., and Sakaguchi S.. 2005. Homeostatic maintenance of natural Foxp3(+) CD25(+) CD4(+) regulatory T cells by interleukin (IL)-2 and induction of autoimmune disease by IL-2 neutralization. J. Exp. Med. 201:723–735. 10.1084/jem.20041982 [DOI] [PMC free article] [PubMed] [Google Scholar]
- Smigiel, K.S., Srivastava S., Stolley J.M., and Campbell D.J.. 2014a. Regulatory T-cell homeostasis: steady-state maintenance and modulation during inflammation. Immunol. Rev. 259:40–59. 10.1111/imr.12170 [DOI] [PMC free article] [PubMed] [Google Scholar]
- Smigiel, K.S., Richards E., Srivastava S., Thomas K.R., Dudda J.C., Klonowski K.D., and Campbell D.J.. 2014b. CCR7 provides localized access to IL-2 and defines homeostatically distinct regulatory T cell subsets. J. Exp. Med. 211:121–136. 10.1084/jem.20131142 [DOI] [PMC free article] [PubMed] [Google Scholar]
- So, L., and Fruman D.A.. 2012. PI3K signalling in B- and T-lymphocytes: new developments and therapeutic advances. Biochem. J. 442:465–481. 10.1042/BJ20112092 [DOI] [PMC free article] [PubMed] [Google Scholar]
- Stolley, J.M., and Campbell D.J.. 2016. A 33D1+ dendritic cell/autoreactive CD4+ T cell circuit maintains IL-2-dependent regulatory T cells in the spleen. J. Immunol. 197:2635–2645. 10.4049/jimmunol.1600974 [DOI] [PMC free article] [PubMed] [Google Scholar]
- Tang, Q., Henriksen K.J., Boden E.K., Tooley A.J., Ye J., Subudhi S.K., Zheng X.X., Strom T.B., and Bluestone J.A.. 2003. Cutting edge: CD28 controls peripheral homeostasis of CD4+CD25+ regulatory T cells. J. Immunol. 171:3348–3352. 10.4049/jimmunol.171.7.3348 [DOI] [PubMed] [Google Scholar]
- Vasanthakumar, A., Moro K., Xin A., Liao Y., Gloury R., Kawamoto S., Fagarasan S., Mielke L.A., Afshar-Sterle S., Masters S.L., et al. 2015. The transcriptional regulators IRF4, BATF and IL-33 orchestrate development and maintenance of adipose tissue-resident regulatory T cells. Nat. Immunol. 16:276–285. 10.1038/ni.3085 [DOI] [PubMed] [Google Scholar]
- Vasanthakumar, A., Chisanga D., Blume J., Gloury R., Britt K., Henstridge D.C., Zhan Y., Torres S.V., Liene S., Collins N., et al. 2020. Sex-specific adipose tissue imprinting of regulatory T cells. Nature. 579:581–585. 10.1038/s41586-020-2040-3 [DOI] [PMC free article] [PubMed] [Google Scholar]
- Wan, Y.Y., and Flavell R.A.. 2005. Identifying Foxp3-expressing suppressor T cells with a bicistronic reporter. Proc. Natl. Acad. Sci. USA. 102:5126–5131. 10.1073/pnas.0501701102 [DOI] [PMC free article] [PubMed] [Google Scholar]
- Wan, Z., Shao X., Ji X., Dong L., Wei J., Xiong Z., Liu W., and Qi H.. 2020. Transmembrane domain-mediated Lck association underlies bystander and costimulatory ICOS signaling. Cell. Mol. Immunol. 17:143–152. 10.1038/s41423-018-0183-z [DOI] [PMC free article] [PubMed] [Google Scholar]
- Wu, Y., Borde M., Heissmeyer V., Feuerer M., Lapan A.D., Stroud J.C., Bates D.L., Guo L., Han A., Ziegler S.F., et al. 2006. FOXP3 controls regulatory T cell function through cooperation with NFAT. Cell. 126:375–387. 10.1016/j.cell.2006.05.042 [DOI] [PubMed] [Google Scholar]
- Wu, D., Ren Z., Pae M., Guo W., Cui X., Merrill A.H., and Meydani S.N.. 2007. Aging up-regulates expression of inflammatory mediators in mouse adipose tissue. J. Immunol. 179:4829–4839. 10.4049/jimmunol.179.7.4829 [DOI] [PubMed] [Google Scholar]
- Wu, D., Molofsky A.B., Liang H.-E.E., Ricardo-Gonzalez R.R., Jouihan H.A., Bando J.K., Chawla A., and Locksley R.M.. 2011. Eosinophils sustain adipose alternatively activated macrophages associated with glucose homeostasis. Science. 332:243–247. 10.1126/science.1201475 [DOI] [PMC free article] [PubMed] [Google Scholar]
- Wu, D., Wong C.K., Han J.M., Orban P.C., Huang Q., Gillies J., Mojibian M., Gibson W.T., and Levings M.K.. 2020. T reg-specific insulin receptor deletion prevents diet-induced and age-associated metabolic syndrome. J. Exp. Med. 217:e20191542. 10.1084/jem.20191542 [DOI] [PMC free article] [PubMed] [Google Scholar]
- Yamaguchi, T., Wing J.B., and Sakaguchi S.. 2011. Two modes of immune suppression by Foxp3(+) regulatory T cells under inflammatory or non-inflammatory conditions. Semin. Immunol. 23:424–430. 10.1016/j.smim.2011.10.002 [DOI] [PubMed] [Google Scholar]


