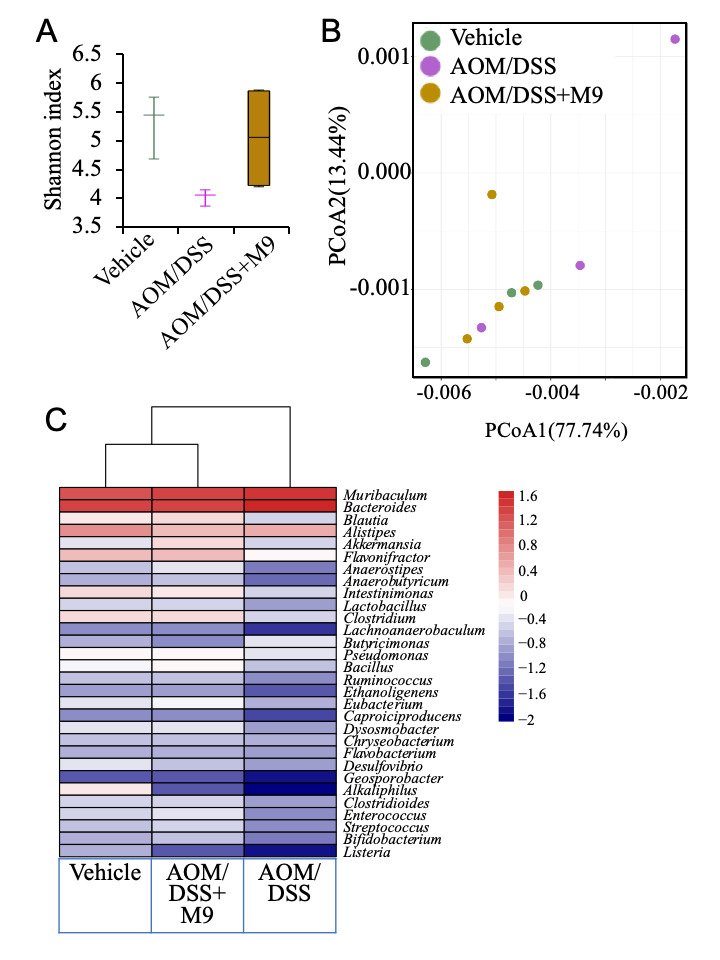
Figure 5.

The difference in the fecal microbiota at week 17. (A) The difference in the Shannon index of three groups at week 17. (B) Principal coordinates analysis (PCoA) of the gut microbiota at week 17. (C) Distribution of differential abundant genus at week 17; the mean relative abundance is represented in log scale, all genera in the AOM/DSS group were different from those in the other two groups (all p < 0.05 by Mann–Whitney test, and n = 3 in vehicle and AOM/DSS groups and n = 4 for in AOM/DSS+M9 group).
