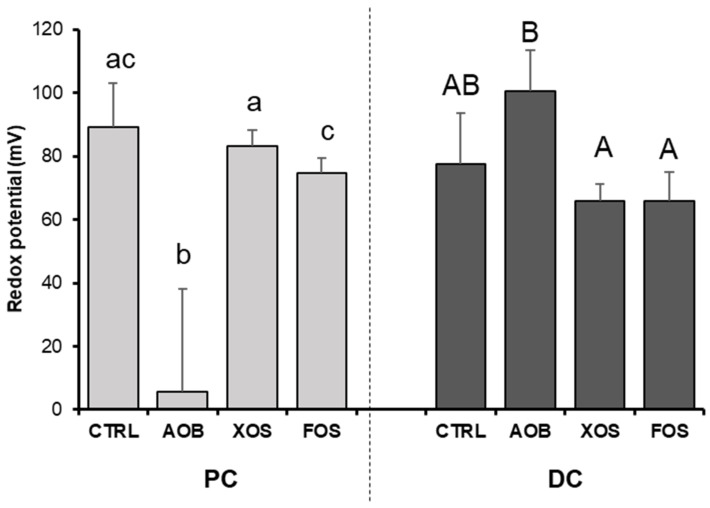
Figure 8.
Changes in redox potential for donor 2 and 4, upon treatment with AOB, XOS and FOS versus a blank control for PC and DC. Data are averages of two technical replicates for both donor 2 and 4 with standard deviation STDEV (n = 4). CTRL = control; AOB = antioxidant blend; XOS = xylooligosaccharides; FOS = fructooligosaccharides; PC = proximal colon; DC = distal colon. Significant differences (p < 0.05) are indicated with small letters (a, b, c) for the proximal colon and capital letters (A, B) for the distal colon. Bars with different letters are significantly different.

