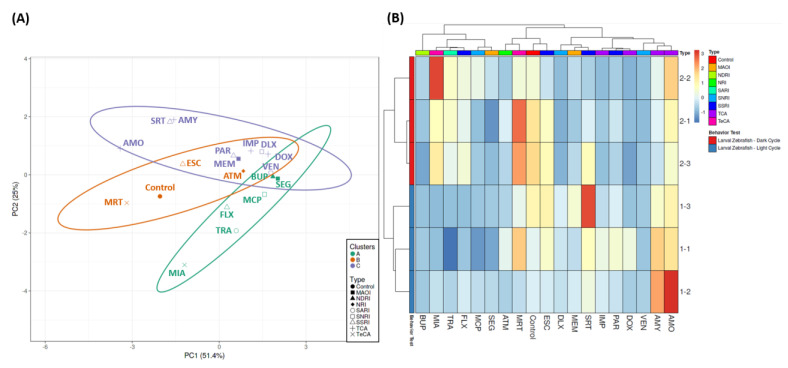
Figure 3.
(A) Principal component analysis (PCA) and (B) hierarchical clustering analysis of locomotion behavior endpoints in zebrafish larvae after exposure to 1 mg/L of 18 different antidepressants. The untreated group is included as the control group. In (A), three major clusters from hierarchical clustering analysis results are marked with purple (1st cluster), orange (2nd cluster), and green (3rd cluster).

