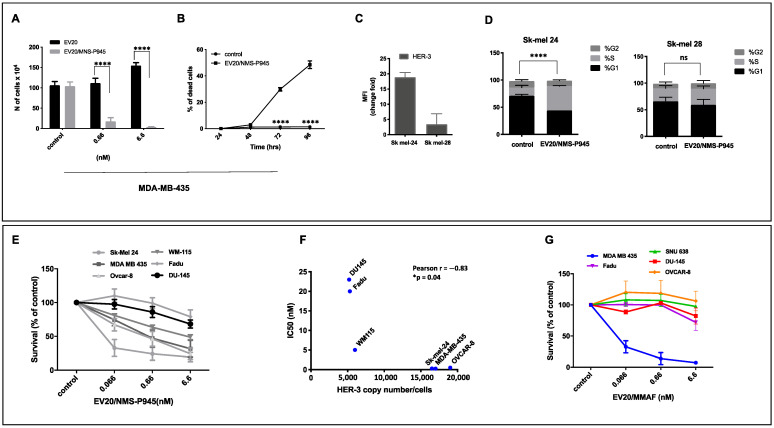
Figure 3.
EV20/NMS-P945 possesses potent and target-dependent cell killing activity in vitro. (A) MDA-MB-435 melanoma cells were treated with the indicated doses of EV20 or EV20/NMS-P945 in complete medium. After five days, cells were harvested and several fields in the hemocytometer were counted. Mean +/− SD (n = 3). Significance was calculated by two-way ANOVA, followed by Bonferroni’s post hoc test (**** p < 0.0001). (B) Trypan blue staining of melanoma MDA-MB-435 cells treated for the indicated times with 0.6 nM of EV20/NMS-P945. Percentage of dead cells is presented. Mean +/− SD (n = 3). Significance was calculated by two-way ANOVA, followed by Bonferroni’s post hoc test. (**** p < 0.0001). (C) Sk-mel 24 and Sk-mel 28 cells were analyzed by flow cytometry for surface expression of HER-3 (left). Fold change of mean fluorescence intensity (MFI) is presented. (D) Cells were treated for 48 h with 0.6 nM of EV20/NMS-P945 and cell cycle was analyzed using propidium iodide DNA staining (right). Two-way ANOVA, followed by Sidak’s multiple comparison test was performed using GraphPad Prism 8.0 software (**** p < 0.00001 for G1% and S% differences). (E) Cell killing was evaluated with MTT assay on a panel of HER-3+ cancer cell lines treated with increasing doses of EV20/NMS-P945 for 120 h. Percentage of survival over control is represented. Mean +/− SD (n = 3). IC50 (Inhibit Cellular Proliferation by 50%) values were calculated using GraphPad Prism 5.0 software. p-values were calculated by two-way ANOVA analysis, followed by Bonferroni’s post hoc test and are reported in Table 1. (F) HER-3 expression in terms of receptor copy number and EV20/NMS-P945 IC50 correlation. Pearson coefficient was calculated using GraphPad Prism 8.0 software (Pearson r: −0.83; * p = 0.04). (G) Cell killing was evaluated with MTT assay on a panel of HER-3+ cancer cell lines treated with increasing doses of EV20/MMAF for 120 h. Percentage of survival over control is represented. Mean ± SD (n = 3). p-values were calculated by two-way ANOVA, followed by Bonferroni’s post hoc test and are reported in Table 1 (Supplementary Materials).

