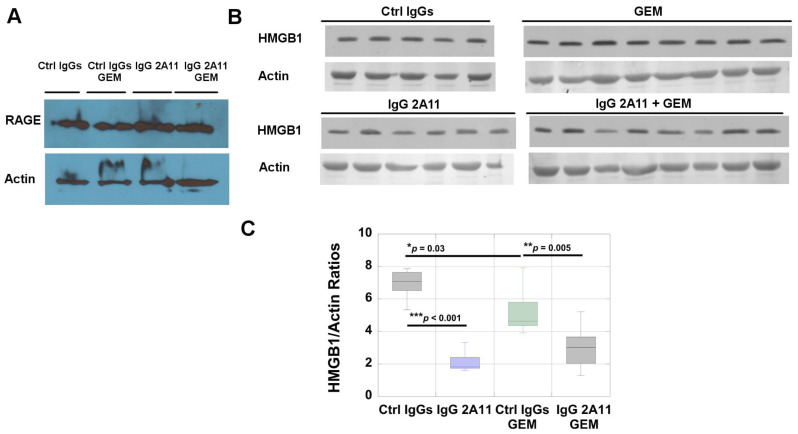
Figure 7.
(A) RAGE expression in representative tumor extracts from each treatment group. (B) HMGB1 expression in tumor extracts. (C) Densitometric analysis of the blot shows a significant decrease in HMGB1 levels upon RAGE inhibition in gemcitabine-treated tumors. * p < 0.05; ** p < 0.01; *** p < 0.001.

