Abstract
Barleria lupulina Lindl. (Acanthaceae) as an ornamental plant has been widely used in folklore medicine due to its abundancy in polyphenolic compounds. The present study examined conditions for optimal extraction of antioxidants from B. lupulina leaf extracts by using the microwave-assisted extraction (MAE) method. The effects of ethanol concentrations, microwave power, and extraction time on total phenolic content (TPC), total flavonoid content (TFC), 1-diphenyl-2-picrylhydrazyl (DPPH), and 2,20-azino-bis (3-ethylbenzothizoline-6-sulfonic acid) (ABTS) were investigated by single-factor experiments. Response surface methodology (RSM) was applied to observe interactions of three independent variables (ethanol concentrations, microwave power, and extraction time) on the dependent variables (TPC, TFC, DPPH, and ABTS) to establish optimal extraction conditions. Quadratic polynomial equations in all experimental models yielded favorably with fitted models with R2 and R2adj of more than 0.90 and a non-significant lack of fit at p > 0.05. The optimal conditions for the extraction of antioxidant activity were established at 80% (v/v) ethanol, 400 W, and 30 s with TPC (238.71 mg gallic acid equivalent (GAE)/g sample), TFC (58.09 mg QE/g sample), DPPH (87.95%), and ABTS (89.56%). Analysis by ultra-high-performance liquid chromatography–quadrupole time-of-flight mass spectrometry (UHPLC-QTOF/MS) successfully identified four new phenylethanoid glycoside compounds in the species.
Keywords: Barleria lupulina Lindl.; microwave-assisted extraction (MAE); response surface methodology (RSM); total flavonoid content (TFC); total phenolic content (TPC); 1-diphenyl-2-picrylhydrazyl (DPPH); 2,20-azino-bis (3-ethylbenzothizoline-6-sulfonic acid) (ABTS)
1. Introduction
Polyphenols are a group of phytochemicals produced by plants as secondary metabolites. These compounds are known to give health benefits to humans, including anti-aging, anti-tumor, anti-carcinogenic, and anti-glaucoma properties [1]. They are known to be the most prevalent antioxidants in plants and allegedly possess both the capacity to quench oxygen radicals and inhibit the development of free radicals [2]. Flavonoids are a family of polyphenols with subclasses, including flavones, flavanols, isoflavones, flavanones, and chalcones. They are known to be highly effective antioxidants and possess anti-inflammatory, antimicrobial, antiviral, anti-mutagenic, and anti-carcinogenic properties [3,4,5]. Flavonoids are known to be essential components in a number of nutraceutical, pharmaceutical, medicinal, and cosmetic products [3]. The increasing awareness of the health benefits associated with the use of polyphenols has led to the expanding demand in the food, beverage, pharmaceutical, and cosmetics industries [6].
Barleria lupulina Lindl. is a pantropical herb and is widely cultivated as an ornamental shrub. The species belongs to the Acanthaceae family that comprises 300 species [7]. It is commonly known as the hophead philippine violet and by various local names, such as Penawar seribu bisa (Malaysia) [8], Landik (Indonesia) [9], Sa-let-pangpon, Chong-ra-ar (Thailand) [10], Kanta vishalyakarni (India), and Neel saireyak (Sanskrit) [11]. Traditionally, B. lupulina was used to treat several diseases, including treating snake bites, dog bites, swelling, bleeding wounds, rheumatism, herpes simplex, and herpes zoster [10,11]. Studies have documented that B. lupulina has medicinal values, including anti-inflammation [12], antiviral [13,14], antibacterial [11,15,16], antidiabetic [17], cytotoxic [18,19], antidiuretic, and antiarthritic activity [20,21]. Several studies have also shown that the species possesses highly potential antioxidants and bioactive compounds used in treatments of various diseases and health issues [10,15,19,22,23].
One important consideration in the extraction of bioactive compounds from plant materials is the preparation of the extract and the extraction procedures [24]. Studies have shown that there is a strong relationship between type and polarity of extraction solvents, time, temperature, physical characteristics of samples, and amount of polyphenols extracted [25]. Heating is known to influence the content of some polyphenols by the rupturing of the cell membrane, causing the release of membrane-bound phytochemicals and the increase in bioavailability [26]. Several studies suggested that recent sample preparation and extraction procedures are superior in overcoming the disadvantages of traditional methods and, thus, are able to increase efficiency of extraction by using less consumption of solvents and time of extraction [27,28,29,30]. Microwave-assisted extraction (MAE) is among the more recent procedures, which involves the heating up of molecules by a dual mechanism of ionic conduction and dipole rotation. The procedure involves the disruption of cell walls and the release of compounds of interest to the extracting solvent [31]. The advantage of MAE is its shorter extraction time, as well as its stability and reproducibility [32,33].
Response surface methodology (RSM) is software used for analyzing and optimizing data based on mathematical and statistical models. It is widely used in experimental designs for the optimization of experiments [34]. RSM has the capability to scrutinize and summarize experimental parameters (dependent variables), responses (independent variables), and their interactions, hence saving time, cost, and the amount of materials used [35]. RSM has been widely used in several fields, such as industrial crops and products [36], food chemistry [29], and renewable energy [37,38]. Previous studies have shown that RSM was useful in establishing optimal conditions for the extraction of antioxidant compounds and their activities [39,40,41].
The MAE is an efficient method due to its ability to extract bioactive compounds from B. lupulina leaves in a shorter time period as compared to Soxhlet and ultrasound-assisted extraction (UAE) [42]. The present study investigated the effects of solvent concentrations, extraction time, and microwave power on extraction efficiency using MAE procedures conducted in single-factor experiments. RSM was utilized to establish the optimal conditions preceding the ultra-high performance liquid chromatography–quadrupole time-of-flight mass spectrometry (UHPLC-QTOF/MS) to determine the bioactive compounds.
2. Results and Discussion
2.1. Analyses of Single Factors
2.1.1. Effects of Ethanol Concentrations
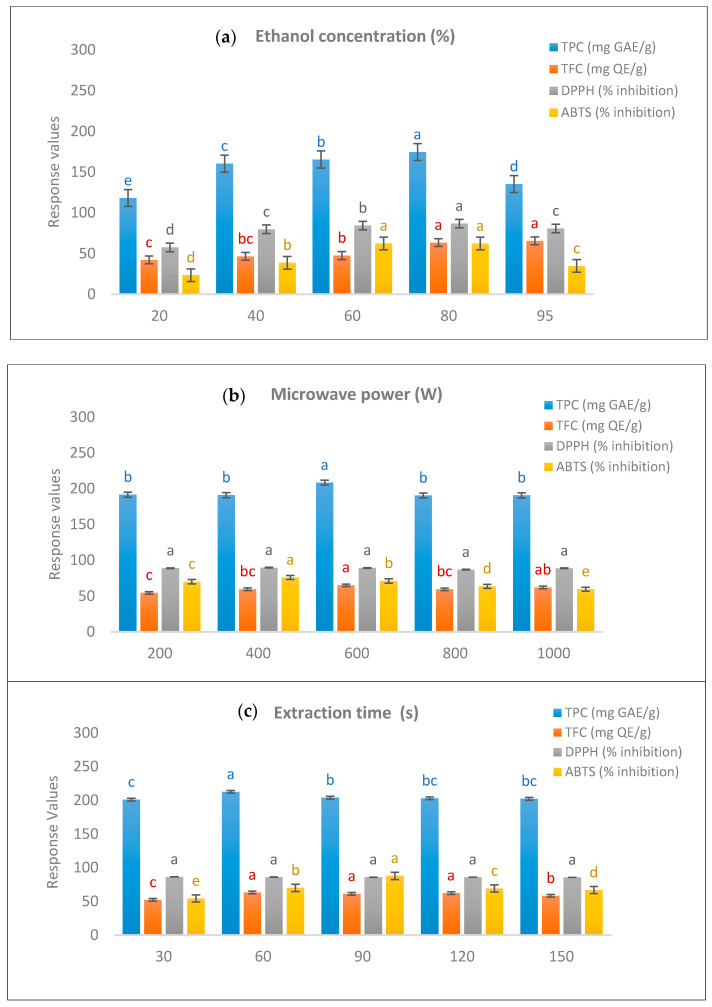
The choice of extraction solvent generally affected the amount and types of extracted compounds as cited by [43]. Ethanol has several advantages over other solvents, such as higher extraction ability, environmental compatibility, lower toxicity, and cost, and it is the most commonly used solvent in the extraction of phytochemicals from plant extracts [30,43]. Ethanol concentrations in water have been reported to have significant effects on plant extraction quality [44,45]. In the present study, B. lupulina Lindl. leaf extract (BLLE) was investigated at five levels of ethanol concentrations (20, 40, 60, 80, and 95%, v/v) while keeping other conditions (1000 W and 60 s) constant.
Figure 1a shows an increase in total phenolic content (TPC) when extracting at 20–80% (v/v) ethanol concentrations but a decrease at 95%. In contrast, increase in ethanol concentrations yielded increases in the yield of total flavonoid content (TFC). The 1-diphenyl-2-picrylhydrazyl (DPPH) and 2,20-azino-bis (3-ethylbenzothizoline-6-sulfonic acid) (ABTS) showed better scavenging activity at 60–80% (v/v) ethanol concentrations. Ethanol concentrations of between 20 and 80% (v/v) were selected for RSM, and an 80% concentration was used in the subsequent experiments.
Figure 1.
Effects of single factors: (a) ethanol concentrations, (b) microwave power, and (c) extraction time on total phenolic content (TPC), total flavonoid content (TFC), 1-diphenyl-2-picrylhydrazyl (DPPH), and 2,20-azino-bis (3-ethylbenzothizoline-6-sulfonic acid) (ABTS), respectively, of B. lupulina leaf extract. One-way ANOVA was used to compare the significant differences among groups. Different letters (a, b, c, d, and e) in blue, red, black, and yellow colors, respectively, represent significant differences (p < 0.05) in TPC, TFC, DPPH, and ABTS values among groups. The same letter indicates no significant difference (p > 0.05) among groups.
2.1.2. Effects of Microwave Power
Microwave power is an important factor in microwave-assisted extraction procedures. It is known that the efficiency of extraction of phytochemicals depends on the volumetric heating of plant cells. At the parameters of 80% (v/v) and 60 s, the influence of microwave power at 200, 400, 600, 800, and 1000 W was measured.
Figure 1b presents the parabolic effects of microwave power on TPC and TFC, both attaining peaks at 600 W. Increase in microwave power could increase extraction efficiency through maximizing molecular interactions between the electromagnetic field and the sample as reported by [46]. However, prolonged exposure to a higher microwave power could degrade some phenolic compounds [47]. In the present study, percentage inhibition of scavenging activity showed that 400 W was better for ABTS activity but had no significant difference in DPPH activity. The 600 W microwave power was considered proper for the present subsequent experiments.
2.1.3. Effects of Extraction Time
Extraction time in a plant extraction procedure is considered very important, as it could result in saving time and cost. Based on the previous experiments in the present study, extraction efficiency was measured at extraction times of 30–150 s at the optimized extraction conditions of 600 W and 80% (v/v).
Data in Figure 1c show that TPC yielded its highest level at a 60 s extraction time compared with other durations. There was no significant difference in TFC at extraction times of between 60 and 120 s. In scavenging activity, DPPH showed no significant difference between times of extraction, while the highest activity for ABTS scavenging was recorded at 90 s, which was higher than that of the others. A longer extraction time is known to degrade the antioxidants in the extract.
2.2. Analysis of Response Surface Methodology (RSM)
Fitting Model
Analysis of variance (ANOVA) was performed to determine the quadratic model of the experiments. The significance of the model was determined by a high F-value and a low p-value (<0.5) [48]. The reliability of the model was determined by a lack of fit value, where a p-value of more than 0.05 was not significant. The coefficient of determination (R2) of the model referred to the correlation between predicted and experimental data, where the lesser the difference between R2 and adjusted R2, the better the statistical model.
Table 1 presents responses for each model showing its significance where all p-values were less than 0.05. High significance was shown in DPPH (F-value = 350.98; p < 0.0001) and ABTS (F-value = 29.12; p < 0.0001), followed by TFC (F-value = 23.52; p < 0.0002) and TPC (F-value = 20.17; p < 0.0003). The lack of fit value for each response showed that the model was valid and fitted well with a value greater than 0.05 (not significant). TPC, TFC, DPPH, and ABTS gave values of 0.7414, 0.8221, 0.5152, and 0.49447, respectively, suggesting that all of the models had significant effects on parameters of output responses [49]. All responses showed R2 and adjusted R2 of less than 0.2, which were not significantly different. The results indicate that the statistical models were good.
Table 1.
Analysis of variance for the fitted model of experiment.
| TPC | TFC | DPPH | ABTS | ||
|---|---|---|---|---|---|
| Model | F-Value | 20.17 | 23.52 | 350.98 | 29.12 |
| p-Value | 0.0003 | 0.0002 | <0.0001 | <0.0001 | |
| Lack of fit | 0.7414 | 0.8221 | 0.5152 | 0.49447 | |
| R2 | 0.9629 | 0.9680 | 0.9978 | 0.9740 | |
| Adjusted R2 | 0.9151 | 0.9268 | 0.9949 | 0.9405 |
TPC: total phenolic content; TFC: total flavonoid content; DPPH: 1-diphenyl-2-picrylhydrazyl; ABTS: 2,20-azino-bis (3-ethylbenzothizoline-6-sulfonic acid).
2.3. Conditions for Optimal Extraction
2.3.1. Total Phenolic Content
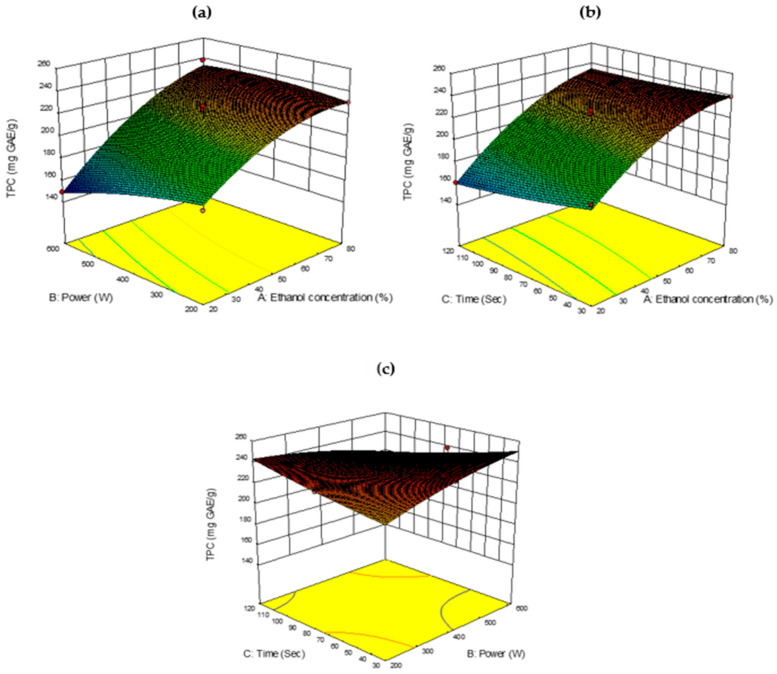
The total phenolic content (TPC) from B. lupulina Lindl. leaf extract using the MAE method ranged from 149 to 239.33 mg GAE/g with a mean of 209.06 mg GAE/g. The highest yield in TPC (239.33 mg GAE/g) was observed in experimental run no. 7 under extraction conditions of 80% (v/v) ethanol concentration, 400 W microwave power, and an extraction time of 30 s. The extraction procedures in the present study yielded higher extraction values when compared to previous maceration [18] and Soxhlet methods [50].
The ANOVA of regression coefficient showed a linear response based on the p-value of ethanol concentrations, which were highly significant (p < 0.0001), followed by microwave power and extraction time (Table 2). In the quadratic model, only ethanol concentrations (A2) were significant (p < 0.05). The interaction between variables, ethanol concentration × power (AB), and power × extraction time (BC) had a significant impact on TPC (p < 0.05).
Table 2.
Analysis of variance of experimental results.
| Parameter | TPC | TFC | DPPH | ABTS | |||||
|---|---|---|---|---|---|---|---|---|---|
| df | Estimated Coefficients |
Prob > F | Estimated Coefficients |
Prob > F | Estimated Coefficients |
Prob > F | Estimated Coefficients |
Prob > F | |
| Linear | |||||||||
| A | 1 | 32.90 | <0.0001 | 10.97 | <0.0001 | 4.95 | <0.0001 | 21.78 | <0.0001 |
| B | 1 | −8.23 | 0.0225 | −4.11 | 0.0040 | −0.11 | 0.4225 | −5.60 | 0.0112 |
| C | 1 | −6.79 | 0.0471 | −1.80 | 0.1088 | −0.72 | 0.0007 | −4.44 | 0.0302 |
| Quadratic | |||||||||
| A2 | 1 | −13.57 | 0.0102 | 7.95 | 0.0006 | −4.85 | <0.0001 | −12.75 | 0.0008 |
| B2 | 1 | −3.74 | 0.3689 | −2.95 | 0.0650 | −1.39 | <0.0001 | 4.69 | 0.0760 |
| C2 | 1 | 1.64 | 0.6867 | 1.09 | 0.4452 | 3.05 | <0.0001 | 2.92 | 0.2371 |
| Interaction | |||||||||
| AB | 1 | 9.54 | 0.0482 | 3.17 | 0.0556 | 3.82 | <0.0001 | −6.47 | 0.0267 |
| AC | 1 | 4.42 | 0.3053 | 5.91 | 0.0037 | 0.65 | 0.0081 | −9.74 | 0.0040 |
| BC | 1 | -13.33 | 0.0124 | −1.72 | 0.2535 | −0.42 | 0.0519 | −4.71 | 0.0812 |
df: degree of freedom; TPC: total phenolic content; TFC: total flavonoid content; DPPH: 1-diphenyl-2-picrylhydrazyl (antioxidant activity); ABTS: 2,20-azino-bis (3-ethylbenzothizoline-6-sulfonic acid) (anti-oxidant activity); A: ethanol concentration; B: microwave power; C: extraction time.
In the present experiment, as the ethanol concentration increased from 20 to 80% (v/v), the yield of TPC in the extract increased, as shown in Figure 2a. Ethanol concentration also showed significance in quadratic and interactions with microwave power, and non-significance (p > 0.05) in interaction time. The ability of the mixture in any proportion between water (strong polar solvent) to ethanol (low polar solvent) was cited to increase polarity of the complex solvent [51]. In the present study, 80% (v/v) ethanol was a good proportion to obtain a high TPC yield. With respect to microwave power, TPC reached its maximum at 400 W and slightly dropped with an increase in microwave power (Figure 2b). This could be due to the thermal degradation of phytochemicals at higher microwave power levels. The higher heat generated by higher microwave power with volumetric heating could be too strong for plant cells, causing the breakdown of phytochemicals [29].
Figure 2.
Response surface analysis (3D) of Barleria lupulina Lindl. leaf extract (BLLE) on total phenolic content (TPC): (a) effect of ethanol concentration and power; (b) effect of ethanol concentration and time; (c) effect of power and time.
In the present study, 400 W was considered a better option to obtain an optimal yield. Extraction time did not influence the yield of TPC (Figure 2c). In general, the quantity of analytes that can be extracted from a sample has been reported to improve by increasing the extraction time. However, there was a chance that extracted compounds could be degraded [29]. It was observed that 30 s of irradiation time in the present study was able to obtain a better yield of TPC, in agreement with findings by [52].
2.3.2. Total Flavonoid Content
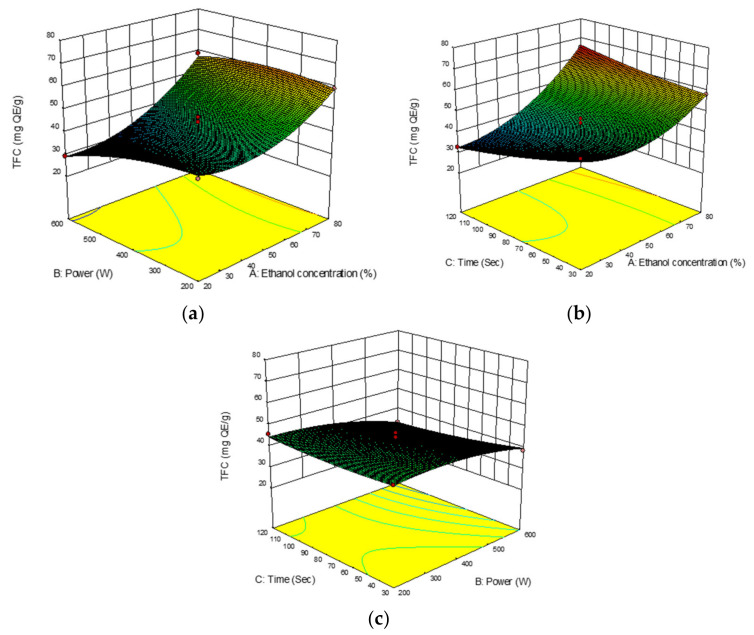
The total flavonoid content (TFC) from B. lupulina Lindl. leaf extract using MAE ranged from 29.1527 to 65.2672 mg QE/g with a mean value of 45.2357 mg QE/g. The highest TFC yield (65.2672 mg QE/g) was observed in experimental run no. 8 under extraction conditions of 80% (v/v) ethanol concentration, 400W microwave power, and an extraction time of 120 s. The ANOVA of the regression coefficient indicated that the two linear parameters, ethanol concentrations (A) and microwave power (B), were significant at p < 0.0001 and p < 0.05, respectively (Table 2). The quadratic (A2) and interaction effects between ethanol concentrations and extraction time (AC) were also significant (p < 0.05) on TFC yield.
Heat generated by microwave power generally caused interactions between the sample and solvent, which caused disruption of the sample to occur and the release of analyte in the solvent [53,54]. It was reported that an increase in the heat produced increase in the yield of the extract [55] and at a faster rate [53]. Heating could also cause an increase in solubility of flavonoids from the plant matrix by disrupting the phenolic matrix bonds [56]. Figure 3a shows the interactions between ethanol concentrations and microwave power on the yield of TFC. An increase in microwave power from 200 to 400 W in the present study caused an increase in TFC yield but caused a decrease beyond 400 W. This could be the degradation of thermolabile compounds due to the heat produced [54,57]. Figure 3b shows an increase in the value of TFC with an increase in ethanol concentrations and extraction time. The positive interaction of solvent concentration and time could enhance solubility of TFC at a minimum level of heating power, which suggests it as an alternative way to avoid the degradation of compounds. However, the interaction of time and microwave power showed a negative effect on TFC yield (Figure 3c). The increase in extraction time and microwave power caused a decrease in TFC yield. This could be related to the high dielectric properties of ethanol as a polar solvent, and combining it with water could cause an increase in the rate of heating that tends to degrade the compounds over a prolonged exposure to microwave power.
Figure 3.
Response surface analysis (3D) of Barleria lupulina Lindl. leaf extract (BLLE) on total flavonoid content (TFC): (a) effect of ethanol concentration and microwave power; (b) effect of ethanol concentrations and extraction time; (c) effect of microwave power and extraction time.
2.3.3. DPPH Activity
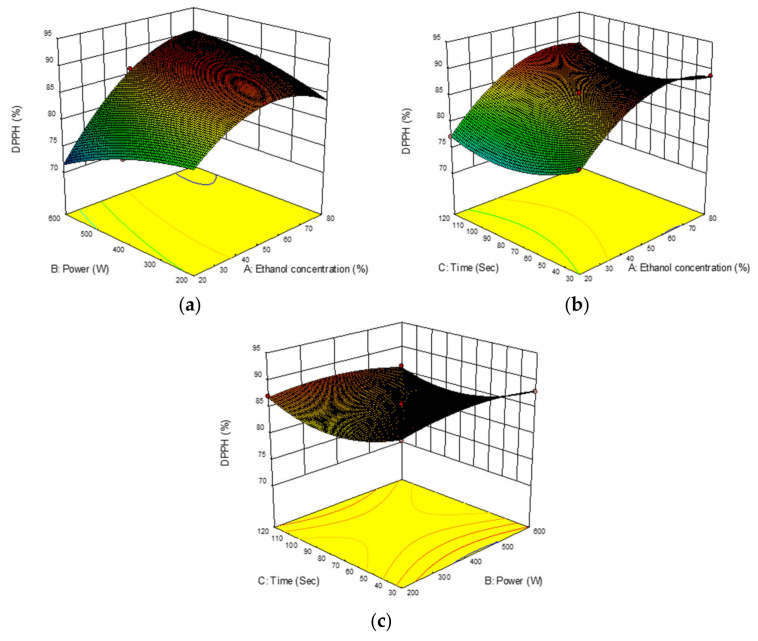
In the present study, antioxidant activity of B. lupulina Lindl. leaf extract towards DPPH radical assay ranged from 70.21 to 88.75% with a mean of 83.91%. The highest DPPH activity (88.75%) was recorded in experimental run no. 7 under extraction conditions of 80% (v/v) ethanol concentration, 400 W microwave power, and an extraction time of 30 s. The ANOVA revealed that only ethanol concentrations (A) had a positive significant linear effect (p < 0.0001) (Table 2). The increase in ethanol concentrations and microwave power caused a significant decrease in DPPH activity (negative quadratic effect, A2 and B2) in contrast with extraction times (C2), which caused significant increases in DPPH activity (p < 0.0001). Positive significant interaction effects (p < 0.0001) were recorded between ethanol concentrations with microwave power (AB) and ethanol concentrations with extraction times (p < 0.05) (AC). Antioxidant capacity of DPPH was observed to increase when ethanol concentrations were increased at a minimum microwave power between 200 and 400 W (Figure 4a) with an increase in extraction times (Figure 4b). Meanwhile, negative interaction effects between extraction times and microwave power (BC) showed an increase in antioxidant capacity of DPPH with prolonged extraction times but at a minimum microwave power of between 300 and 400 W (Figure 4c).
Figure 4.
Response surface analysis (3D) of Barleria lupulina Lindl. leaf extract (BLLE) on DPPH activity: (a) effect of ethanol concentrations and microwave power; (b) effect of ethanol concentrations and extraction time; (c) effect of microwave power and extraction time.
The DPPH radical scavenging assay has been widely used because of its stabilization of free radicals—a simple, rapid, and convenient method for estimating antiradical activity. The assay measures the ability of a substance, or a complex mixture of substances (antioxidants), to scavenge free radicals through donation hydrogen atoms or electrons. The reaction of a hydrogen-donating antioxidant can be seen by the changes of the purple alcoholic DPPH solution to green and yellow. The DPPH assay has been quoted to be more favorable to react with low molecular weight phenolic compounds [58]. Based on observations made in the DPPH assay, TPC yielded more than 180 mg GAE/g and showed more than 80% DPPH activity. The effects of ethanol concentrations of between 20 and 80% (v/v) in the DPPH assay in the present study mirrored previous studies on Orthosiphon stamineus extracts, which were related to the highly active and moderately polar phenolic compounds [45]. DPPH activity initially yielded high activity but decreased upon reaching a minimum extraction time of between 70 and 80 s, before improving activity. The results were in agreement with the findings of other studies in which DPPH scavenging capacity increases with an increase in extraction time [36,59].
2.3.4. ABTS Activity
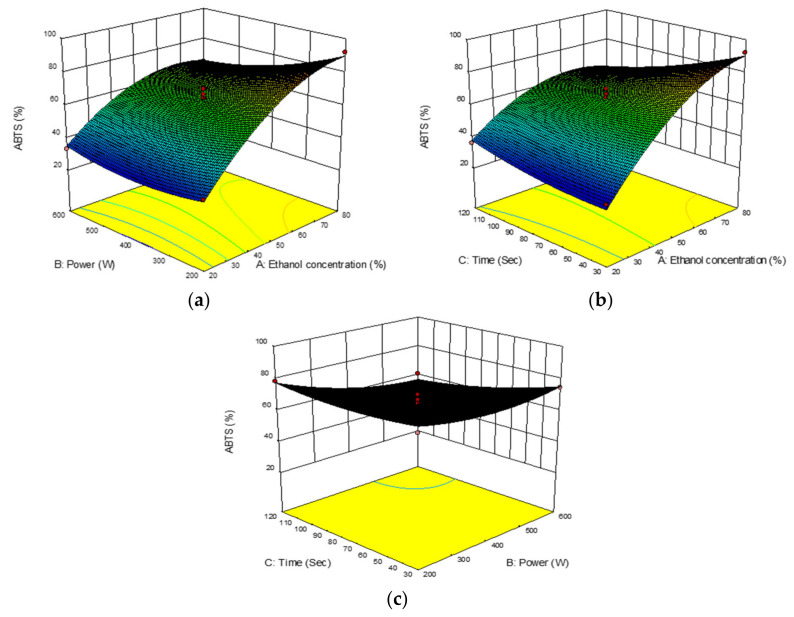
ABTS activity on B. lupulina Lindl. leaf extract ranged from 30.08 to 92.08% with a mean of 61.75%. The highest ABTS yield (92.082%) was observed in experimental run no. 7 under extraction conditions of 80% (v/v) ethanol concentration, 400 W microwave power, and an extraction time of 30 s. The ANOVA showed that only ethanol had positive significant linear effects (p < 0.0001) (Table 2) when compared to microwave power (B) and extraction time (C), with ABTS activity being significantly decreased (linear negative effect) (p < 0.05). The negative interactions between the variables were seen as being non-parallel between variables. ABTS activity increased with increasing ethanol concentrations indicating it to be more effective at a lower microwave power (AB) (Figure 5a) and lower time of extraction (AC) (Figure 5b).
Figure 5.
Response surface analysis (3D) for Barleria lupulina Lindl. leaf extract (BLLE) on ABTS activity: (a) effect of ethanol concentrations and microwave power; (b) effect of ethanol concentrations and extraction time; (c) effect of microwave power and extraction time.
The results were in agreement with the findings of other studies in which the polarity of solvent used was possibly due to solubility of phenolic compounds responsible for antioxidant activities [41]. Similar with other findings of the interaction between microwave power and extraction time, the ABTS activity decreased with an increase in microwave power and prolonged time of extraction (BC) (Figure 5c). These conditions could be related with the absence or denaturing of bioactive compounds, which had the potential to scavenge because of the exposure to high heat in the longer extraction time. The extract with high ABTS activity was correlated with high values of TPC, indicating a correlation between antioxidant activity and polyphenols content. The occurrence was probably due to the polarity of the solvent used, which coincided with the solubility of the phenolic compounds responsible for ABTS activity.
In the analyses, the second-order model equation (Equations (1)–(4)) could be used to predict the responses:
| YTPC= 140.92 + 1.72A + 0.07B + 0.16C + 1.59(10−3)AB + 3.27(10−3)AC − 1.48(10−3)BC − 0.02A2 − 9.34(10−5)B2 + 8.08(10−4)C2 | (1) |
| YTFC= 69.89 − 1.06A + 0.03B − 0.26C + 5.28(10−4)AB + 4.38(10−3)AC − 1.91(10−4)BC + 8.84(10−3)A2 − 7.37(10−5)B2 + 5.38(10−4)C2 | (2) |
| YDPPH= 81.16 + 0.41A − 1.04(10−3)B − 0.25C + 6.37(10−4)AB + 4.83(10−4)AC − 4.64(10−5)BC − 5.39(10−3)A2 − 3.48(10−5)B2 + 1.51(10−3)C2 | (3) |
| YABTS= −26.42 + 3.12A − 0.03B + 0.26C − 1.08(10−3)AB − 7.21(10−3)AC − 5.24(10−4)BC − 0.01A2 + 1.17(10−4)B2 + 1.44(10−3)C2 | (4) |
Y indicates predicting responses, and A, B, and C represents ethanol concentrations, microwave power, and extraction time, respectively.
2.4. Verification of Model
A set of conditions were provided to verify the model. Desirability function was used to optimize the conditions by choosing a minimum for the time of extraction and in range for ethanol concentrations and microwave power. The conditions purposed for Barleria lupulina Lindl. leaf extract included 80% (v/v) ethanol concentration, 400 W, and 30 s at a desirability of 95.1%. Data were statistically compared between the suggested extraction conditions with the predicted values given by RSM software. The results show close agreement at a 95.1% confidence level between verification experiments with predicted values, as shown in Table 3.
Table 3.
Predicted and experimental values of responses.
| TPC (mg GAE/g Sample) |
TFC (mg QE/g Sample) |
DPPH (%) |
ABTS (%) |
|
|---|---|---|---|---|
| Predicted | 239.77 | 58.27 | 88.62 | 90.29 |
| Experimental | 238.71 | 58.09 | 87.95 | 89.56 |
TPC: total phenolic content; TFC: total flavonoid content; DPPH: 1-diphenyl-2-picrylhydrazyl (antioxidant activity); ABTS: 2,20-azino-bis (3-ethylbenzothizoline-6-sulfonic acid) (antioxidant activity).
2.5. Identification of Phytochemical Compound in B. lupulina Lindl.
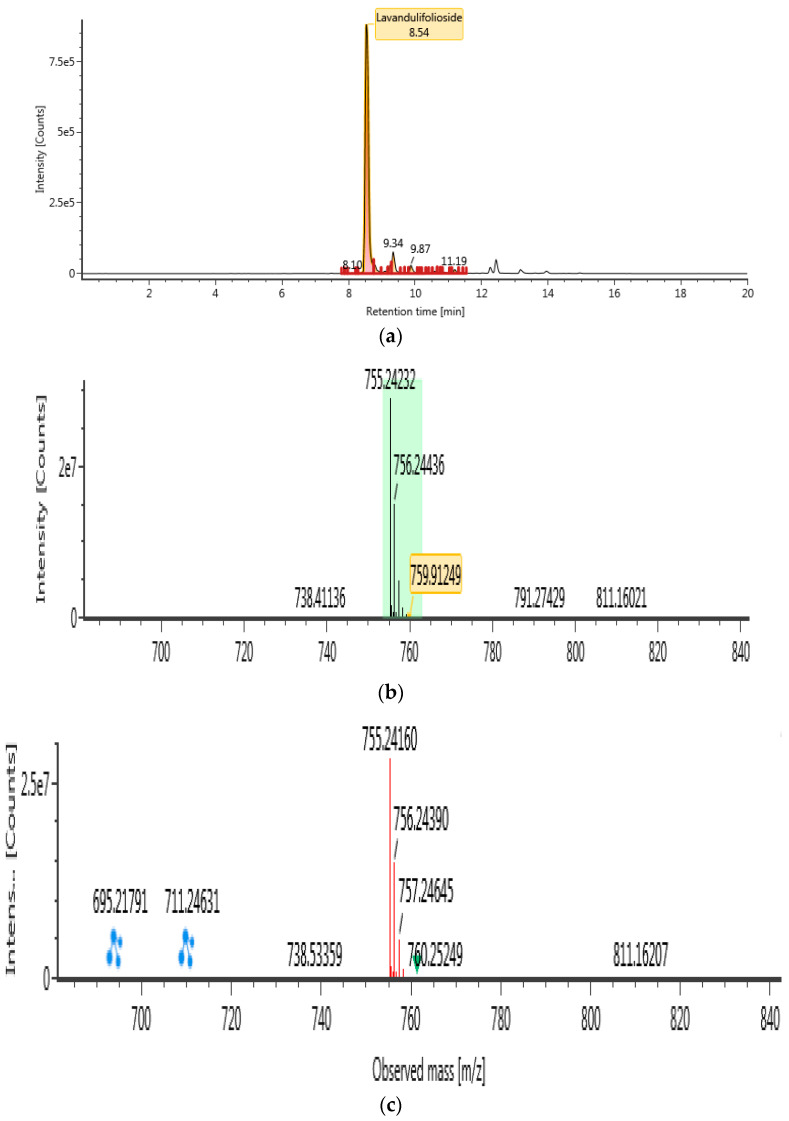
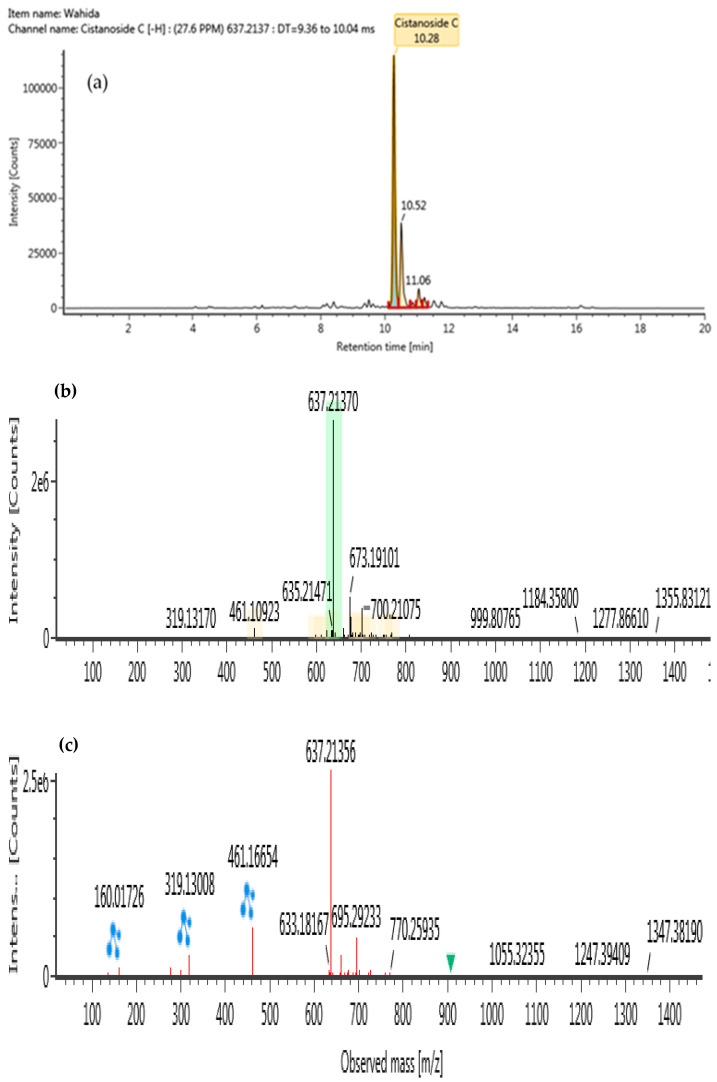
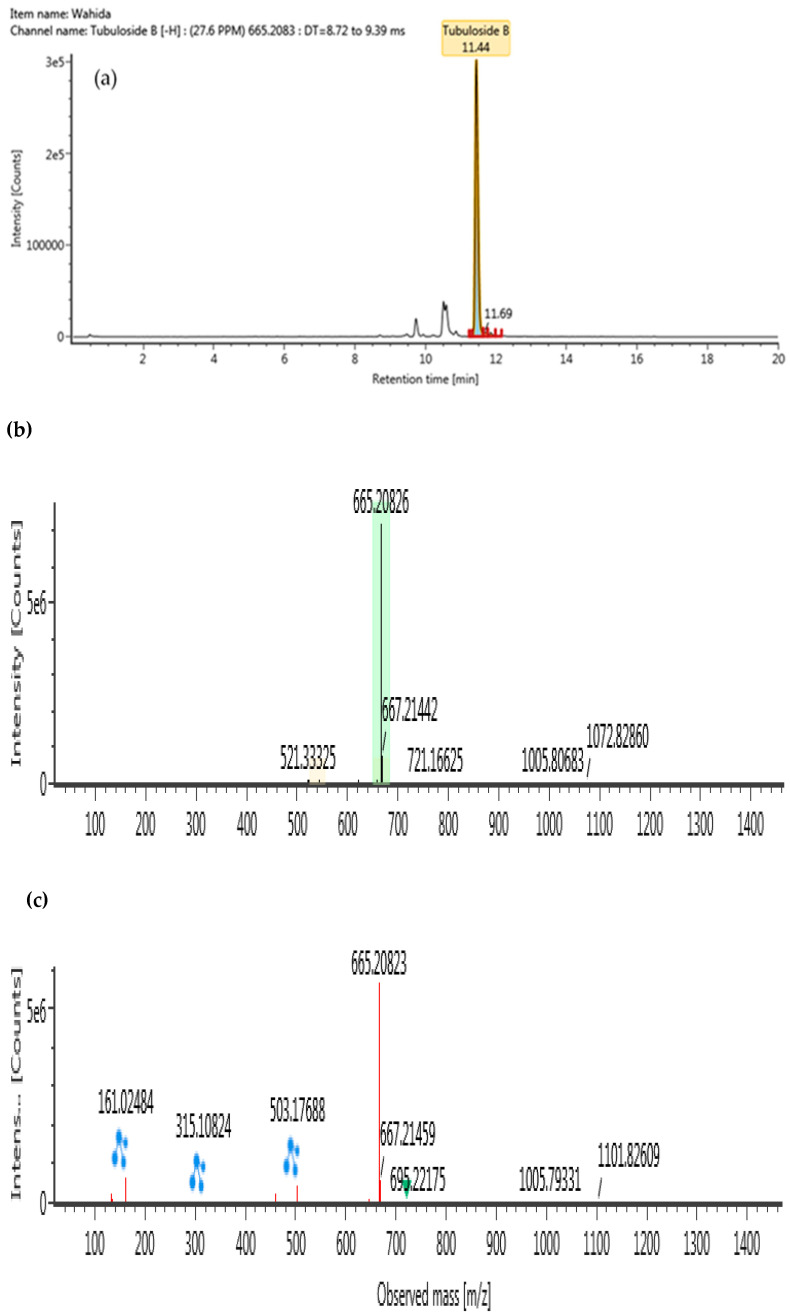
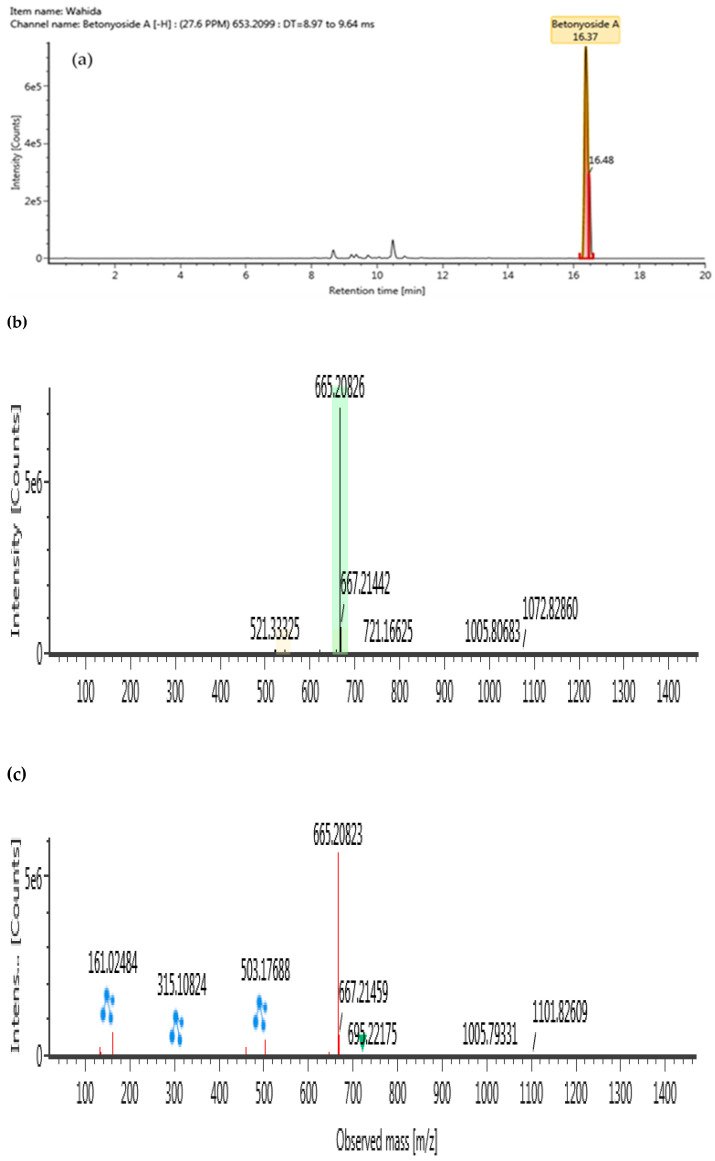
The ultra-high performance liquid–chromatography coupled with quadrupole time-of-flight mass spectrometry (UHPLC-QTOF/MS) was conducted in a negative ionization mode to characterize compounds from BLLE, as presented in Table 4. Using high resolution MS data, molecular formulae of all detected BLLE constituents could be assigned. Subsequent MS/MS measurements yielded accurate mass information on fragment ions and allowed identification of selected compounds by comparison with authentic standards or available literature data within the chromatograms. Following Waters library, compounds in the BLLE were tentatively identified on the basis of acquisition mass accuracy of less than 5 ppm with a theoretical fragment of more than one ion [39]. A total of four compounds were tentatively identified: lavandulifolioside, cistanoside C, tubuloside B, and betonyoside A. These newly detected compounds from BLLE were classified under phenylethanoid glycosides (PhGs). MS/MS Spectra of these compounds obtained at low and high collision energy are shown in Figure 6, Figure 7, Figure 8 and Figure 9.
Table 4.
Identification of phenylethanoid glycosides compounds in the Barleria lupulina Lindl. leaf extract with MS/MS fragments.
| Compound Name | Formula | Ion | Natural Mass (Da) |
Observed m/z |
∆ppm | Retention Time (min) | Ion Fragments |
|---|---|---|---|---|---|---|---|
| Lavandulifolioside | C34H44O19 | M-H | 756.24768 | 755.2423 | 2.5 | 8.54 | 695.21791; 711.24631 |
| Cistanoside C | C30H38O15 | M-H | 638.22107 | 637.2137 | −0.1 | 10.28 | 160.01726; 319.13008; 461.16654 |
| Tubuloside B | C31H38O16 | M-H | 666.21599 | 665.2083 | −0.7 | 11.44 | 161.02484; 315.10824; 503.17688 |
| Betonyoside A | C30H38O16 | M-H | 654.21599 | 653.2099 | 1.9 | 16.37 | 161.02484; 315.10824; 503.17688 |
Figure 6.
UHPLC-QTOF/MS chromatograms of lavandulifolioside from Barleria lupulina Lindl. extract (BLLE): (a) chromatogram mass spectrum; (b) low energy of mass spectrum; (c) high energy of mass spectrum.
Figure 7.
UHPLC-QTOF/MS chromatograms of cistanoside C from Barleria lupulina Lindl. leaf extract (BLLE): (a) chromatogram mass spectrum; (b) low energy of mass spectrum; (c) high energy of mass spectrum.
Figure 8.
UHPLC-QTOF/MS chromatograms of tubuloside B from Barleria lupulina Lindl. leaf extract (BLLE): (a) chromatogram mass spectrum; (b) low energy of mass spectrum; (c) high energy of mass spectrum.
Figure 9.
UHPLC-QTOF/MS chromatograms of betonyoside A from Barleria lupulina Lindl. leaf extract (BLLE): (a) chromatogram mass spectrum; (b) low energy of mass spectrum; (c) high energy of mass spectrum.
The literature has stated that PhGs are generally water-soluble phenolic compounds reported to exist mostly in the families of Acanthaceae, Berberidaceae, Lamiaceae, Loganiaceae, Magnoliaceae, etc. [60]. In the present study, ethanol was selected because of its safety of use, and it is less toxic than other solvents, such as methanol and acetone. This polar organic solvent is among solvents that are typically effective in extracting PhGs from plants, especially from medicinal plants [60,61]. Several studies have shown that PhGs possess potent antioxidant activity and gives several health benefits, including antiaging, antibacterial, anticancer, antidiabetic, anti-inflammatory, antiviral, and neuroprotective properties [62,63].
3. Materials and Methods
3.1. Samples
Fresh leaves of B. lupulina Lindl. were collected from Serdang, Selangor, Malaysia. The species was identified by a botanist at the Herbarium of the Laboratory of Natural Products, Institute of Bioscience, Universiti Putra Malaysia, based on a voucher specimen (MFI 0047/19). Leaf samples were washed with tap water, dried in an oven at 40 °C, milled into powder, and stored in airtight containers at 4 °C for subsequent use.
3.2. Microwave-Assisted Extraction (MAE)
A household microwave oven (Sharp Model R202ZS, Malaysia) equipped with timing and a microwave power linearly adjustable from 200 to 1000 W was used for optimizing MAE conditions. Leaf samples (1 g) were immersed in different ethanol concentrations at a sample: solvent ratio of 1: 10 (w/v), and only one vessel was placed in the microwave oven in each experiment. The extraction was conducted in sealed vessels in 10-second interval times with no evaporation observed [36,42]. The extracts were filtered through Whatman filter paper and vacuum-dried in a rotary evaporator until the solvent was completely removed. The extracts were kept in airtight amber bottles and stored at 4 °C prior to subsequent analyses.
3.3. Determination of Total Phenolic Content, Total Flavonoid Content, DPPH, and ABTS Assay
The dried extract (2 mg) was dissolved in 1 mL of the same solvent used for the extraction and subsequently used for total phenolic, total flavonoid content, and antioxidant activities.
3.3.1. Total Phenolic Content
Total phenolic content (TPC) was determined based on a colorimetric method [64]. Gallic acid was used as a standard; thus, the results were expressed as the mg gallic acid equivalent (mg GAE/g) of the extracted sample.
3.3.2. Total Flavonoid Content
Total flavonoid content (TFC) was evaluated based on the procedures of [65], with some modifications. Quercetin was used as the reference standard, and the result was expressed in terms of quercetin equivalent, QE (mg of quercetin/g of extract).
3.3.3. DPPH Assay
An ethanolic solution of 1-diphenyl-2-picrylhydrazyl (DPPH) radical was mixed with extract to determine antioxidant activity according to the method by [66], with some modifications. After 30 minutes of incubation, the mixture of the extract and DPPH was measured by using a UV–VIS microplate reader at 515 nm. Radical scavenging activity was expressed as the inhibition percentage and was calculated using the following formula (5):
| % Inhibition = ((A control − A sample))/A control × 100 | (5) |
3.3.4. ABTS Assay
The ABTS assay was conducted to determine the antioxidant activity of BLLE against ABTS radicals, with some modifications [67]. An ethanolic of radical solution (7 mM ABTS and 2.45 mM potassium persulfate (K2S2O8)) was kept in the dark at room temperature for 12–16 h prior to use. The radical solution was diluted with ethanol to obtain an absorbance of 0.70 ± 0.02 at 734 nm. The solution was mixed with the extract of interest and allowed to stand in the dark for 15 min before reading at 734 nm. The radical scavenging activity was expressed as the inhibition percentage and was calculated using the following formula (6):
| % Inhibition = ((A control-A sample ))/A control × 100 | (6) |
3.4. Experimental Design and Statistical Analysis
3.4.1. Single-Factor Analysis
The effects of the three independent variables, including ethanol concentrations (20–95%, v/v), extraction time (30–150 s), and microwave power (200–1000 W), were selected based on previous studies [29,30]. Single-factor analysis was used to investigate the effects of the variables on TPC, TFC, DPPH, and ABTS.
3.4.2. Response Surface Methodology (RSM)
Based on single-factor analysis, RSM was applied by using Design Expert software (Version 10) to construct a Box–Behnken design (BBD) with five central-point replicates to determine the effects of variables on responses. Three independent variables, namely ethanol concentrations (A), microwave power (B), extraction time (C), and their values and levels, are presented in Table 5. Four responses (TPC, TFC, DPPH, and ABTS) were chosen for a total of 17 experiments (Table 6).
Table 5.
Independent variable for the Box–Behnken design.
| Independent Variable | Label | Levels | ||
|---|---|---|---|---|
| −1 | 0 | 1 | ||
| Ethanol concentration (%, v/v) | A | 20 | 50 | 80 |
| Microwave Power (W) | B | 200 | 400 | 600 |
| Extraction time (s) | C | 30 | 75 | 120 |
Table 6.
Box–Behnken design with responses of variables.
| Factors | Responses | ||||||
|---|---|---|---|---|---|---|---|
| A | B | C | 1 | 2 | 3 | 4 | |
| Run | Ethanol Concentration | Microwave Power | Irradiation Time |
TPC | TFC | DPPH | ABTS |
| %, v/v | W | s | mg GAE/g | mg QE/g | % | % | |
| 1 | 50 | 200 | 120 | 233.33 | 45.82 | 87.07 | 78.48 |
| 2 | 50 | 400 | 75 | 210.00 | 40.92 | 85.61 | 64.79 |
| 3 | 20 | 400 | 30 | 186.50 | 49.38 | 80.30 | 30.08 |
| 4 | 20 | 200 | 75 | 179.33 | 42.34 | 78.08 | 34.42 |
| 5 | 80 | 200 | 75 | 230.17 | 59.26 | 80.47 | 91.96 |
| 6 | 50 | 200 | 30 | 217.00 | 44.81 | 87.27 | 73.30 |
| 7 | 80 | 400 | 30 | 239.33 | 58.19 | 88.75 | 92.08 |
| 8 | 80 | 400 | 120 | 231.33 | 65.27 | 88.22 | 59.11 |
| 9 | 20 | 600 | 75 | 149.00 | 29.15 | 70.21 | 33.20 |
| 10 | 50 | 400 | 75 | 227.17 | 44.58 | 84.87 | 66.87 |
| 11 | 50 | 400 | 75 | 224.17 | 46.68 | 85.24 | 59.25 |
| 12 | 50 | 600 | 120 | 185.00 | 32.77 | 86.03 | 60.83 |
| 13 | 50 | 400 | 75 | 215.33 | 41.42 | 85.81 | 70.16 |
| 14 | 50 | 400 | 75 | 205.50 | 38.24 | 85.52 | 59.75 |
| 15 | 80 | 600 | 75 | 238.00 | 58.75 | 87.89 | 64.86 |
| 16 | 50 | 600 | 30 | 222.00 | 38.64 | 87.90 | 74.50 |
| 17 | 20 | 400 | 120 | 160.83 | 32.80 | 77.16 | 36.05 |
3.5. Identification of Compounds
Ultra-high-performance liquid–chromatography (UHPLC-QTOF/MS) and a Waters Acquity ultra-performance LC system (Waters, Milford, MA, USA) were used in identifying bioactive compounds. A column (ACQUITY UPLC HSS T3, 100 mm × 2.1 mm × 1.8 µm, Waters, Manchester, UK) was used to separate the chromatographic compounds. A linear binary gradient was used for mobile phases A (0.1% formic acid) and B (acetonitrile) followed by a multistep gradient: 0 min, 1% B and 99% A; 0.5 min, 1% B and 99% A; 16.00 min, 35% B and 65% A; 18.00 min, 100% B and 0% A; and 20.00 min, 1% B and 99% A. An aliquot of 1 µL injection volume of the sample at 0.6 mL/min flow rate was set. Data were acquired in an independent data analysis (IDA) in the range m/z of 50–1500 at 0.1 s/scan in high-definition mass spectrometry elevated energy (HDMSE) mode with two independent scans and different collision energies (CE). The run of a low-energy (LE) scan was at a fixed CE of 4 eV, and in a high-energy (HE) scan, the CE was ramped from 10 to 40 eV.
3.6. Statistical Analysis
One-way analysis of variance (ANOVA, SAS 9.4, SAS Institute Inc, Cary, NC, USA) was used to calculate the difference in means among different parameters in the single-factor analysis (p < 0.05). The optimal values of the three response variables were predicted by their optimal value by constructing a BBD using Design Expert 10 software. All experimental results were carried out in triplicates, and results are reported as means ± SD.
4. Conclusions
The conditions for optimal extraction of B. lupulina Lindl. leaf extracts were investigated using microwave-assisted extraction procedures. Three independent variables (ethanol concentration, microwave power, and extraction time) that give an optimum value of TPC, TFC, and antioxidant activities obtained from single-factor experiments were further optimized by response surface methodology (RSM) based on a Box–Behnken design. The quadratic models obtained by RSM were accurate and reliable in which R2 and adjusted R2 were more than 0.90 with a non-significant lack of fit at p > 0.05. The optimal extraction conditions showed 80% (v/v) of ethanol concentration with a microwave power of 400 W, and an extraction time of 30 s resulted in a 238.71 mg gallic acid equivalent (GAE)/g sample (TPC), 58.09 mg QE/g sample (TFC), 87.95% (DPPH), and 89.56% (ABTS). Results from the validation experiments are in agreement with predicted values. The UHPLC-QTOF-MS confirmed four new phenylethanoid glycosides compounds in BLLE. We suggest that the optimal conditions of the extract be further studied in in vivo antioxidant activity.
Acknowledgments
The authors gratefully acknowledge the final assistance grant by Universiti Putra Malaysia undergraduate Research Fellowship (GRF).
Author Contributions
N.W.I.-S. conceived the study, designed and performed the experiments, and drafted the manuscript; S.S.A.G. participated in designing the experiments, drafted the manuscript, and provided comments to the paper; U.H.Z., M.I.E.H. and P.B. designed and supervised the workflow of the experiment. All authors have read and agreed to the published version of the manuscript.
Funding
This research was funded by the Geran Putra Berimpak of Universiti Putra Malaysia (UPM) (Grant No. 9688800).
Conflicts of Interest
The authors declare no conflict of interest.
Footnotes
Publisher’s Note: MDPI stays neutral with regard to jurisdictional claims in published maps and institutional affiliations.
References
- 1.Adebooye O.C., Alashi A.M., Aluko R.E. A brief review on emerging trends in global polyphenol research. J. Food Biochem. 2018;42:1–7. doi: 10.1111/jfbc.12519. [DOI] [Google Scholar]
- 2.Guo Q., Zhao B., Shen S., Hou J., Hu J., Xin W. ESR study on the structure-antioxidant activity relationship of tea catechins and their epimers. Biochim. Biophys. Acta. 1999 doi: 10.1016/S0304-4165(98)00168-8. [DOI] [PubMed] [Google Scholar]
- 3.Panche A.N., Diwan A.D., Chandra S.R. Flavonoids: An overview. J. Nutr. Sci. 2016:5. doi: 10.1017/jns.2016.41. [DOI] [PMC free article] [PubMed] [Google Scholar]
- 4.LeJeune T.M., Tsui H.Y., Parsons L.B., Miller G.E., Whitted C., Lynch K.E., Ramsauer R.E., Patel J.U., Wyatt J.E., Street D.S., et al. Mechanism of Action of Two Flavone Isomers Targeting Cancer Cells with Varying Cell Differentiation Status. PLoS ONE. 2015 doi: 10.1371/journal.pone.0142928. [DOI] [PMC free article] [PubMed] [Google Scholar]
- 5.Snijman P.W., Swanevelder S., Joubert E., Green I.R., Gelderblom W.C.A. The antimutagenic activity of the major flavonoids of rooibos (Aspalathus linearis): Some dose-response effects on mutagen activation-flavonoid interactions. Mutat. Res. Genet. Toxicol. Environ. Mutagen. 2007 doi: 10.1016/j.mrgentox.2007.03.009. [DOI] [PubMed] [Google Scholar]
- 6.Allied Market Research Polyphenol Market to Reach $1127 Million by 2022, Globally. [(accessed on 29 March 2021)];2017 Available online: https://www.alliedmarketresearch.com/polyphenol-market.
- 7.Darbyshire I., Fisher A.E., Kiel C.A., McDade L.A. Phylogenetic relationships among species of Barleria (Acanthaceae, Lamiales): Molecular data reveal complex patterns of morphological evolution and support a revised classification. Taxon. 2019;68:92–111. doi: 10.1002/tax.12029. [DOI] [Google Scholar]
- 8.Samuel A.J.S.J., Kalusalingam A., Chellappan D.K., Gopinath R., Radhamani S., Husain H.A., Muruganandham V., Promwichit P. Ethnomedical survey of plants used by the Orang Asli in Kampung Bawong, Perak, West Malaysia. J. Ethnobiol. Ethnomed. 2010 doi: 10.1186/1746-4269-6-5. [DOI] [PMC free article] [PubMed] [Google Scholar]
- 9.Widyowati R., Tezuka Y., Miyahara T., Awale S., Kadota S. Alkaline phosphatase (ALP) enhancing iridoid glucosides from the Indonesian medicinal plant Barleria lupulina. Nat. Prod. Commun. 2010 doi: 10.1177/1934578X1000501101. [DOI] [PubMed] [Google Scholar]
- 10.Kanchanapoom T., Kasai R., Yamasaki K. Iridoid glucosides from Barleria lupulina. Phytochemistry. 2001 doi: 10.1016/S0031-9422(01)00236-9. [DOI] [PubMed] [Google Scholar]
- 11.Kumari R., Kumar S., Kumar A., Goel K.K., Dubey R.C. Antibacterial, antioxidant and Immuno-modulatory properties in extracts of Barleria lupulina Lindl. BMC Complement. Altern. Med. 2017 doi: 10.1186/s12906-017-1989-4. [DOI] [PMC free article] [PubMed] [Google Scholar]
- 12.Senger D.R., Hoang M.V., Kim K.H., Li C., Cao S. Anti-inflammatory activity of Barleria lupulina: Identification of active compounds that activate the Nrf2 cell defense pathway, organize cortical actin, reduce stress fibers, and improve cell junctions in microvascular endothelial cells. J. Ethnopharmacol. 2016 doi: 10.1016/j.jep.2016.09.017. [DOI] [PMC free article] [PubMed] [Google Scholar]
- 13.Yoosook C., Panpisutchai Y., Chaichana S., Santisuk T., Reutrakul V. Evaluation of anti-HSV-2 activities of Barleria lupulina and Clinacanthus nutans. J. Ethnopharmacol. 1999;67:179–187. doi: 10.1016/S0378-8741(99)00008-2. [DOI] [PubMed] [Google Scholar]
- 14.Rattanakiat S. Anti-herpes simplex virus type 2 activities of some Thai medicinal plants. Thai J. Pharm. Sci. 2006;30:19–27. [Google Scholar]
- 15.Moin S., Babu S.S., Mahalakshmipriya A. In vitro callus production and antibacterial activity of barleria lupulina lindl. Asia Pac. J. Mol. Biol. Biotechnol. 2012;20:59–64. [Google Scholar]
- 16.Chomnawang M.T., Surassmo S., Wongsariya K., Bunyapraphatsara N. Antibacterial Activity of Thai Medicinal Plants against Methicillin-resistant Staphylococcus aureus. Fitoterapia. 2009;80:102–104. doi: 10.1016/j.fitote.2008.10.007. [DOI] [PubMed] [Google Scholar]
- 17.Suba V., Murugesan T., Arunachalam G., Mandal S.C., Saha B.P. Anti-diabetic potential of Barleria lupulina extract in rats. Phytomedicine. 2004;11:202–205. doi: 10.1078/0944-7113-00316. [DOI] [PubMed] [Google Scholar]
- 18.Sirisidthi N.K., Chabra S., Jiraungkoorskul K., Jiraungkoorskul W. Evaluation of total essential oil and cytotoxic activity of Barleria lupulina Lindl. Asia Pac. J. Mol. Biol. Biotechnol. 2016;24:1–6. [Google Scholar]
- 19.Kumari R., Chandra Dubey R. Phytochemical Analysis and Antibacterial and Cytotoxic Properties of Barleria lupulina Lindl. Extracts. J. Plant Pathol. Microbiol. 2016:7. doi: 10.4172/2157-7471.1000380. [DOI] [Google Scholar]
- 20.Mazumder P.M., Mondal A., Sasmal D., Arulmozhi S., Rathinavelusamy P. Evaluation of antiarthritic and immunomodulatory activity of Barleria lupulina. Asian Pac. J. Trop. Biomed. 2012;2:1400–1406. doi: 10.1016/S2221-1691(12)60425-0. [DOI] [Google Scholar]
- 21.Mazumder P.M., Agarwal V., Sasmal D., Rathinavelusamy P. Evaluation of acute and sub-chronic diuretic, saluretic and kaliuretic effects of Barleria lupulina. Pharmacologia. 2012;3:462–466. doi: 10.5567/pharmacologia.2012.462.466. [DOI] [Google Scholar]
- 22.Tuntiwachwuttikul P., Pancharoen O., Taylor W.C. Iridoid glucosides of Barleria lupulina. Phytochemistry. 1998 doi: 10.1016/S0031-9422(97)01049-2. [DOI] [Google Scholar]
- 23.Lee S.R., Clardy J., Senger D.R., Cao S., Kim K.H. Iridoid and phenylethanoid glycosides from the aerial part of Barleria lupulina. Rev. Bras. Farmacogn. 2016 doi: 10.1016/j.bjp.2016.01.002. [DOI] [Google Scholar]
- 24.Azwanida N.N. A review on the extraction methods use in medicinal plants, principle, strength and limitation. Med. Aromat. Plants. 2015;4:3–8. doi: 10.4172/2167-0412.1000196. [DOI] [Google Scholar]
- 25.Naczk M., Shahidi F. Phenolics in cereals, fruits and vegetables: Occurrence, extraction and analysis. J. Pharm. Biomed. Anal. 2006;41:1523–1542. doi: 10.1016/j.jpba.2006.04.002. [DOI] [PubMed] [Google Scholar]
- 26.Minatel I.O., Borges C.V., Ferreira M.I., Gomez H.A.G., Chen C.-Y.O., Lima G.P.P. Phenolic Compounds: Functional Properties, Impact of Processing and Bioavailability. Phenolic Compd. Biol. Act. 2017;8:1–24. [Google Scholar]
- 27.Dhanani T., Shah S., Gajbhiye N.A., Kumar S. Effect of extraction methods on yield, phytochemical constituents and antioxidant activity of Withania somnifera. Arab. J. Chem. 2017 doi: 10.1016/j.arabjc.2013.02.015. [DOI] [Google Scholar]
- 28.Zhao C.N., Zhang J.J., Li Y., Meng X., Li H. Bin Microwave-assisted extraction of phenolic compounds from melastoma sanguineum fruit: Optimization and identification. Molecules. 2018;23:2498. doi: 10.3390/molecules23102498. [DOI] [PMC free article] [PubMed] [Google Scholar]
- 29.Dahmoune F., Nayak B., Moussi K., Remini H., Madani K. Optimization of microwave-assisted extraction of polyphenols from Myrtus communis L. leaves. Food Chem. 2015 doi: 10.1016/j.foodchem.2014.06.066. [DOI] [PubMed] [Google Scholar]
- 30.Dahmoune F., Spigno G., Moussi K., Remini H., Cherbal A., Madani K. Pistacia lentiscus leaves as a source of phenolic compounds: Microwave-assisted extraction optimized and compared with ultrasound-assisted and conventional solvent extraction. Ind. Crop. Prod. 2014 doi: 10.1016/j.indcrop.2014.06.035. [DOI] [Google Scholar]
- 31.Mandal S.C., Mandal V., Das A.K. Essentials of Botanical Extraction. Elsevier; Amsterdam, The Netherlands: 2015. Classification of Extraction Methods; pp. 83–136. [Google Scholar]
- 32.Vinatoru M., Mason T.J., Calinescu I. Ultrasonically assisted extraction (UAE) and microwave assisted extraction (MAE) of functional compounds from plant materials. TrAC Trends Anal. Chem. 2017;97:159–178. doi: 10.1016/j.trac.2017.09.002. [DOI] [Google Scholar]
- 33.Chan C.H., Yusoff R., Ngoh G.C., Kung F.W.L. Microwave-assisted extractions of active ingredients from plants. J. Chromatogr. A. 2011;1218:6213–6225. doi: 10.1016/j.chroma.2011.07.040. [DOI] [PubMed] [Google Scholar]
- 34.Aydar A.Y. Statistical Approaches With Emphasis on Design of Experiments Applied to Chemical Processes. IntechOpen; London, UK: 2018. Utilization of Response Surface Methodology in Optimization of Extraction of Plant Materials. [DOI] [Google Scholar]
- 35.Boyaci I.H. A new approach for determination of enzyme kinetic constants using response surface methodology. Biochem. Eng. J. 2005 doi: 10.1016/j.bej.2005.04.001. [DOI] [Google Scholar]
- 36.Bhuyan D.J., Van Vuong Q., Chalmers A.C., van Altena I.A., Bowyer M.C., Scarlett C.J. Microwave-assisted extraction of Eucalyptus robusta leaf for the optimal yield of total phenolic compounds. Ind. Crop. Prod. 2015 doi: 10.1016/j.indcrop.2015.02.044. [DOI] [Google Scholar]
- 37.Ghadge S.V., Raheman H. Process optimization for biodiesel production from mahua (Madhuca indica) oil using response surface methodology. Bioresour. Technol. 2006 doi: 10.1016/j.biortech.2005.03.014. [DOI] [PubMed] [Google Scholar]
- 38.Nayak M.G., Vyas A.P. Optimization of microwave-assisted biodiesel production from Papaya oil using response surface methodology. Renew. Energy. 2019 doi: 10.1016/j.renene.2019.01.054. [DOI] [Google Scholar]
- 39.Md Yusof A.H., Abd Gani S.S., Zaidan U.H., Halmi M.I.E., Zainudin B.H. Optimization of an Ultrasound-Assisted Extraction Condition for Flavonoid Compounds from Cocoa Shells (Theobroma cacao) Using Response Surface Methodology. Molecules. 2019;24:711. doi: 10.3390/molecules24040711. [DOI] [PMC free article] [PubMed] [Google Scholar]
- 40.Zulkifli S.A., Gani S.S.A., Zaidan U.H., Halmi M.I.E. Optimization of Total Phenolic and Flavonoid Contents of Defatted Pitaya (Hylocereus polyrhizus) Seed Extract and Its Antioxidant Properties. Molecules. 2020;25:787. doi: 10.3390/molecules25040787. [DOI] [PMC free article] [PubMed] [Google Scholar]
- 41.Mohamed Mahzir K.A., Abd Gani S.S., Hasanah Zaidan U., Halmi M.I.E. Development of Phaleria macrocarpa (Scheff.) Boerl Fruits Using Response Surface Methodology Focused on Phenolics, Flavonoids and Antioxidant Properties. Molecules. 2018;23:724. doi: 10.3390/molecules23040724. [DOI] [PMC free article] [PubMed] [Google Scholar]
- 42.Ismail-Suhaimy N.W., Abd Gani S.S., Zaidan U.H., Halmi M.I.E., Bawon P. Effects of extraction methods on total phenolic and flavonoid contents and antioxidant activity of Barlerialupulina Lindl. Test Eng. Manag. 2019;81:980–986. [Google Scholar]
- 43.Tabaraki R., Nateghi A. Optimization of ultrasonic-assisted extraction of natural antioxidants from rice bran using response surface methodology. Ultrason. Sonochem. 2011 doi: 10.1016/j.ultsonch.2011.05.004. [DOI] [PubMed] [Google Scholar]
- 44.Shang A., Luo M., Gan R.Y., Xu X.Y., Xia Y., Guo H., Liu Y., Li H. Bin Effects of microwave-assisted extraction conditions on antioxidant capacity of sweet tea (Lithocarpus polystachyus rehd.) Antioxidants. 2020;9:678. doi: 10.3390/antiox9080678. [DOI] [PMC free article] [PubMed] [Google Scholar]
- 45.Chew K.K., Khoo M.Z., Ng S.Y., Thoo Y.Y., Wan Aida W.M., Ho C.W. Effect of ethanol concentration, extraction time and extraction temperature on the recovery of phenolic compounds and antioxidant capacity of Orthosiphon stamineus extracts. Int. Food Res. J. 2011;18:1427–1435. [Google Scholar]
- 46.Flórez N., Conde E., Domínguez H. Microwave assisted water extraction of plant compounds. J. Chem. Technol. Biotechnol. 2015 doi: 10.1002/jctb.4519. [DOI] [Google Scholar]
- 47.Routray W., Orsat V. Microwave-Assisted Extraction of Flavonoids: A Review. Food Bioprocess Technology. 2012;5:409–424. doi: 10.1007/s11947-011-0573-z. [DOI] [Google Scholar]
- 48.Yuan Y., Gao Y., Mao L., Zhao J. Optimisation of conditions for the preparation of β-carotene nanoemulsions using response surface methodology. Food Chem. 2008 doi: 10.1016/j.foodchem.2007.09.015. [DOI] [Google Scholar]
- 49.Puértolas E., Saldaña G., Álvarez I., Raso J. Experimental design approach for the evaluation of anthocyanin content of rosé wines obtained by pulsed electric fields. Influence of temperature and time of maceration. Food Chem. 2011 doi: 10.1016/j.foodchem.2010.11.164. [DOI] [Google Scholar]
- 50.Mazumder P.M., Paramaguru R., Mohanty A., Sasmal D. Evaluation of in vitro Anticataract Activity and Aldose Reductase Potential of Barleria lupulina Lindl. Pharmacologia. 2014 doi: 10.5567/pharmacologia.2014.172.176. [DOI] [Google Scholar]
- 51.Zhang Z.S., Li D., Wang L.J., Ozkan N., Chen X.D., Mao Z.H., Yang H.Z. Optimization of ethanol-water extraction of lignans from flaxseed. Sep. Purif. Technol. 2007 doi: 10.1016/j.seppur.2007.03.006. [DOI] [Google Scholar]
- 52.Ballard T.S., Mallikarjunan P., Zhou K., O’Keefe S. Microwave-assisted extraction of phenolic antioxidant compounds from peanut skins. Food Chem. 2010 doi: 10.1016/j.foodchem.2009.11.063. [DOI] [PubMed] [Google Scholar]
- 53.Wang L., Weller C.L. Recent advances in extraction of nutraceuticals from plants. Trends Food Sci. Technol. 2006;17:300–312. doi: 10.1016/j.tifs.2005.12.004. [DOI] [Google Scholar]
- 54.Ma W., Lu Y., Dai X., Liu R., Hu R., Pan Y. Determination of anti-tumor constitute mollugin from traditional Chinese medicine Rubia cordifolia: Comparative study of classical and microwave extraction techniques. Sep. Sci. Technol. 2009 doi: 10.1080/01496390802691265. [DOI] [Google Scholar]
- 55.Hu Z., Cai M., Liang H.H. Desirability function approach for the optimization of microwave-assisted extraction of saikosaponins from Radix Bupleuri. Sep. Purif. Technol. 2008 doi: 10.1016/j.seppur.2007.10.016. [DOI] [PMC free article] [PubMed] [Google Scholar]
- 56.Krishnaswamy K., Orsat V., Gariépy Y., Thangavel K. Optimization of Microwave-Assisted Extraction of Phenolic Antioxidants from Grape Seeds (Vitis vinifera) Food Bioprocess Technol. 2013 doi: 10.1007/s11947-012-0800-2. [DOI] [Google Scholar]
- 57.Destandau E., Michel T., Elfakir C. Microwave-assisted extraction. RSC Green Chem. 2013 doi: 10.1039/9781849737579-00113. [DOI] [Google Scholar]
- 58.Paixão N., Perestrelo R., Marques J.C., Câmara J.S. Relationship between antioxidant capacity and total phenolic content of red, rosé and white wines. Food Chem. 2007 doi: 10.1016/j.foodchem.2007.04.017. [DOI] [Google Scholar]
- 59.Haddadi-Guemghar H., Janel N., Dairou J., Remini H., Madani K. Optimisation of microwave-assisted extraction of prune (Prunus domestica) antioxidants by response surface methodology. Int. J. Food Sci. Technol. 2014 doi: 10.1111/ijfs.12526. [DOI] [Google Scholar]
- 60.Wu L., Georgiev M.I., Cao H., Nahar L., El-Seedi H.R., Sarker S.D., Xiao J., Lu B. Therapeutic potential of phenylethanoid glycosides: A systematic review. Med. Res. Rev. 2020:1–45. doi: 10.1002/med.21717. [DOI] [PubMed] [Google Scholar]
- 61.Jiménez C., Riguera R. Phenylethanoid glycosides in plants: Structure and biological activity. Nat. Prod. Rep. 1994 doi: 10.1039/NP9941100591. [DOI] [PubMed] [Google Scholar]
- 62.Alipieva K., Korkina L., Orhan I.E., Georgiev M.I. Verbascoside—A review of its occurrence, (bio)synthesis and pharmacological significance. Biotechnol. Adv. 2014;32:1065–1076. doi: 10.1016/j.biotechadv.2014.07.001. [DOI] [PubMed] [Google Scholar]
- 63.Xue Z., Yang B. Phenylethanoid glycosides: Research advances in their phytochemistry, pharmacological activity and pharmacokinetics. Molecules. 2016;21:991. doi: 10.3390/molecules21080991. [DOI] [PMC free article] [PubMed] [Google Scholar]
- 64.Singleton V.L., Rossi J.A., Jr. Colorimetry of total phenolics with phosphomolybdic-phosphotungstic acid reagents. Am. J. Enol. Vitic. 1965;16:144–158. [Google Scholar]
- 65.Stanković M. Total phenolic content, flavonoid concentration and antioxidant activity of Marrubium peregrinum L. extracts. Kragujev. J. Sci. 2011;33:63–72. [Google Scholar]
- 66.Blois M.S. Antioxidant determinations by the use of a stable free radical. Nature. 1958;181:1199–1200. doi: 10.1038/1811199a0. [DOI] [Google Scholar]
- 67.Re R., Pellegrini N., Proteggente A., Pannala A., Yang M., Rice-Evans C. Antioxidant activity applying an improved ABTS radical cation decolorization assay. Free Radic. Biol. Med. 1999 doi: 10.1016/S0891-5849(98)00315-3. [DOI] [PubMed] [Google Scholar]


