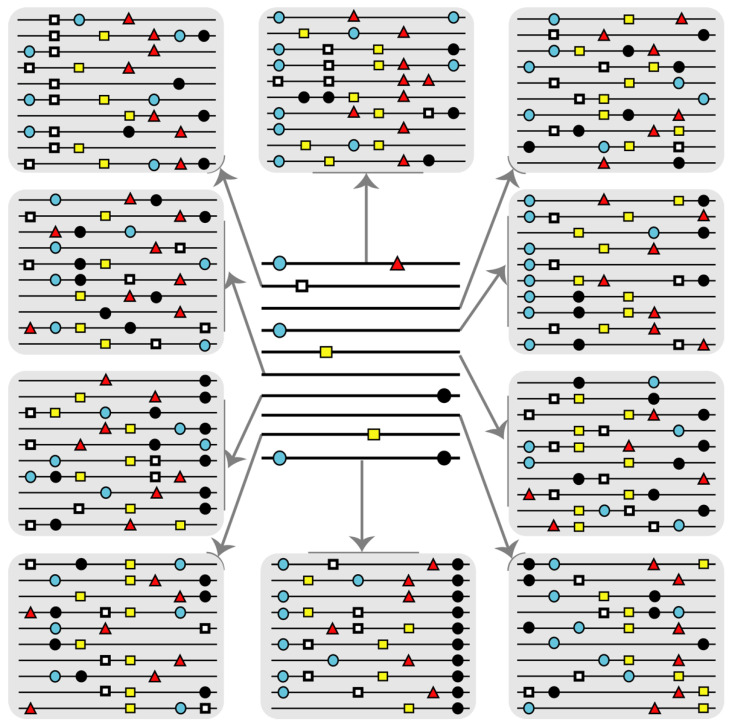
Figure 6.
Scheme that illustrates the interest of incorporating information retrieved from mutant spectra into data bases for viruses. Each horizontal line represents a nucleotide or amino acid sequence with mutations or amino acid substitutions represented by symbols on the lines. Variations are relative to a reference sequence that in this case is a line without symbols. The center distribution describes an alignment of consensus sequences or sequences currently available in data banks. Each line is in reality an average of many different sequences with mutations additional to those included.

