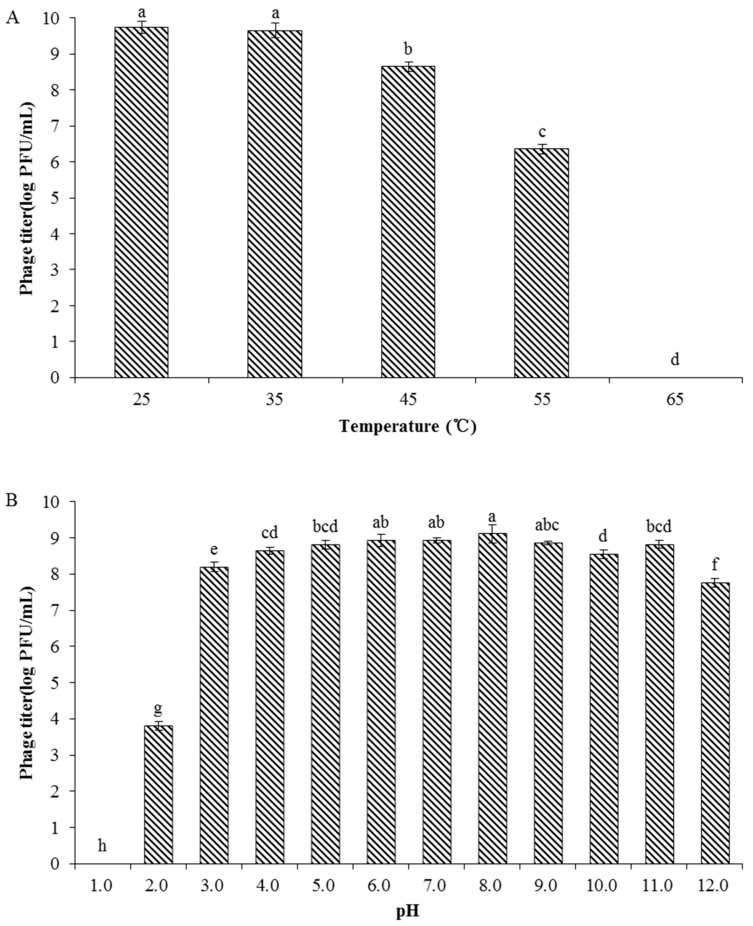
Figure 3.
Stability of phage PN09. (A) Thermostability (B) pH stability. The means and standard deviations of three independent assays are shown. Shared letters above bars indicate no statistical difference among groups (p > 0.05) and different letters above bars indicate a statistically significant difference (p < 0.05). Phage PN09 showed a relatively high survival rate at pH 6.0–9.0.

