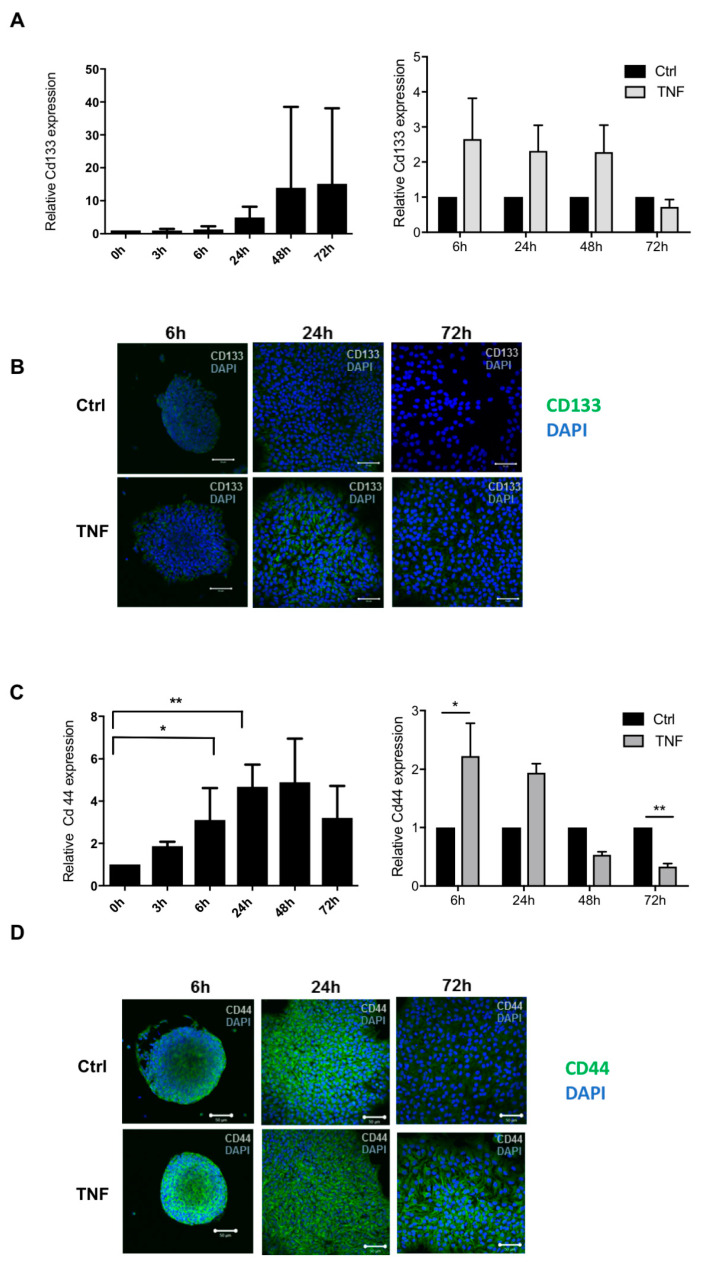
Figure 3.
TNF tends to increase immaturity markers. Kinetic of Cd133 (A) and Cd44 (C) gene expression obtained by RT-PCR. Each time point is normalized to its 0 h of differentiation. (A) Effect of TNF treatment on Cd133 (A) and Cd44 (C) gene expression obtained by RT-PCR. Each time point is normalized to its FBS control (Ctrl = 1) * p < 0.05 and ** p < 0.01. Results are given as mean ± SEM (n = 4). (B) Immunocytochemistry showing CD133 (B) and CD44 (D) protein expression (green) in TNF treated cells at 6, 24, and 72 h. Nuclei were counterstained with DAPI (blue). Scale bar: 50 µm.

