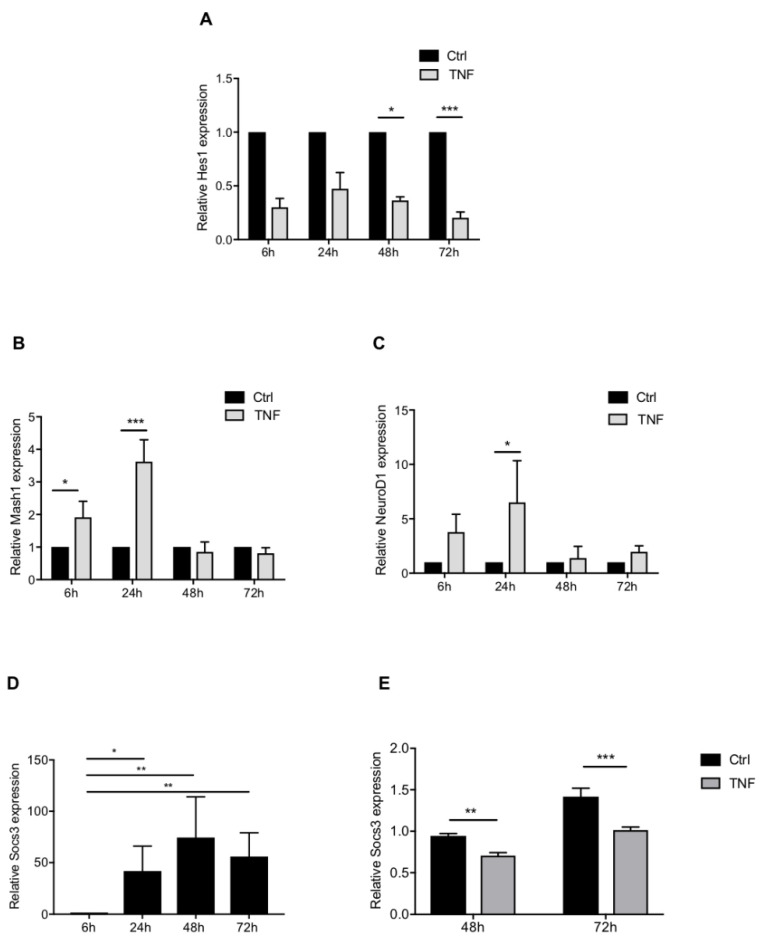
Figure 6.
Effect of NF-kB activation on the main astrocytic signaling pathways during NSPs differentiation into astrocytes. Effect of TNF treatment on Hes1 (A), Mash1 (B), and NeuroD1 (C) genes expression obtained by RT-PCR. Each time point is normalized to its FBS control (Ctrl = 1). Results are given as mean ± SEM (n = 4). Kinetic of Socs3 mRNA gene expression obtained by RT-PCR. Each time point is normalized to 6 h of differentiation. Results are given as mean ± SEM (n = 3) (D). Effect of TNF treatment on Socs3 gene expression obtained by RT-PCR. Results are given as mean ± SEM (n = 6) (E). * p < 0.05, ** p < 0.01 and *** p < 0.001.

