Abstract
Basal cell carcinoma (BCC) and squamous cell carcinoma (SCC) are both derived from epidermal keratinocytes but phenotypically diverge. To improve understanding of keratinocyte carcinogenesis, it is critical to understand epigenetic alterations, particularly those that govern gene expression. We examined changes to the enhancer-associated histone acetylation mark H3K27ac by mapping matched tumor-normal pairs from 11 patients (5 with BCC and 6 with SCC) undergoing Mohs surgery. Our analysis uncovered cancer-specific enhancers based on differential H3K27ac peaks between matched tumor-normal pairs. We also uncovered biologic pathways potentially altered in keratinocyte carcinoma including enriched epidermal development and Wnt signaling pathways enriched in BCCs, and enriched immune response and cell activation pathways in SCCs. We also observed enrichment of transcription factors that implicated SMAD and JDP2 in BCC pathogenesis and FOXP1 in SCC pathogenesis. Based on these findings, we prioritized three loci with putative regulation events: FGFR2 enhancer in BCC, intragenic regulation of FOXP1 in SCC, and WNT5A promoter in both subtypes and validated our findings with published gene expression data. Our findings highlight unique and shared epigenetic alterations in histone modifications and potential regulators for BCCs and SCCs that likely impact divergent oncogenic pathways, paving the way for targeted drug discoveries.
Keywords: epigenetic, keratinocyte carcinoma, skin cancer, squamous cell carcinoma, basal cell carcinoma, FOXP, Wnt
INTRODUCTION
Keratinocyte carcinoma (KC), comprised of basal cell carcinoma (BCC) and squamous cell carcinoma (SCC), is the most common cancer in the United States, and its incidence is rising (Rogers et al. 2015). KCs are derived from epidermal keratinocytes, which constitute 90% of the human epidermis (Rook and Burns, 2004). KCs can serve as a unique model for examining the molecular changes that arise as a progenitor cell, the keratinocyte, gives rise to two phenotypically distinct tumors, BCCs and SCCs. Although prior genome-wide association studies (GWAS) have identified genes associated with KC risk (Asgari et al., 2016, Chahal et al., 2016, Liyanage et al., 2019, Roberts et al., 2019, Sarin et al., 2020), no studies, to our knowledge, have examined genome-wide epigenetic alterations in KC.
The epigenome plays a pivotal role in oncogenesis and is important to characterize because, unlike the genome, it is amenable to therapeutic intervention. Yet for keratinocyte carcinogenesis, it remains poorly understood. Epigenetic modifications may signal reversible changes to gene function and expression that play a critical role in cancer initiation, development, and progression (Zhao and Shilatifard, 2019). Histone modifications serve as important markers to identify regulatory elements in the genome. Histones can undergo multiple post-translational modifications which associate with open and closed chromatin states, activating or repressing gene expression. Unlike genes inactivated by nucleotide sequence variation, genes silenced by epigenetic mechanisms are intact and retain the potential to be reactivated by the intervention. Furthermore, epigenetic changes can serve as biomarkers for detection, prognosis, risk assessment, and disease monitoring.
We sought to identify epigenetic changes in histone modifications in BCC and SCC as compared to matched normal keratinocytes derived from patient samples undergoing surgical resection to identify shared and unique epigenetic alterations. The overarching goal is to pave the way for identifying possible new therapeutic pathways for these very common tumors.
RESULTS
Identification of keratinocyte carcinoma-specific enhancers
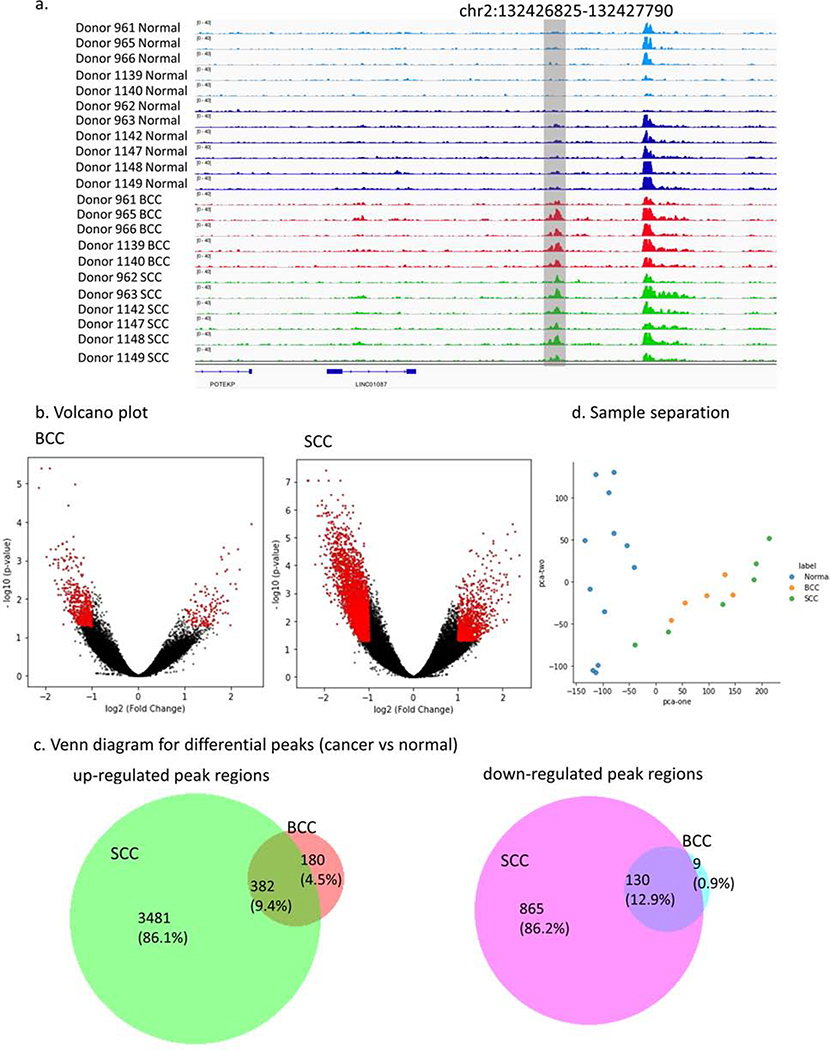
The paired samples (5 BCC-normal and 6 SCC-normal pairs) were collected from patients (48–84 years in age) and sequenced at a depth of 30–45 million reads (Table 1). We performed ChIP-seq for H3K27ac, an epigenetic modification to the DNA packaging protein histone H3, which is associated with active enhancers (Davis et al., 2018, Dunham et al., 2012). Running a peak calling pipeline based on guidelines from the ENCODE consortium (Davis et al., 2018, Dunham et al., 2012), we recovered ~60–70 K peaks per sample, which were combined into a 250,344 union peak set, and analyzed using Deeptools (Ramírez et al., 2016) to quantify signal intensity. Comparing these peaks with peaks from previously profiled skin samples, we observed high concordance (95% peak overlap), whereas other non-cutaneous tissue types showed modest concordance (75%–82% peak overlap), suggesting strong validity in our data pipeline (Supplementary Figure 1). Figure 1a shows a genomic region at chr2:132426825–132427790 that visually highlights the differential peaks between normal and tumor samples.
Table 1.
Baseline characteristics and read depth of basal cell carcinoma and squamous cell carcinoma tissue samples
| Aligned read deptha | |||||||
|---|---|---|---|---|---|---|---|
| ID | Age (years) | Sex | Phenotype | Keratinocyte Carcinoma |
Matched Normal |
||
| H3K27ac | WCEb | H3K27ac | WCEb | ||||
| Basal Cell Carcinoma | |||||||
| Donor 961 | 77 | Male | Superficial, nodular and infiltrative | 34.5 | 57 | 40.9 | 53 |
| Donor 965 | 48 | Female | Superficial, nodular and metatypical | 37.2 | 62 | 32.1 | 32 |
| Donor 966 | 67 | Male | Superficial and nodular | 34.3 | 59 | 23.5 | 19 |
| Donor 1139 | 65 | Male | Superficial, nodular and infiltrative | 41.1 | 80 | 27.6 | 53 |
| Donor 1140 | 58 | Male | Superficial and nodular | 43.6 | 56 | 23.0 | 48 |
| Squamous Cell Carcinoma | |||||||
| Donor 962 | 84 | Male | In-situ | 30.1 | 53 | 29.0 | 53 |
| Donor 963 | 78 | Male | Invasive, well differentiated | 35.9 | 55 | 39.5 | 57 |
| Donor 1142 | 64 | Female | Invasive, well differentiated | 42.9 | 58 | 37.9 | 61 |
| Donor 1147 | 71 | Female | Invasive, well differentiated | 41.9 | 56 | 41.1 | 69 |
| Donor 1148 | 75 | Male | Invasive, well differentiated | 38.7 | 63 | 40.6 | 59 |
| Donor 1149 | 80 | Female | Invasive, well differentiated | 41.0 | 75 | 41.0 | 58 |
millions of unique fragments
WCE: whole-cell extract
Figure 1.
H3K27ac specific regions for SCC and BCC. (a) H3K27ac signal tracks for tumor-normal samples at a single locus (chr2:132426825–132427790) show cancer-specific alteration. (b) Volcano plots show the log2 fold change and the p-value for BCC and SCC samples. Red dots are the regions with significant p-value (<5%) and absolute log2 fold change larger than 1. (c) Venn diagram for differential peaks unique and shared in BCC and SCC samples. (d) Significant H3K27ac peaks identified by DESeq2 separates tumor-normal samples using the first two principal components.
Using DESeq2 (Love et al., 2014), we searched for genome-wide differential peaks (pvalue <5% and log2(fold-change)>1) to identify key regulatory elements for keratinocyte carcinogenesis. We identified numerous BCC- and SCC-specific differential peaks in H3K27ac, including peaks that could correspond to novel cancer-specific enhancers (562 for BCCs and 3,863 for SCCs) or lost wild-type enhancers (139 for BCC and 995 for SCC) (Figure 1b). When we compared SCCs to BCCs, we identified 66 peaks specifically enriched in SCC samples, and 26 peaks enriched in BCC samples (Supplementary Table 1).
Comparing the gained H3K27ac peaks between BCCs and SCC (Figure 1c), we found 180 unique BCC peaks, 3,481 unique SCC peaks, and 382 shared peaks. Comparing the lost peaks, we observed 865 unique SCC peaks, 9 unique BCC peaks, and 130 shared peaks (Supplementary Table 1).
We performed principal component analysis (PCA) before and after peak selection to assess how the selection strategies affects sample heterogeneity and grouping (Figure 1d). Using the top two principal components, we observed that the nine normal tissue samples formed a discrete cluster, whereas BCC and SCC samples formed their own admixed cluster. PCA plots demonstrate that samples were clustered by cancer subtype and not by the donor, suggesting shared regulatory mechanisms across donors (Supplementary Figure 2a). Analysis after differential peak selection revealed a clear separation of BCCs, SCCs, and normal samples (Supplementary Figure 2b). The boundary of BCC and SCC was observable; however, SCC samples were more scattered. The PCA differential peak and PCA analyses suggest that the two cancer types share features and that the separation from the normal samples is clear and reproducible.
Unique epigenetic landscapes for BCC and SCC correspond to different gene expression profiles and biological processes
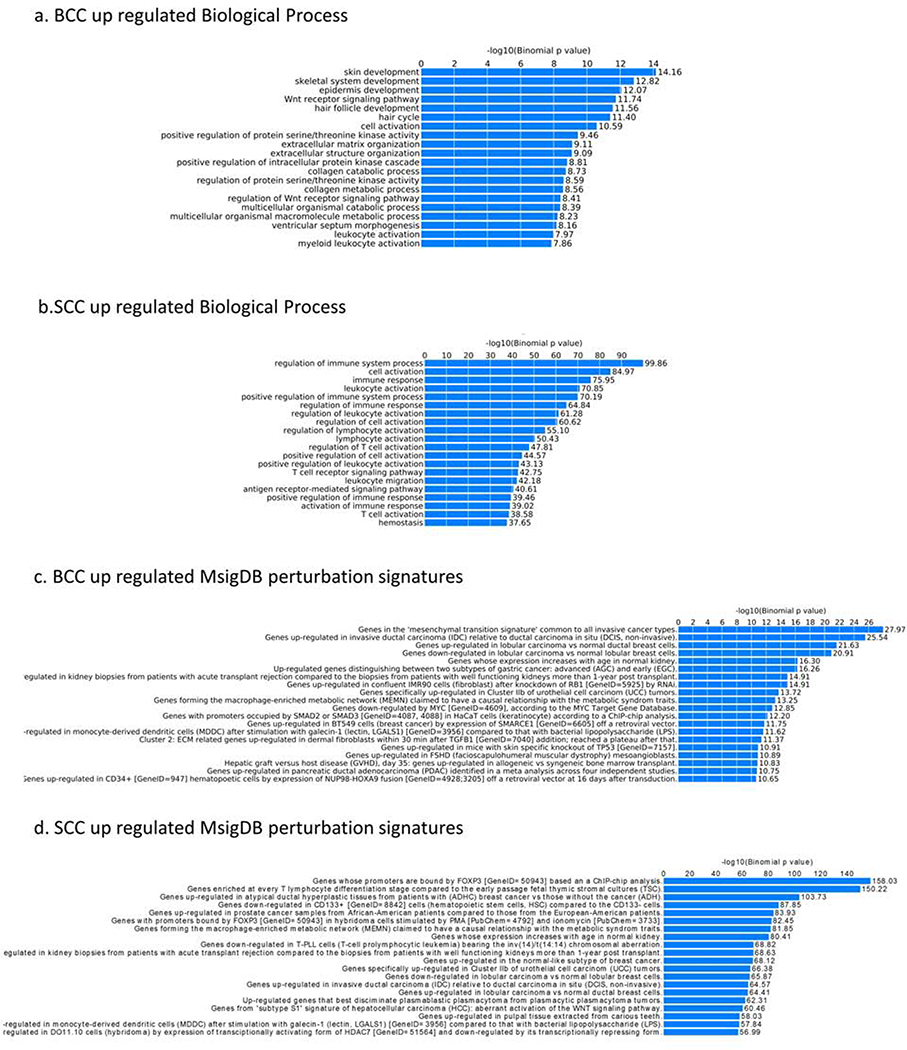
To investigate the effect of the cancer-specific gain or loss of function of H3K27ac on BCCs and SCCs, we used GREAT (McLean et al., 2010), a computational tool that helps determine the biological processes related to a set of non-coding genomic regions by analyzing the annotations of nearby genes. Using GREAT on the genomic intervals that distinguish tumor-normal H3K27ac levels, we inferred functionally important differences between tumor and normal samples, as illustrated in Figure 2, which also includesMsigDB perturbation signatures for BCC and SCC. Based on gene ontology annotations, we observed several enriched biological processes. For BCCs, the top 5 enriched pathways included skin development (p-value=1.0e-14), skeletal system development (p-value=1.0e-13), epidermis development (p-value=1.0e-12), Wnt receptor signaling pathway (p-value=1.0e-12) and hair follicle development (p-value=1.0e-12). Kinase activities were also enriched (Figure 2a).
Figure 2.
H3K27ac cancer-specific regions and GREAT analysis: (a) BCC up-regulated biological process, (b) SCC up-regulated biological process, (c) BCC up-regulated MsigDB perturbation signatures, and (d) SCC up-regulated MsigDB perturbation signatures
In contrast, the top 5 enriched biological processes in SCCs (Figure 2b) were regulation of the immune system, cell activation, immune response, leukocyte activation, and positive regulation of immune system process (p-values<10e-20). This suggests that SCC pathogenesis involves dysfunction in immune-regulation, a finding backed up by its increased incidence among immunosuppressed individuals (Bottomley et al., 2019, Clark et al., 2008), whereas BCC is related to the dysregulation in epidermal development pathways. Wnt signaling pathway was associated with both cancer types, as previously reported (Lang et al., 2019), stronger enrichment was observed in BCC than SCCs (Noubissi et al., 2018). In addition, SCCs lack a mechanism of apoptosis compared to normal samples (Supplementary Figure 3).
MsigDB enriched categories showed that BCCs and SCCs have similar areas of enrichment as other common cancer, including breast cancer, which implies potential shared functional genes involved in carcinogenesis (Figure 2c and 2d). MsigDB enrichment results also highlighted different transcription factors in BCCs and SCCs with BCCs gaining enhancers closer to genes with promoters bound by SMAD2 and SMAD3 (Figure 2c). In addition, MSigDB predicted promoter motifs in the oncogenes JUN, MSX, and MYC. In SCCs, the gained enhancers are closer to genes with promoters bound by FOXP3 (Figure 2d). MsigDB also uncovered several enriched motifs in promoter regions, including ETS1 and ETV4.
Different transcription factors and pervasive transcription regulation may mediate distinct BCC and SCC expression profiles
To understand the potential regulatory role of the altered H3K27ac peaks, we systematically explored the correlation between H3K27ac peaks and the RNA expressions of putative target genes. We used the gene expression data (GSE125285) from a recent publication (Wan et al., 2019), where BCC and SCC samples were profiled by RNA-seq. Using GREAT to identify putative target genes of the H3K27ac peaks, we observed elevated expression level of the genes near SCC and BCC up-regulated peaks and decreased expression of genes near SCC and BCC down-regulated peaks in cancer samples as compared to expression of genes near non-significant peaks (p-value>5% or |log2(fold-change)|<1) (Supplementary Figure 4). The overlap and the full list of the genes passing these filters are displayed in Supplementary Figure 5 and reported in Supplementary Table 2.
We further observed this trend quantitatively by calculating the correlation between the log2 fold change of H3K27ac peaks and the expression of their potential target genes (Supplementary Figure 6). The correlation improved by narrowing down to the regulatory peaks and genes associated with immune response and skin development GO terms demonstrating the importance of the uncovered H3K27ac cancer-specific gain or loss in these pathways.
To investigate the potential transcription factors (TFs) that mediate the cancer-specific gain or loss of H3K27ac in keratinocyte carcinoma, we performed an unbiased motif analyses using Homer and Haystack. Haystack calculates the enrichment of known and annotated regions based on available TFs databases, whereas Homer is a powerful tool for de-novo motif discovery.
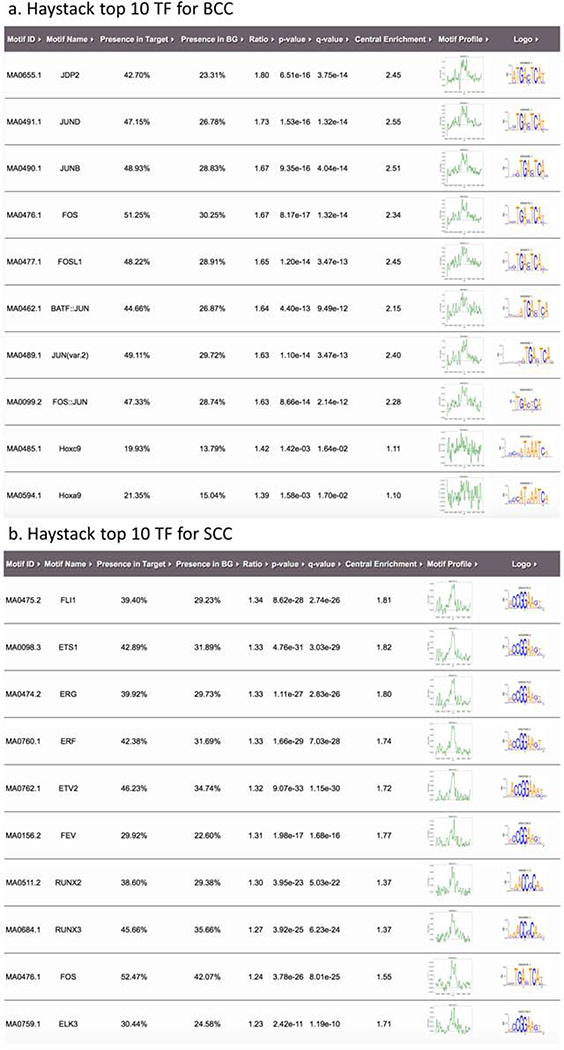
Using Haystack, we inferred transcription factors that are enriched in gained putative enhancers. For BCCs, we inferred factors from the JUN family and its heterodimers (JUNB, JUND, BATF-JUN, FOS-JUN), as well as JDP2, FOS, and HOX (Figure 3a). Using recently published gene expression data (Wan et al., 2019), we confirmed that JDP2 from the JUN family (also the most enriched BCC-specific factor in Haystack analysis) was significantly up-regulated in BCCs and down-regulated in SCC (Supplementary Figure 7a). All members of the SMAD family were up-regulated in BCCs, although the difference did not reach statistical significance (Supplementary Figure 7b). For SCCs, we observed enrichment of FLI1, ETS1, ERG, ERF, ETV2, and RUNX. FOS factors are enriched for regions gained in both BCC and SCC (Figure 3b). However, no differential expression patterns were observed for these genes in BCCs and SCCs (Wan et al., 2019).
Figure 3.
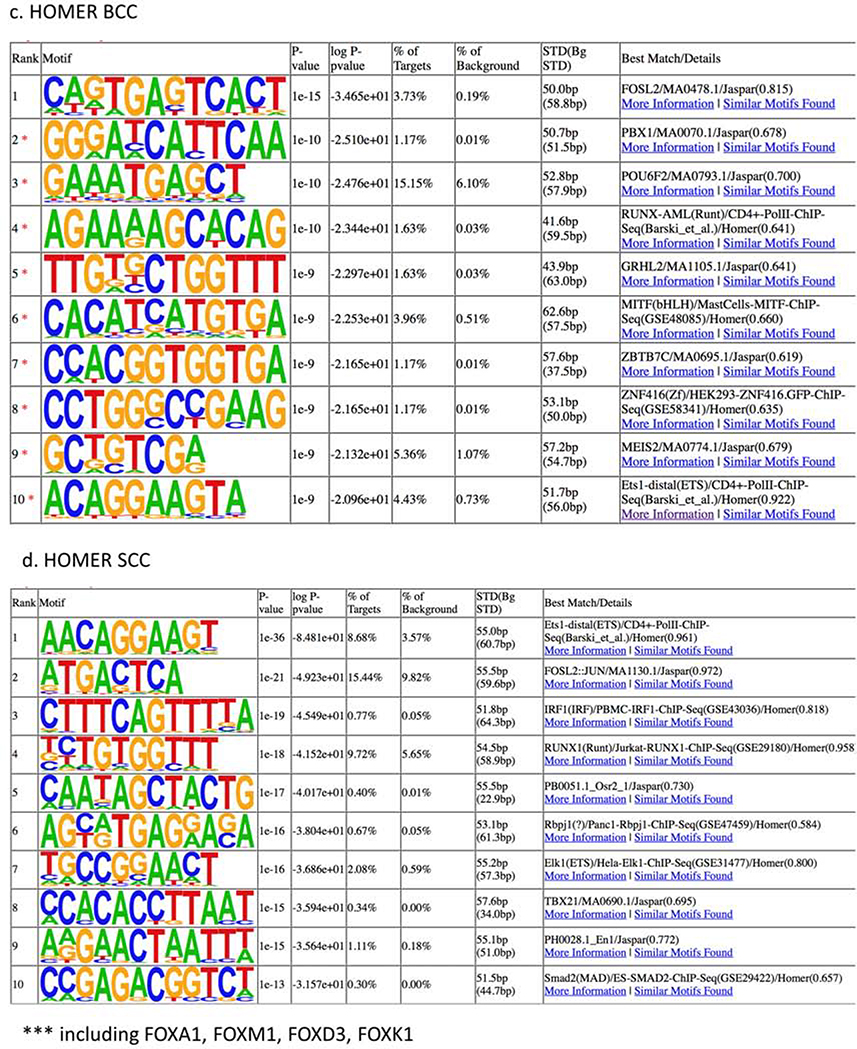
Putative transcription factors (TFs) located at regulatory elements defined by H3K27ac specific peaks in BCC and SCC samples from Haystack and Homer analyses: (a) Top 10 TFs for BCC from Haystack analyses, (b) Top 10 TFs for SCC from Haystack analyses, (c) Top 10 TFs in BCC from Homer analyses, and (d) Top 10 TFs in SCC from Homer analyses.
Homer analysis revealed FOSL2 as a top regulated factor for BCC specific regions (Figure 3c); while for the SCC regions, we found ETS and RUNX, two factors also observed by the Haystack analysis (Figure 3d). When contrasting SCC and BCC regions, we discovered REL and NF-κB as SCC-specific enhancers, again implicating immune response pathways in SCC pathogenesis (Supplementary Figure 8). NFKB expression was not significantly changed in BCC or SCC (Supplementary Figure 7c).
Homer analysis on H3K27ac lost peaks showed 15 enriched transcription factors in SCCs (Supplementary Figures 9a) and 3 enriched motifs in BCCs (Supplementary Figures 9b). Interestingly, in SCCs, enrichment was noted in the RAR/RXR motif, which plays a key role in recruitment of chromatin regulators (Wang et. al., 2017) and has been associated with SCC pathogenesis (Crowe and Shuler, 1998).
Prioritizing regulatory loci by integrating information from differential enhancer signals and transcription factors
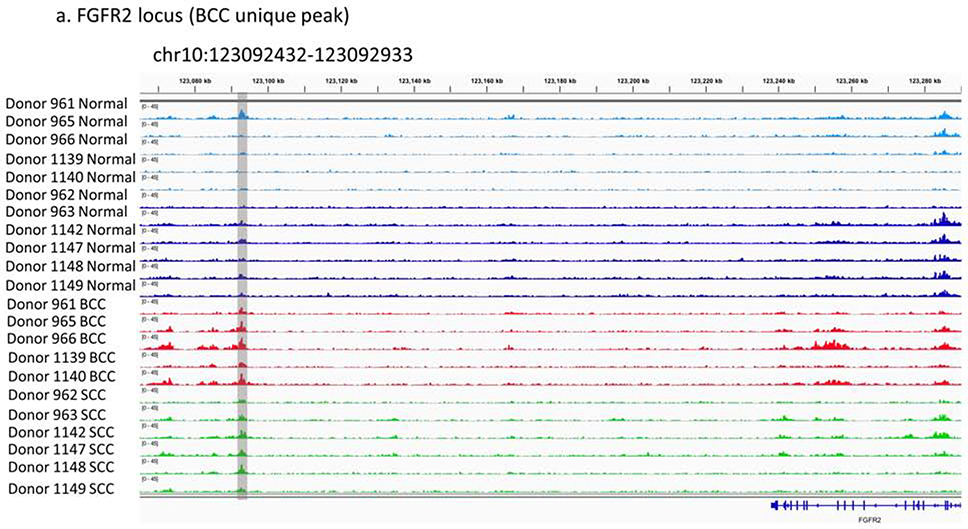
To illustrate the utility of our unbiased and genome wide characterization of H3k27ac gain and loss in BCC and SCC, we prioritized three loci based on enriched functional annotations from the GREAT analysis. In BCC, FGFR2 is an important gene in both hair follicle development (GO: 0001942) and skin development (GO:0043588) (Czyz, 2019). A proximal H3K27ac peak (1kb downstream of FGFR2) was enriched in BCCs (Figure 4a), suggesting that these differentially active enhancers are related to dysfunctional epidermal developmental. Expression of FGFR2 has also been shown to be significantly up-regulated in BCCs (Supplementary Figure 7d) (Wan et al., 2019).
Figure 4.
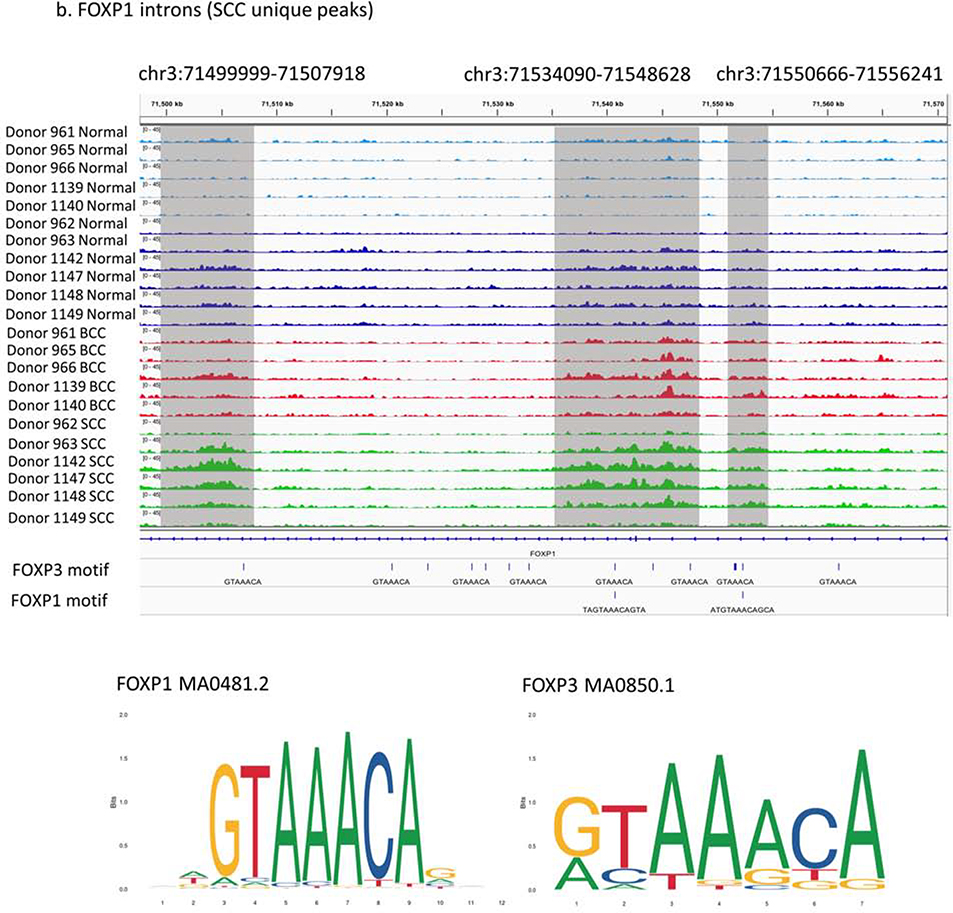
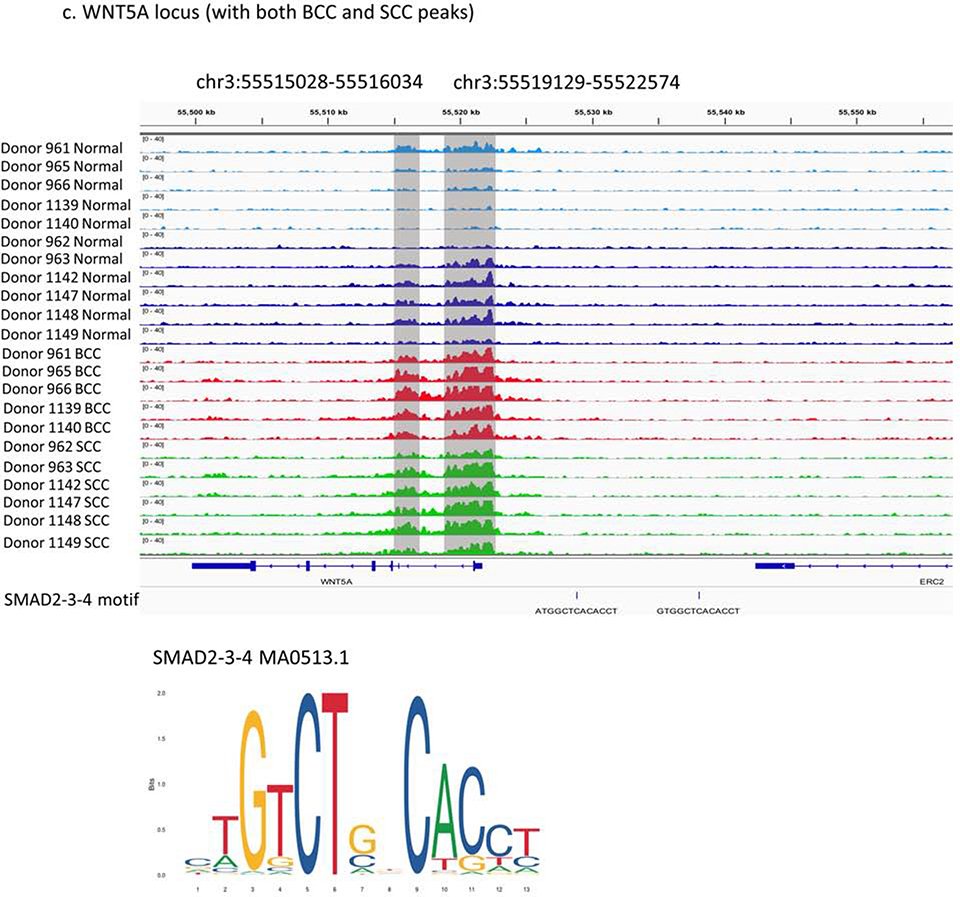
Three prioritized regions of differential regulation in KC samples: (a) BCC unique peak in FGFR2 locus (chr10:123092432–123092933), (b) SCC unique peaks in FOXP1 introns (chr3:71499999–71507918, chr3:71534090–71548628, chr3:71550666–71556241) and overlap with putative FOXP1/3 binding sites, and (c) both BCC and SCC specific peaks in WNT5A locus (chr3:55515028–55516034, chr3:55519129–55522574) and overlap with putative SMAD binding sites.
In SCCs, FOXP1, a member of the FOXP family, is involved in the regulation of immune system processes (GO:0002682). Three SCC-specific peaks are enriched in one FOXP1 intron (Figure 4b), indicating a possible intronic enhancer can modulate the FOXP1 function. FOXP3 is a transcription factor identified in our GREAT analysis, which indicates that the FOXP family could play important roles in SCC development. Expression data suggest that FOXP1 (and not FOXP3) has a self-regulatory mechanism that is potentially associated with SCCs (Supplementary Figure 10).
WNT5A, a gene involved in both regulation of immune system processes and Wnt signaling pathways, is a shared feature of both tumor subtypes and has been reported to be up-regulated in KC (Lang et al., 2019). Other Wnt members, including WNT2 and WNT2B, also have differential enhancer signals. We detected two H3K27ac cancer-specific peaks in both BCCs and SCCs in the WNT5A promoter and the first intron (Figure 4c). Also, there are two putative SMAD binding sites within 20kb region upstream WNT5A, which is consistent with our motif analysis. Expression data show that WNT5A is significantly up-regulated in both BCCs and SCCs (Supplementary Figure 7e) (Wan et al., 2019). Our findings highlighting the gain of cancer-specific enhancers suggests that the Wnt signaling may be a shared pathway in keratinocyte carcinogenesis. Importantly, our H3k27ac differential map will allow other researchers to perform further detailed analyses with other genes.
DISCUSSION
Using chromatin profiling for H3K27ac in KC matched tumor-normal samples, we uncovered putative novel enhancers that are specific to BCCs and SCCs and shared across different individuals. Biologic processes, including skin, skeletal system, epidermis, and hair follicle development, as well as the Wnt signaling pathway are enriched in BCC. In contrast, the regulation of immune system processes, immune response, and cell activation are enriched in SCCs. Our findings uncover unique and shared epigenetic alterations that may contribute to the pathogenesis of BCC and SCC. Epigenetic alterations hold promise for the development of robust biomarkers for the detection, monitoring, and prognosis of KC patients.
Given that epigenetic, as well as genetic, abnormalities are important in malignant transformation; it is critical to understand shared and unique features of the epigenetic landscape of KCs. Epigenetic alternations in tumor suppressor genes such as p53, p16[INK4a], and p14[ARF] and transcription factor such as FOXE1 were have been associated with SCC (Brown et al., 2004, Murao et al., 2006, Venza et al., 2010). Epigenetic changes in Sonic Hedgehog and Wnt pathway have also been reported in BCC (Brinkhuizen et al., 2012, Goldberg et al., 2006). Our findings expand upon previous reports of the association between epigenetic changes and carcinogenesis of KC by examining genome-wide histone modifications in BCC and SCC.
Using the enriched regions as a guide, we uncovered transcriptional regulators, signaling pathways, and biological processes that may mediate the malignant transformation of BCC and SCC. We identified FOXP as a potential key transcription factor family for SCC. FOXP1 is a gene that encodes a transcription factor involved in maintaining quiescence in hair follicle stem cells (Leishman et al., 2013). Loss of FOXP1 in keratinocytes results in stem cell activation, whereas overexpression prevents cell proliferation by promoting cell cycle arrest (Leishman et al., 2013). FOXP3, also known as scurfin, is a transcription factor involved in regulatory T (Treg) cell function. FOXP3 mutations that alter expression can lead to a lack of Treg (Roncarolo and Gregori, 2008). Germline mutations in FOXP3 cause immune dysregulation, polyendocrinopathy, enteropathy, and X-linked syndrome, which is a fatal autoimmune disease (Roncarolo and Gregori, 2008). Intense FOXP3 + Treg cell infiltration has been associated with high-grade, aggressive cSCC (Azzimonti et al., 2015). Thus, a proposed mechanism of action for alterations in FOXP1/FOXP3 expression in SCC pathogenesis is through its impact on Treg function, which can lead to immune dysregulation and allow SCC to develop in the setting of immune tolerance. The clinical impact of this pathway for SCC carcinogenesis lies in the ability to modulate FOXP3 expression and Treg cell function by targeting newly discovered regulatory nodes that can potentially lead to the development of novel immunotherapies (Lu et al., 2017).
The Wnt genes express signaling molecules that are components of a group of signal transduction pathways (Kretzschmar and Clevers, 2017), which regulate various cell functions including cell growth, proliferation, differentiation, apoptosis, migration, and angiogenesis (NG et al., 2016, Noubissi et al., 2018). Aberrant activation of the Wnt signaling pathway is involved in tumor initiation, progression, and invasion, and maintaining cancer stem cells (Lang et al., 2019). Wnt signaling plays a role in the development of epidermal stem cells (Kretzschmar and Clevers, 2017), the proliferation of keratinocyte proliferation (Teh et al., 2007), and in homeostasis and regeneration of the skin (Lang et al., 2019). Activating mutations of the Wnt signaling has been implicated in the pathogenesis of BCC and SCC, as shown by overexpression of Wnt proteins (Lang et al., 2019, Noubissi et al., 2018, Salto-Tellez et al., 2006, Youssef et al., 2012). In particular, the expression of mediators in the Wnt signaling pathway such as WNT1, 2, 5A, 11, 13, and 16 promotes the progression of BCC (Lang et al., 2019). Our findings suggested that the Wnt signaling pathway is a shared pathway in KC carcinogenesis.
Several limitations should be considered when interpreting the results. Despite our small sample size, our chromatin profiling identified clear cancer-specific alterations in the epigenome, which are shared across KCs as well as distinct BCC and SCC epigenetic alterations. Although we did not have gene expression profiling data from our patient samples, we incorporated recently published BCC and SCC gene expression data in our analyses to distinguish important regulators that may share binding sequences. Finally, although all study samples were procured by a Mohs surgeon with particular attention paid to removing tumor-normal samples at the dermal-epidermal junction to ensure that predominantly keratinocyte-derived cells were harvested, the samples may have contained a mixture of cells, including immune infiltrates, which may have contributed to the chromatin profiles. However, examination of the protein expression level of these genes using the Human Protein Atlas (http://www.proteinatlas.org)(Uhlen et al., 2017) suggests that our observed findings are more likely to reflect keratinocyte rather than inflammatory cell profiling. Future studies using single-cell profiling to assess tumor composition can address this limitation. The selection of tumor and adjacent normal paired samples allows for the elimination of interpatient variability as a potential confounding variable.
Our findings suggest that FGFR2 enhancers are involved in BCC carcinogenesis, whereas epigenetic regulators of FOXP1/3 are involved in SCC carcinogenesis, and WNT5A promoters are involved in both subtypes. This highlights unique and shared epigenetic alterations in histone modifications and potential regulators for BCCs and SCCs that likely impact divergent pathways in keratinocyte oncogenesis. Future studies should not only aim to replicate these findings but also to perform ChIP-seq profiling for the transcription factors we have uncovered in this study to validate their binding activity. Furthermore, gene expression profiling can help decipher which expression programs are responsible for the malignant transformation and to uncover their functional mechanisms. Ultimately, multi-omic profiling of epigenomic alterations could contribute to the development of novel therapies.
METHODS
Study population
We enrolled 11 patients with KCs (5 with BCCs and 6 with SCCs) at the Massachusetts General Hospital who were undergoing Mohs surgery for the resection of their tumors. Written informed consent was obtained preoperatively by study staff from each patient, which included the donation of discarded tumor tissue and normal skin removed in the reconstruction of the surgical defect (tumor/normal pairs). The epidermis from each sample was carefully surgically dissected at the level of the dermal-epidermal junction by the study PI and Mohs surgeon (M.A.) and subsequently snap-frozen. The institutional review board of Partners Healthcare approved the study.
ChIP-seq of Keratinocyte Carcinoma
Tumor/normal pairs were snap-frozen in liquid N2, then pulverized using a Covaris Cryoprep. Tissues remained frozen until they were cross-linked (20’ at RT, 1% formaldehyde), quenched with 2.5M glycine, and washed 2x in PBS. Fixed cells were solubilized using a 2 step lysis protocol (cytoplasm, then nucleus), sonicated (Branson Sonifier), and immunoprecipitated with antibodies to H3K27ac (active enhancers). Immunoprecipitated DNA was recovered and prepared for DNA sequencing, along with antibody-free control libraries. Libraries were made using eight ng ChIP DNA per library and were prepared using the KAPA Hyper prep kits. Library quality was then assessed by use of an Agilent 2100 to infer fragment size distribution, and by use of a Qubit to infer DNA concentration. Libraries were sequenced on an Illumina HiSeq2500, using 76 cycle, single end sequencing. DNA sequences were aligned to the human genome scaffold. Maps reflecting different chromatin modifications in normal keratinocytes and KCs derived from the same patient were integrated to derive a comprehensive set of sequence elements in normal human keratinocytes, annotated by their predicted functions and cell type-specificities, as well as in two different kinds of keratinocyte-derived carcinomas.
Differentially enhancer definition
Homer (histone mode) was used to segment H3K27ac ChIP-seq BAM files to identify candidate active enhancers. Peak calling was achieved using Homer findpeaks-style histone. Deeptools (Ramírez et al., 2016) was used to quantify the signal strength under each peak with the setting “--normalizeUsing RPKM” to normalize each sample toward “Reads Per Kilobase per Million mapped reads (RPKM).” Using DESeq2 (Love et al., 2014) we compared cancer to normal samples and searched for differential peaks genome-wide (corrected p-value<5% and |log2(fold-change)|>1).
Dimensionality reduction and visualization
For each sample, we obtained a vector of signal intensity at all identified H3K27ac enriched peaks. We applied sklearn python package to perform the principal component analysis (PCA). We plotted samples using the largest three components from PCA to verify the separation of sample space.
Gene set enrichment analysis
For enriched BCC and SCC specific H3K27ac peaks, we applied GREAT (Genomic Regions Enrichment of Annotations Tool, v3.0.0) (McLean et al., 2010), and used 5kb upstream and 1kb downstream of each gene as the regulatory domain to identify enriched gene ontology terms (i.e., biological processes), and MsigDB functions.
Transcription factor motif analysis
Haystack (Pinello et al., 2018) and Homer (Heinz et al., 2010) are complementary tools used for transcription factor motif analysis. Haystack is a bioinformatics pipeline that identifies hotspots of epigenetic variability in transcription factors. We used H3K27ac peaks with a corrected p-value<5% and log2(fold-change) >1 to capture cancer-specific enhancers regions and used peaks regions with log2(fold-change)<0.1 as background in order to avoid recovering general factors shared with ubiquitous peaks. Homer is a motif discovery tool that works by inspecting enriched motifs, and we used findMotifs.pl in the same set of H3K27ac regions to obtain motif lists.
Supplementary Material
Acknowledgments
Funding/Support: This work was supported by the National Institute of Arthritis and Musculoskeletal and Skin Diseases (K24 AR069760 to MA), the National Cancer Institute (R01CA231264 to MA), the National Human Genome Research Institute ((R00HG008399 and R35HG010717 to LP), and the National Human Genome Research Institute (5UM1HG009390 to BEB).
CONFLICT OF INTEREST
Dr. Asgari has research funding from Pfizer Inc to her institution. Dr. Bernstein declares outside interests in Fulcrum Therapeutics, 1CellBio, HiFiBio, Arsenal Biosciences, Cell Signaling Technologies, BioMillenia and Nohla Therapeutics. The remaining authors state no conflict of interest.
Footnotes
Publisher's Disclaimer: This is a PDF file of an unedited manuscript that has been accepted for publication. As a service to our customers we are providing this early version of the manuscript. The manuscript will undergo copyediting, typesetting, and review of the resulting proof before it is published in its final form. Please note that during the production process errors may be discovered which could affect the content, and all legal disclaimers that apply to the journal pertain.
DATA AVAILABILITY
The accession identifiers of datasets generated and analyzed for this study can be found at the URLs supplied in Supplementary Table 3, hosted by the NHGRI Encode Data Coordination Center (https://www.encodeproject.org/) at Stanford University. The characterized BCC and SCC cancer-specific H3K27ac peaks described in this paper are summarized in Supplementary Table 1 (Excel file).
REFERENCES
- Asgari MM, Wang W, Ioannidis NM, Itnyre J, Hoffmann T, Jorgenson E, et al. Identification of Susceptibility Loci for Cutaneous Squamous Cell Carcinoma. J Invest Dermatol 2016;136(5):930–7. [DOI] [PMC free article] [PubMed] [Google Scholar]
- Azzimonti B, Zavattaro E, Provasi M, Vidali M, Conca A, Catalano E, et al. Intense Foxp3+ CD25+ regulatory T-cell infiltration is associated with high-grade cutaneous squamous cell carcinoma and counterbalanced by CD8+/Foxp3+ CD25+ ratio. Br J Dermatol 2015;172(1):64–73. [DOI] [PubMed] [Google Scholar]
- Bottomley MJ, Thomson J, Harwood C, Leigh I. The Role of the Immune System in Cutaneous Squamous Cell Carcinoma. Int J Mol Sci 2019;20(8). [DOI] [PMC free article] [PubMed] [Google Scholar]
- Brinkhuizen T, van den Hurk K, Winnepenninckx VJL, de Hoon JP, van Marion AM, Veeck J, et al. Epigenetic Changes in Basal Cell Carcinoma Affect SHH and WNT Signaling Components. PLoS ONE 2012;7(12). [DOI] [PMC free article] [PubMed] [Google Scholar]
- Brown VL, Harwood CA, Crook T, Cronin JG, Kelsell DR, Proby CM. p16INK4a and p14ARF tumor suppressor genes are commonly inactivated in cutaneous squamous cell carcinoma. Journal of Investigative Dermatology 2004;122(5):1284–92. [DOI] [PubMed] [Google Scholar]
- Chahal HS, Wu W, Ransohoff KJ, Yang L, Hedlin H, Desai M, et al. Genome-wide association study identifies 14 novel risk alleles associated with basal cell carcinoma. Nat Commun 2016;7:12510. [DOI] [PMC free article] [PubMed] [Google Scholar]
- Clark RA, Huang SJ, Murphy GF, Mollet IG, Hijnen D, Muthukuru M, et al. Human squamous cell carcinomas evade the immune response by down-regulation of vascular E-selectin and recruitment of regulatory T cells. J Exp Med 2008;205(10):2221–34. [DOI] [PMC free article] [PubMed] [Google Scholar]
- Crowe DL, Shuler CF. Increased cdc2 and cdk2 kinase activity by retinoid X receptor gamma-mediated transcriptional down-regulation of the cyclin-dependent kinase inhibitor p21Cip1/WAF1 correlates with terminal differentiation of squamous cell carcinoma lines. Cell Growth Differ. 1998;9(8):619–27. [PubMed] [Google Scholar]
- Czyz M Fibroblast Growth Factor Receptor Signaling in Skin Cancers. Cells 2019;8(6):540. [DOI] [PMC free article] [PubMed] [Google Scholar]
- Davis CA, Hitz BC, Sloan CA, Chan ET, Davidson JM, Gabdank I, et al. The Encyclopedia of DNA elements (ENCODE): data portal update. Nucleic Acids Res 2018;46(D1):D794–D801. [DOI] [PMC free article] [PubMed] [Google Scholar]
- Dunham I, Kundaje A, Aldred SF, Collins PJ, Davis CA, Doyle F, et al. An integrated encyclopedia of DNA elements in the human genome. Nature 2012;489(7414):57–74. [DOI] [PMC free article] [PubMed] [Google Scholar]
- Goldberg M, Rummelt C, Laerm A, Helmbold P, Holbach LM, Ballhausen WG. Epigenetic silencing contributes to frequent loss of the fragile histidine triad tumour suppressor in basal cell carcinomas. Br J Dermatol 2006;155(6):1154–8. [DOI] [PubMed] [Google Scholar]
- Heinz S, Benner C, Spann N, Bertolino E, Lin YC, Laslo P, et al. Simple combinations of lineage-determining transcription factors prime cis-regulatory elements required for macrophage and B cell identities. Mol Cell 2010;38(4):576–89. [DOI] [PMC free article] [PubMed] [Google Scholar]
- Kretzschmar K, Clevers H. Wnt/beta-catenin signaling in adult mammalian epithelial stem cells. Dev Biol 2017;428(2):273–82. [DOI] [PubMed] [Google Scholar]
- Lang CMR, Chan CK, Veltri A, Lien WH. Wnt Signaling Pathways in Keratinocyte Carcinomas. Cancers (Basel) 2019;11(9). [DOI] [PMC free article] [PubMed] [Google Scholar]
- Leishman E, Howard JM, Garcia GE, Miao Q, Ku AT, Dekker JD, et al. Foxp1 maintains hair follicle stem cell quiescence through regulation of Fgf18. Development 2013;140(18):3809–18. [DOI] [PMC free article] [PubMed] [Google Scholar]
- Liyanage UE, Law MH, Han X, An J, Ong JS, Gharahkhani P, et al. Combined analysis of keratinocyte cancers identifies novel genome-wide loci. Human Molecular Genetics 2019;28(18):3148–60. [DOI] [PMC free article] [PubMed] [Google Scholar]
- Love MI, Huber W, Anders S. Moderated estimation of fold change and dispersion for RNA-seq data with DESeq2. Genome Biol 2014;15(12):550. [DOI] [PMC free article] [PubMed] [Google Scholar]
- Lu L, Barbi J, Pan F. The regulation of immune tolerance by FOXP3. Nat Rev Immunol 2017;17(11):703–17. [DOI] [PMC free article] [PubMed] [Google Scholar]
- McLean CY, Bristor D, Hiller M, Clarke SL, Schaar BT, Lowe CB, et al. GREAT improves functional interpretation of cis-regulatory regions. Nat Biotechnol 2010;28(5):495–501. [DOI] [PMC free article] [PubMed] [Google Scholar]
- Murao K, Kubo Y, Ohtani N, Hara E, Arase S. Epigenetic abnormalities in cutaneous squamous cell carcinomas: frequent inactivation of the RB1/p16 and p53 pathways. Br J Dermatol 2006;155(5):999–1005. [DOI] [PubMed] [Google Scholar]
- NG DOC, Sakamoto LH, Pogue R, C DOCM, Passos SK, Felipe MS, et al. Altered Expression of PRKX, WNT3 and WNT16 in Human Nodular Basal Cell Carcinoma. Anticancer Res 2016;36(9):4545–51. [DOI] [PubMed] [Google Scholar]
- Noubissi FK, Yedjou CG, Spiegelman VS, Tchounwou PB. Cross-Talk between Wnt and Hh Signaling Pathways in the Pathology of Basal Cell Carcinoma. Int J Environ Res Public Health 2018;15(7). [DOI] [PMC free article] [PubMed] [Google Scholar]
- Pinello L, Farouni R, Yuan GC. Haystack: systematic analysis of the variation of epigenetic states and cell-type specific regulatory elements. Bioinformatics 2018;34(11):1930–3. [DOI] [PMC free article] [PubMed] [Google Scholar]
- Ramírez F, Ryan DP, Grüning B, Bhardwaj V, Kilpert F, Richter AS, et al. deepTools2: a next generation web server for deep-sequencing data analysis. Nucleic acids research 2016;44(W1):W160–W5. [DOI] [PMC free article] [PubMed] [Google Scholar]
- Roberts MR, Asgari MM, Toland AE. Genome-wide association studies and polygenic risk scores for skin cancer: clinically useful yet? Br J Dermatol 2019;181(6):1146–55. [DOI] [PMC free article] [PubMed] [Google Scholar]
- Roncarolo MG, Gregori S. Is FOXP3 a bona fide marker for human regulatory T cells? Eur J Immunol 2008;38(4):925–7. [DOI] [PubMed] [Google Scholar]
- Salto-Tellez M, Peh BK, Ito K, Tan SH, Chong PY, Han HC, et al. RUNX3 protein is overexpressed in human basal cell carcinomas. Oncogene 2006;25(58):7646–9. [DOI] [PubMed] [Google Scholar]
- Sarin KY, Lin Y, Daneshjou R, Ziyatdinov A, Thorleifsson G, Rubin A, et al. Genome-wide meta-analysis identifies eight new susceptibility loci for cutaneous squamous cell carcinoma. Nat Commun 2020;11(1):820. [DOI] [PMC free article] [PubMed] [Google Scholar]
- Teh MT, Blaydon D, Ghali LR, Edmunds S, Pantazi E, Barnes MR, et al. Role for WNT16B in human epidermal keratinocyte proliferation and differentiation. Journal of Cell Science 2007;120(2):330–9. [DOI] [PubMed] [Google Scholar]
- Uhlen M, Zhang C, Lee S, Sjostedt E, Fagerberg L, Bidkhori G, et al. A pathology atlas of the human cancer transcriptome. Science 2017;357(6352). [DOI] [PubMed] [Google Scholar]
- Venza I, Visalli M, Tripodo B, De Grazia G, Loddo S, Teti D, et al. FOXE1 is a target for aberrant methylation in cutaneous squamous cell carcinoma. Br J Dermatol 2010;162(5):1093–7. [DOI] [PubMed] [Google Scholar]
- Wan J, Dai H, Zhang X, Liu S, Lin Y, Somani A-K, et al. Distinct transcriptomic landscapes of cutaneous basal cell carcinomas and squamous cell carcinomas. Genes & Diseases 2019. [DOI] [PMC free article] [PubMed] [Google Scholar]
- Wang SP, Tang Z, Chen CW, Shimada M, Koche RP, Wang LH, Nakadai T, Chramiec A, Krivtsov AV, Armstrong SA, Roeder RG. A UTX-MLL4-p300 Transcriptional Regulatory Network Coordinately Shapes Active Enhancer Landscapes for Eliciting Transcription. Mol Cell. 2017;67(2):308–321. [DOI] [PMC free article] [PubMed] [Google Scholar]
- Youssef KK, Lapouge G, Bouvrée K, Rorive S, Brohée S, Appelstein O, et al. Adult interfollicular tumour-initiating cells are reprogrammed into an embryonic hair follicle progenitor-like fate during basal cell carcinoma initiation. Nature Cell Biology 2012;14(12):1282–94. [DOI] [PubMed] [Google Scholar]
- Zhao Z, Shilatifard A. Epigenetic modifications of histones in cancer. Genome Biol 2019;20(1):245. [DOI] [PMC free article] [PubMed] [Google Scholar]
Associated Data
This section collects any data citations, data availability statements, or supplementary materials included in this article.
Supplementary Materials
Data Availability Statement
The accession identifiers of datasets generated and analyzed for this study can be found at the URLs supplied in Supplementary Table 3, hosted by the NHGRI Encode Data Coordination Center (https://www.encodeproject.org/) at Stanford University. The characterized BCC and SCC cancer-specific H3K27ac peaks described in this paper are summarized in Supplementary Table 1 (Excel file).


