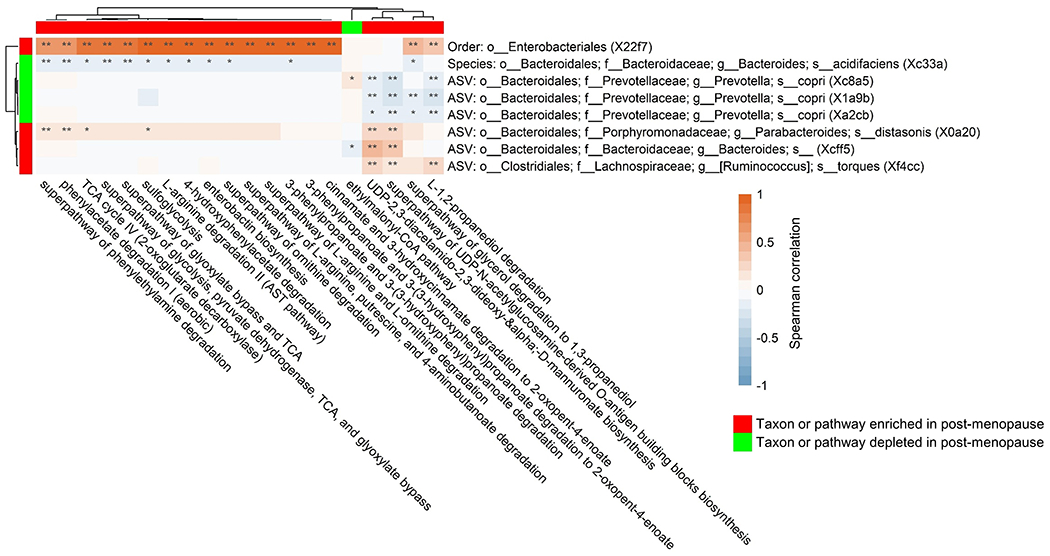
Figure 3. Correlations between taxa and functional pathways associated with menopause in women with HIV, the Women’s Interagency HIV Study.

Heatmap shows Spearman’s correlations between taxa associated with menopausal status in women with HIV, and functional pathways associated with menopausal status in women with HIV. Correlations were calculated in women with HIV, on relative abundance of taxa and functional pathways.
