

Abstract
The study aim was to examine the relationship between socioeconomic status and dietary behaviors through psychological and environmental mediators among African Americans with overweight or obesity. We conducted a cross-sectional study in 225 African American men and women. Data were analyzed using structural equation modeling with bootstrapping procedures. In the multiple mediation model, socioeconomic status had a significant indirect effect on dietary behaviors through psychological and environmental factors (β=−.27, p=.01, 95% confidence interval [CI]=−0.59 to −0.10), but it had no significant direct effect on dietary behaviors (β=.06, p=.70, 95% CI=−0.21 to 0.39). Socioeconomic status had significant direct effects on psychological (β=.52, p=.01, 95% CI=0.31 to 0.77) and environmental factors (β=−.40, p=.03, 95% CI=−0.53 to −0.25). Psychological (β=−.31, p=.02, 95% CI=−0.68 to −0.04) and environmental factors (β=.26, p=.01, 95% CI=0.04 to 0.47) also showed significant direct effects on dietary behaviors. Thus, psychological and environmental factors mediated the relationship between socioeconomic status and dietary behaviors in African Americans with overweight or obesity. Interventions that enhance psychological and environmental factors such as self-efficacy, perceived barriers to healthy eating, health perceptions, and physical and social environments may improve dietary behaviors among socioeconomically disadvantaged African Americans.
Keywords: socioeconomic status, psychological factors, environmental factors, dietary behaviors, multiple mediation model, African American
1. Introduction
Despite significant efforts, the overweight and obesity rates continue to increase in the United States. In particular, African Americans (AAs) have a higher obesity rate than other ethnic groups (An, 2014; Kumanyika, Whitt-Glover, & Haire-Joshu, 2014) and disproportionately suffer from obesity-related conditions, such as type 2 diabetes, heart disease, some types of cancer, and mental illnesses (McTigue et al., 2014; Whitt-Glover, Kumanyika, & Haire-Joshu, 2014). Although obesity disparities among AAs may be influenced by various factors, dietary behaviors are among the prominent modifiable factors of obesity-related conditions (Collection, 2016; Hiza, Casavale, Guenther, & Davis, 2013). Higher consumption of sweetened beverages and fast food, a high-fat diet, and lower intake of fresh fruits and vegetables have been reported among AAs compared with other racial/ethnic groups (Francis et al., 2009; Gibson & Neate, 2007).
Dietary behaviors, well-known lifestyle risk factors of obesity, are influenced by complex and multifactorial processes that include dynamic interaction at the individual, interpersonal, and environmental levels (Robinson, 2008)(Robinson, 2008). Socioeconomic status (SES), including household income, education level, or occupation status, is one of the individual factors influencing dietary behaviors (Vlismas, Stavrinos, & Panagiotakos, 2009). Socioeconomically disadvantaged groups have reported unhealthy dietary habits and food intake (Backholer et al., 2016; Kirkpatrick, Dodd, Reedy, & Krebs-Smith, 2012; Raffensperger et al., 2010; Vlismas et al., 2009). Previous studies reported inconsistent findings on the relationship between SES and dietary behaviors among AAs (Beydoun & Wang, 2008; Wilcox, Sharpe, Liese, Dunn, & Hutto, 2018). Although some studies have shown significant relationships between SES and dietary behaviors (Raffensperger et al. 2010; Wilcox et al. 2018), non-significant associations between SES and dietary behaviors have also been reported among AAs (Beydoun & Wang, 2008). The inconsistent findings may be partly due to the lack of understanding regarding the potential mediators in the relationship between SES and dietary behaviors. However, limited data are available on this relationship, in particular in AAs.
Psychological factors, such as self-efficacy, perceived barriers to healthy dietary behaviors, and health perception are important influencing factors in AAs’ dietary behaviors (Backholer et al., 2016; Franko, Cousineau, Rodgers, Roehrig, & Hoffman, 2013; Raffensperger et al., 2010; Yen, Shariff, Kandiah, & Taib, 2014). Psychological factors have also been shown to differ according to SES (Ball, Crawford, & Mishra, 2006b; Sugisawa, Nomura, & Tomonaga, 2015). For example, individuals with higher SES tended to have greater self-efficacy for healthy diet and lower perceived barriers to purchase and prepare healthy foods (Anne, Socio-economic, Turrell, & Kavanagh, 2006; Vlismas et al., 2009), while people with lower SES reported poorer health perceptions (Simsek, Doganay, Budak, & Ucku, 2013). These findings suggest that psychological factors may be a mediator in the relationship between SES and dietary behaviors.
A growing body of literature has shown that physical and social environments may influence an individual’s dietary behaviors. Physical environment, for example, limited access to healthy foods (e.g., food deserts) and a large number of available fast-food restaurants nearby can negatively affect an individual’s dietary behaviors (Kumanyika et al., 2014). To date, many studies have evaluated the influence of physical environments in dietary behaviors. Recent studies, however, have demonstrated that social environments such as social cohesion or supportive social networks may provide opportunities for adopting or maintaining healthy behaviors by promoting neighborhood safety and preventing deterioration of the physical environment (Carter, Dubois, Tremblay, Taljaard, & Jones, 2012; Halbert et al., 2014; Suglia et al., 2016).
Previous studies have shown positive associations between SES and physical environment; lower SES groups are more likely to live in neighborhoods with limited access to healthy food and more violence compared with high SES groups (Beaulac, Kristjansson, & Cummins, 2009; Larson, Story, & Nelson, 2009; Vlismas et al., 2009). However, in a study conducted in AAs, the direct effect of environmental factors on dietary behaviors was significant even after controlling for SES such as education and income (Morland, Wing, & Diez Roux, 2002). Thus, examining the effects of both physical and social environment on dietary behaviors, as well as their potential mediating effects on the relationship among SES, physical environment (e.g., neighborhood) and dietary behaviors are important for understanding the dietary behaviors of AAs.
To date, many studies on dietary behaviors have focused on examining its direct relationship with SES, self-efficacy, or physical environments. Examining these factors simultaneously using a mediation analysis can promote better understanding of the complex mechanism and guide the development of future lifestyle interventions to improve dietary behaviors, particularly among AAs at high risk of developing obesity and obesity-related conditions.
This study aimed to examine a model explaining the effect of SES on dietary behaviors through psychological and environmental mediators among AAs with overweight or obesity. Based on the findings of the aforementioned studies, we developed a hypothetical model; psychological and environmental factors may mediate the relationship between SES and dietary behaviors.
1.1. Hypothetical model
The social-ecological model serves as a framework to understand multiple factors that may influence the dietary behaviors of AAs at the individual, interpersonal, and environmental levels (Robinson, 2008). In the model, health behaviors are affected by interactions among individual factors and physical and social environments (Ishii, Shibata, & Oka, 2010; Sallis, Owen, & Fisher., 2015). Based on the social-ecological model and the current literature, we constructed a multiple mediation model as a hypothetical model, which included four latent variables and sixteen observed variables (see Figure 1). An exogenous and latent variable, SES, was assessed using three observed variables: education level, household income, and employment status. Psychological factors, another latent variable, were operationally defined as the individual’s perception, intention, and self-confidence affecting the dietary behavior, which consisted of three observed variables to assess these attributes: healthy eating self-efficacy, perceived barriers to healthy eating, and health perceptions (Lu, Samuels, & Huang, 2002; Watters & Satia, 2009). Physical and social environments were represented by neighborhood attributes related to health behaviors based on the social-ecological model (Denney, Kimbro, Heck, & Cubbin, 2017; Katrina Giskes et al., 2007; Mujahid et al., 2008; Suglia et al., 2016). They consisted of seven observed variables that assess the availability and accessibility of various resources related to health behaviors: aesthetic quality, walking environment, availability of healthy food, safety, social cohesion, and violence (Echeverria, Diez-Roux, & Link, 2004; Mujahid, Diez Roux, Morenoff, & Raghunathan, 2007). Dietary behavior was evaluated using four observed variables: percentage energy from fat, sweetened beverage, soda, and fast-food consumption.
Figure. 1.
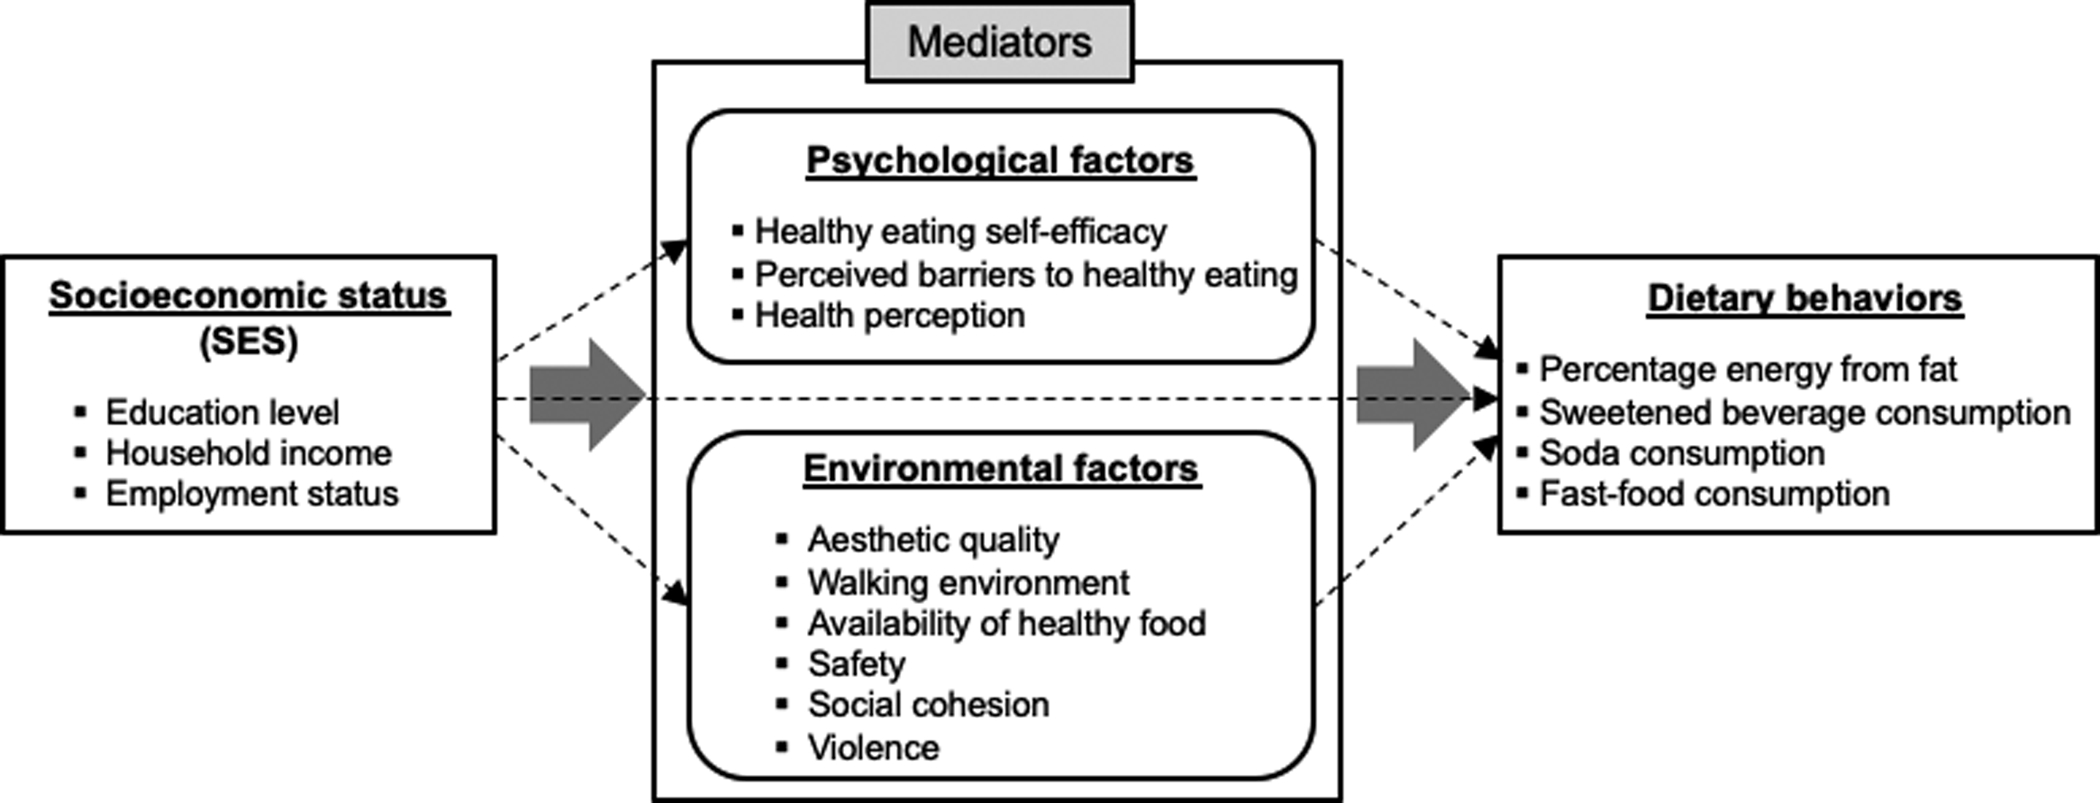
The hypothesized multiple mediation model
We hypothesized that psychological and environmental factors may have mediating effects on the relationship between SES and dietary behaviors, such that higher SES will be associated with better psychological and environmental status and dietary behaviors (direct relationship with SES), and that better psychological and environmental status will be associated with better dietary behaviors (indirect relationship with SES).
2. Methods
2.1. Design, sample, and procedures
The present study is a sub-study of a cross-sectional study that examined the roles of social networks in obesity-risk behaviors among adult AAs. Between May 2015 and June 2016, we recruited participants from the northeastern urban area via flyers posted at AA churches and the website of Yale University’s Clinical and Translational Science Awards Program. The inclusion criteria were (1) age > 21 years old; (2) body mass index (BMI) ≥ 25kg/m2; (3) self-identified as AAs or Black; and (4) able to read and speak in English. We excluded individuals with severe or terminal medical conditions (e.g., cancer or stroke) or self-reported active psychiatric thought disorder such as schizophrenia. Written informed consent was obtained from all participants. After the participants completed the anthropometric measurements and surveys, they received a $30 gift card. The study protocol was approved by the Yale University Institutional Review Board.
We conducted a power analysis to calculate the sample size, based on a close-fit root mean square error of approximation (RMSEA) (MacCallum, Browne, & Sugawara, 1996) for the structural equation model (SEM) with sixteen manifest variables and two indirect pathways. The sample size of 225 has a 91.5% power to reject a null hypothesis for not being close fit (RMSEA ≥ 0.05) when an alternative hypothesis for an RMSEA of < 0.01 is true (Hancock & Freeman, 2001; MacCallum et al., 1996). The power was calculated to reject a critical value in a chi-square distribution with a non-centrality parameter of 137.6, a degree of freedom of 96, and a significance level of .05. A total of 225 participants were included in the final analysis.
2.2. Measurements
2.2.1. Sociodemographic characteristics
We collected the following sociodemographic data: age, sex, race/ethnicity, marital status, education, household income, and employment status. Among these, the observed variables of SES included education, household income, and employment status.
2.2.2. Psychological factors
Psychological factors, a latent variable, consisted of three observed variables: healthy eating self-efficacy, perceived barriers to healthy eating, and health perception. Healthy eating self-efficacy was assessed by two items about self-confidence to eat less fat and eat more fruits and vegetables using a 5-point Likert scale (1=very little confidence to 5=a lot of confidence) (Satia, Galanko, & Siega-Riz, 2004). The total scores ranged from 2 to 10; a higher total score indicated greater self-efficacy for healthy eating. The Cronbach’s alpha for this study was .70. Perceived barriers to healthy eating were assessed using the following four items on a 5-point Likert scale (1=strongly disagree to 5=strongly agree): (1) can afford to purchase healthy foods and meals, (2) take the time and trouble to prepare healthy meals, (3) finds it easy to order healthy foods in restaurants, and (4) need more information on how to prepare healthy foods and meals (Satia et al., 2004). The two items, (2) and (4), were coded reversely to calculate the total score. Thus, the total scores ranged from 4 to 20, and a higher total score indicated lower perceived barriers to healthy eating. The Cronbach’s alpha for this study was .64. Health perception was assessed by asking the participants’ perceptions of overall health status, which was rated on a 5-point Likert scale (1=poor to 5=Excellent); a higher score represented better health perception.
2.2.3. Physical and social environmental factors
The physical and social environmental factors, a latent variable, comprised six observed variables and were measured using the Neighborhood Environment Scales (Mujahid et al., 2007), a validated self-report measure that comprised the following items: (1) aesthetic quality (5 items), (2) walking environment (7 items), (3) availability of healthy foods (3 items), (4) safety (3 items), (5) social cohesion (4 items), and (6) violence (4 items). A 4-point Likert scale (1=never, 4=often) was used for the violence subscale, and 5-point Likert scales (1=strongly agree, 5=strongly disagree) for the others. In these subscales, a lower score represented a better neighborhood environment. All subscales had excellent reliability, with Cronbach’s alpha ranging from .73 (walking environment) to .83 (violence) (Mujahid et al., 2007). In this study, the Cronbach’s alpha for each subscale ranged from .80 (aesthetic quality) to .92 (availability of healthy foods).
2.2.4. Dietary behaviors
Dietary behaviors included four observed variables related to eating practices and types of foods consumed. The percentage of energy from fat intake was assessed using the 13-item National Cancer Institute (NCI) Fat Screener (Thompson et al., 2007). Respondents indicated how often they consumed a variety of food products that are rich in fat over the past 12 months. Then, the scoring algorithm—using the values for the age-gender specific portion sizes and the regression coefficients developed by the NCI—was applied to estimate the mean daily fat intake. A higher score indicated a greater percentage of energy from fat. Sweetened beverages such as juices, sweetened teas, or lemonade, soda, and fast-food consumption were assessed using three items from the Brief Screener of Fast Foods and Beverages (Nelson & Lytle, 2009). All three items were rated from 1 (never or rarely) to 9 (three or more times per day); a higher score indicated more consumption of sweetened beverages, soda, or fast food.
2.3. Statistical analysis
Participants’ characteristics and study variables were summarized using descriptive statistics. The multicollinearity between observed variables was examined using Pearson’s correlation coefficients (< 0.70) and variance inflation factors (VIF) < 10 (Kim, 2010). Univariate and multivariate normality was tested using skewness (< |3|), kurtosis (< |7|), and the critical ratio of multivariate kurtosis (< 5.00) and met the criteria (Byrne, 2016; West, Finch, & Curran, 1995).
The hypothesized measurement model was validated using confirmatory factor analysis (CFA). Convergent validity was assessed by factor loadings, average variance extract (AVE; > 0.50), and constructive reliability (CR; > 0.70). The discriminant validity between latent variables was determined using the correlation coefficient and AVE (ɸ² < AVE) (Kim, 2010).
The hypothesized model was examined using an SEM with maximum likelihood estimation and the bootstrap procedure with 95% bias-corrected confidence intervals. The fit indices and criteria used to determine the goodness of fit and parsimony of the model were as follows: standardized chi-square (χ2/df) of < 2, goodness of fit index (GFI) of > .90, RMSEA of < .05, Turker-Lewis index (TLI) of > .90, and comparative fit index (CFI) of > .90 (Lomax & Schumacker, 2004). The relationship between the latent variables was examined by estimating the direct, indirect, and total effects. Since multiple mediators were included in the model, the phantom model approach was also used to estimate and compare specific indirect effects from each psychological and environmental factor independently (Cheung & Lau, 2008; Macho & Ledermann, 2011). A “specific” indirect effect refers to the effect of a predictor on the outcome intervened by one variable (MacKinnon, 2008). We first created the phantom variables (see p1, p2, p3, and p4 in Figure 2) for each variable implicated in specific indirect effects and then added the paths consistent with the specification of the paths constituting the specific indirect effect in the main model (SES→p1→p2, SES→p3→p4) (Figure 2). A phantom model, made up of all latent variables whose parameters were constrained, was added to the main model (Macho & Ledermann, 2011). Then, equality constraints (indicated as a, b, c, and d, in Figure 2) were imposed between the structural paths of the phantom model and the path coefficients implicated in the specific indirect effect in the parent model, such that each structural coefficient between the phantom variables was constrained to the value of the equivalent coefficient in the parent model. Bootstrapping was used to obtain the confidence intervals.
Figure. 2.
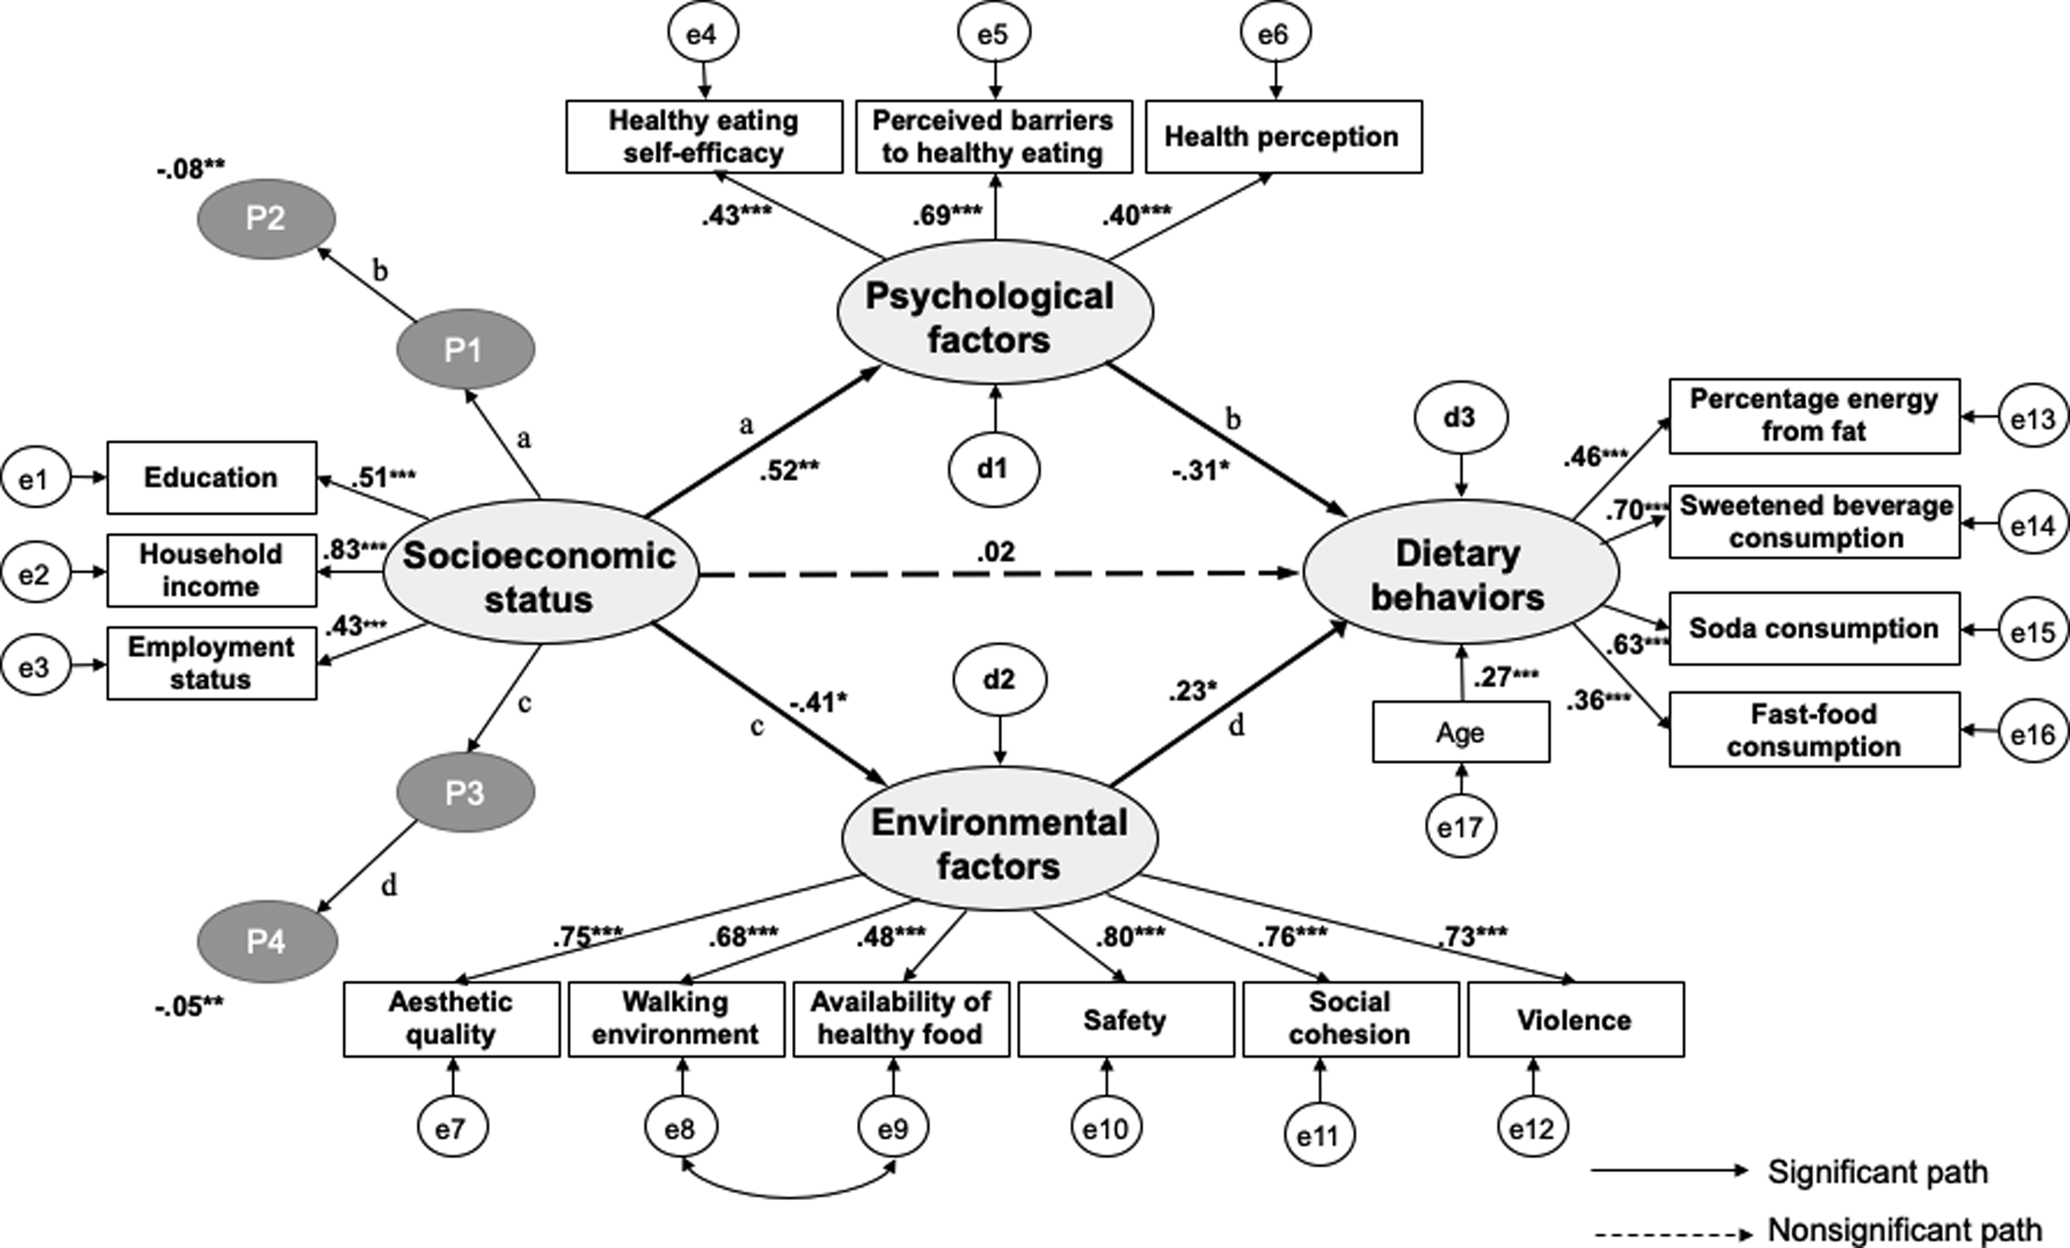
The path diagram of the multiple mediation model with controlling age. ***=p<.001; **=p<.01; *=p<.05; e, measurement error; d, construct error; p1, phantom variable of psychological factors; p2, phantom variable of diet behaviors; p3, phantom variable of environmental factors; p4, phantom variable of diet behaviors.
Also, to examine the potential effect of unmeasured confounders on model estimates (i.e., sociocultural factors), a series of sensitivity analyses were conducted using phantom variables with a fixed-parameter approach (Harring, McNeish, & Hancock, 2017; VanderWeele, 2016). Based on previous studies conducted in AAs (Brown, Houser, Mattei, Lichtenstein, & Folta, 2019; Satia-Abouta, Patterson, Neuhouser, & Elder, 2002), we hypothesized that the phantom variable of sociocultural factors such as cultural beliefs and norms has negative relationships with psychological and environmental factors and a positive relationship with unhealthy dietary behaviors. We set each of these paths to the same constant magnitude from 0.1 to 0.5 and tested a separate model (Harring, McNeish, & Hancock, 2017).
SPSS version 21 (IBM Corp., Armonk, NY) was used to calculate the descriptive statistics and correlation coefficients, and AMOS version 21 was used to conduct CFA and SEM. For all analyses, the significance level (two-tailed) was set at p < .05.
3. Results
3.1. Participants’ characteristics
Table 1 shows the participants’ characteristics and descriptions of the observed variables.
TABLE 1.
Demographic characteristics and observed variables (N=225)
| Characteristics/Variables | N (%) | M (SD) | Possible range: Min-Max |
|---|---|---|---|
| Age (years) | 54.4 (13.6) | ||
| Gender | |||
| Men | 53 (23.6) | ||
| Women | 172 (76.4) | ||
| Marital Status | |||
| Married | 75 (33.3) | ||
| Widowed/Separated/Divorced | 81 (36.1) | ||
| Never Married | 57 (25.3) | ||
| Other | 12 (5.3) | ||
| Body mass index (kg/m2) | 33.3 (6.1) | ||
| Socioeconomic status | |||
| Education level | |||
| Some high school or less | 12 (5.3) | ||
| High school graduate | 104 (46.2) | ||
| College graduate | 61 (27.1) | ||
| Graduate school or more | 48 (21.3) | ||
| Household income | |||
| 0 to $19,999 | 42 (18.7) | ||
| $20,000 to $39,999 | 54 (24.0) | ||
| $40,000 to $59,999 | 45 (20.0) | ||
| $60,000 to $79,999 | 28 (12.4) | ||
| $80,000 to $99,999 | 25 (11.1) | ||
| More than $100,000 | 31 (13.8) | ||
| Employment status | |||
| Unemployed | 84 (37.3) | ||
| Working Part-Time | 30 (13.3) | ||
| Working Full-Time | 111(49.3) | ||
| Psychological factors | |||
| Healthy eating self-efficacy | 7.5 (2.1) | 2–10: 2–10 | |
| Perceived barriers to healthy eating | 12.6 (2.8) | 4–20: 6–20 | |
| Health perception | 3.1 (0.9) | 1–5: 1–5 | |
| Environment factors | |||
| Aesthetic quality | 2.3 (0.8) | 1–5: 1–5 | |
| Walking environment | 2.4 (0.7) | 1–5: 1–4.43 | |
| Availability of healthy foods | 2.7 (1.1) | 1–5: 1–5 | |
| Safety | 2.7 (1.0) | 1–5: 1–5 | |
| Social cohesion | 2.5 (0.8) | 1–5: 1–5 | |
| Violence | 1.5 (0.6) | 1–4: 1–4 | |
| Dietary behaviors | |||
| Percentage energy from fat | 32.9 (4.0) | 0–100: 26–49 | |
| Sweetened beverage consumption | 3.5 (2.3) | 1–9: 1–9 | |
| Soda consumption | 3.0 (2.0) | 1–9: 1–9 | |
| Fast-food consumption | 3.4 (1.7) | 1–9: 1–9 |
Abbreviations: SD, standard deviation
Of the 225 participants, 76.4% were women, and the mean age was 54.4 years (standard deviation [SD]=13.62). The mean BMI was 33.34 kg/m2 (SD=6.08); approximately 65.3% of the participants were obese (BMI ≥ 30 kg/m2) and 15.1% were extremely obese (BMI ≥ 40 kg/m2). Half of the participants (48.4%) obtained a graduate degree or higher. About 57% of our participants had an annual household income of ≥ $40,000, and 49.3% were employed full-time.
The mean score for healthy eating self-efficacy was 7.50 (range: 2–10, SD=2.12). The mean score for perceived barriers to healthy eating was 12.56 (SD=2.78), and the mean score for health perception was 3.06 (SD=0.85), indicating good condition in general. Among the environmental subscales, the availability of healthy foods had the highest mean score (mean=2.73, SD=1.08), indicating a poor food environment. The mean percentage of energy from fat intake was 32.89 (range: 25.51–48.56, SD=3.97). Majority of the participants reported sweetened beverage consumption (59.6%), soda consumption (67.6%), and fast-food consumption (63.6%) of < 1–2 times per week. Education level and household income were negatively associated with the percentage of energy from fat intake (r=−0.16, p=.02; r=−0.16, p=.02), sweetened beverages (r=−0.18, p=.01; r=−0.15, p=.03), and soda consumption (r=−0.19, p=.00; r=−0.20, p=.00). There were also significant differences in the percentage of energy from fat intake (F=3.88, p=.01), sweetened beverage consumption (F=3.43, p=.01), and fast-food consumption (F=2.85, p=.04) by employment status.
The difference in dietary behaviors by gender (t=0.34–1.59, p=.11–.73) and marital status was not significant (F=1.15–1.94, p=.08–.34), while the correlation between age and dietary behaviors was significant (r=−0.14–−0.19., p=.00–.04).
3.2. Validity of measurement model
The initial results of the measurement model fit with CFA were as follows: χ²=192.83(p<.00), χ²/df=1.97, RMSEA=0.07, GFI=0.90, TLI=0.87, and CFI=0.89. We reviewed the model comprehensively to improve the model fit based on the theoretical rationale by referring to the modification index suggested in the program. Studies have shown that walking environments, an observed variable of environmental factors, were closely correlated with a healthy food environment, another observed variable of environmental factors (Sallis & Glanz, 2009). Therefore, we added a covariance path between the measurement errors of the walking environment (e8) and the availability of healthy food (e9) (Figure 2). The modified measurement model reported acceptable fit indices (χ²=168.80 (p < .00); χ²/df=1.74; RMSEA=0.05; GFI=0.92; TLI=0.90; CFI=0.92). All factor loadings of observed variables to each latent variable were statistically significant (all p values < .001, β=.34–.84). The latent variables showed significant correlation coefficients (all p values < .05, |r|=0.21–0.52). All latent variables demonstrated adequate discriminant and convergent validities (AVE=0.51–0.88, CR=0.75–0.95, and χ ²=0.04–0.27).
3.3. Test of structural equation model: a multiple mediation model
The overall results of the SEM are provided in Tables 2 and 3.
TABLE 2.
Fit-indices of each model (N=225)
| Model | χ²(p) | χ²/df | GFI | RMSEA | TLI | CFI |
|---|---|---|---|---|---|---|
| Recommended | ≤2 | ≥0.90 | ≤0.05 | ≥0.90 | ≥0.90 | |
| Model with two mediators | 168.81(<.001) | 1.72 | 0.92 | 0.05 | 0.91 | 0.92 |
Abbreviations: Df = degree of freedom; GFI = goodness of fit index; RMSEA = root mean square error of approximation; TLI = Tucker Lewis index; CFI = comparative fit index.
TABLE 3.
Standardized direct, indirect and total effects (N =225)
| Exogenous variables | Endogenous variables | S.E. | C.R. (P) | Direct effects | Indirect effects | Total effects | SMC | ||||||
|---|---|---|---|---|---|---|---|---|---|---|---|---|---|
| β | p-value | 95% CI | β | p -value | 95% CI | β | p -value | 95% CI | |||||
| Multiple mediator model | |||||||||||||
| SES | Psychological | 0.05 | 3.34 (<.001) | .52 | .009 | 0.31, 0.77 | .52 | .009 | 0.31, 0.77 | 0.27 | |||
| Environmental | 0.04 | −3.81 (<.001) | −.41 | .034 | −0.53, −0.25 | −.41 | .034 | −0.53, −0.25 | 0.17 | ||||
| Dietary behaviors | 0.07 | 0.42 (0.674) | .06 | .704 | −0.21, 0.39 | −.27 | .011 | −0.59, −0.10 | −.21 | .038 | −0.38, −0.03 | 0.17 | |
| Psychological | Dietary behaviors | 0.28 | −2.02 (0.038) | −.31 | .024 | −0.68, −0.04 | −.31 | .024 | −0.68, −0.04 | ||||
| Environmental | Dietary behaviors | 0.14 | 2.59 (0.012) | .26 | .013 | 0.04, 0.47 | .26 | .013 | 0.04, 0.47 | ||||
| Multiple mediator model with controlling age | |||||||||||||
| SES | Psychological | 0.05 | 3.26 (<.001) | .53 | .007 | 0.32, 0.79 | .53 | .007 | 0.32, 0.79 | 0.28 | |||
| Environmental | 0.04 | −3.81 (<.001) | −.41 | .032 | −0.53, −0.25 | −.41 | .032 | −0.53, −0.25 | 0.17 | ||||
| Dietary behaviors | 0.07 | 0.17 (0.867) | .02 | .980 | −0.24, −0.31 | −.26 | .012 | −0.54, −0.08 | −.23 | .002 | −0.40, −0.05 | 0.24 | |
| Psychological | Dietary behaviors | 0.27 | −2.03 (0.042) | −.31 | .032 | −0.69, −0.03 | −.31 | .032 | −0.69, −0.03 | ||||
| Environmental | Dietary behaviors | 0.14 | 2.31 (0.021) | .23 | .022 | 0.02, 0.42 | .23 | .022 | 0.02, 0.42 | ||||
| Age | Dietary behaviors | 0.01 | −3.37 (<.001) | −.27 | .009 | −0.43, −0.14 | −.27 | .009 | −0.43, −0.14 | ||||
Abbreviations: SES, socioeconomic status; S.E., standard error; C.R., critical ratio; β, standardized regression weight; p‐value, probability value; CI, confidence interval; SMC, squared multiple correlation.
The multiple mediation model with two mediators showed an adequate fit (see Table 2). SES had significant total indirect effect on dietary behaviors through psychological and environmental factors (β=−.27, p=.01, 95% CI= −0.59 to −0.10), while SES had no significant direct effects on dietary behaviors (β=.06, p=.70, 95% CI= −0.21 to 0.39). SES had a significant direct effect on psychological (β=.52, p=.01, 95% CI=0.31 to 0.77) and environmental factors (β=−.41, p=.03, 95% CI=−0.53 to −0.25). Moreover, psychological (β=−.31, p=.02, 95% CI=−0.68 to −0.04) and environmental factors (β=.26, p=.01, 95% CI=0.04 to 0.47) had significant direct effects on dietary behaviors (see Table 3 and Figure 2). In a multiple mediation model, after controlling for age, psychological and environmental factors fully mediated the relationship between SES and dietary behaviors (β=−.26, p=.02, 95% CI=−0.54 to −0.08).
SES had a significant specific indirect effect on dietary behaviors through psychological factors (β=−.08, p=.01, 95% CI=−0.34 to −0.02). SES also showed a significant specific indirect effect on dietary behaviors through environmental factors (β=−.05, p=.01, 95% CI=−0.12 to −0.01). Therefore, both psychological and environmental factors were independent, significant mediators in the relationship between SES and dietary behaviors.
3.4. Sensitivity analysis
Table 4 shows the results of the sensitivity analyses to examine the unmeasured confounding effects in this study.
TABLE 4.
Changes in standardized regression weights for different magnitudes of phantom variable paths (N=225)
| From | To | Phantom variable path magnitude (β) | |||||
|---|---|---|---|---|---|---|---|
| n/a | 0.10 | 0.20 | 0.30 | 0.40 | 0.50 | ||
| SES | Psychological factors | .53** | .52** | .52** | .51** | .51** | .50** |
| SES | Environmental factors | −.41* | −.41*** | −.41*** | −.40*** | −.39*** | −39*** |
| SES | Dietary behaviors | .02 | .02 | .01 | −.02 | −.04 | −.07 |
| Psychological factors | Dietary behaviors | −.31* | −.30* | −.29* | −.26 | −.23 | −.20 |
| Environmental factors | Dietary behaviors | .23* | .23* | .22* | .20* | .17 | .15 |
Abbreviations: SES, socioeconomic status; β, standardized regression weight;
p‐value < 0.05;
p‐value < 0.01;
p‐value < 0.001; values of “n/a” column are estimates of the original mediating model without the phantom variable
We identified that path estimates were stable if the magnitude of the relationships between the phantom variable of the sociocultural factors and the latent variables (psychological factors, environmental factors, and dietary behaviors) were set to ≤ 0.2. However, when the magnitude of relationships between phantom and latent variables was set to 0.3, psychological factors were not significantly associated with dietary behavior (β=−.26, p=.06). In addition, when the magnitude of relationships was set to ≥ 0.4, the two mediators, psychological and environmental factors, did not show any significant relationships with dietary behaviors (β=−.23, p=.09; β=.17, p=.07).
4. Discussion
We found that the relationship between SES and dietary behaviors is mediated by psychological factors and physical and social environments in the multiple mediation model. A higher SES was associated with better psychological and environmental factors and in turn, with better dietary behaviors among AAs. This finding is noteworthy because SES may not always be modifiable, but we may intervene in the psychological and environmental factors to improve dietary behaviors in AAs.
Few studies to date have examined the multiple meditational effects of the psychological and environmental factors on dietary behaviors. Examining the relationships of various factors simultaneously in a single model is beneficial because these factors do not independently affect an individual’s complicated daily life (Kinard & Webster, 2012). We used a multiple mediation model with an SEM approach and analyzed the mediators simultaneously controlling for the effects of other potential mediators (Preacher & Hayes, 2008).
SES had a significant specific indirect effect on dietary behaviors through psychological factors. A higher SES was associated with greater healthy eating self-efficacy and health perceptions, with lower perceived barriers to healthy eating and better dietary behaviors. Our findings are consistent with those of previous studies that have shown the mediation effects of psychological factors in the relationship between SES and dietary behaviors (Beydoun & Wang, 2008; Sugisawa et al., 2015). For example, in a previous study on diet quality among the general population, perceived barriers to the healthy diet had a mediation effect in the relationship between SES and diet quality (Beydoun & Wang, 2008). Similarly, in a previous study on eating habits of older Japanese adults, self-efficacy was a significant mediator in the relationship between SES and diet habits (Sugisawa et al., 2015). Along with these studies, our findings suggest that dietary behaviors in AA adults with low SES may be improved by targeting health perceptions and self-efficacy and by reducing barriers to healthy food selection.
SES had a significant specific indirect effect on dietary behaviors through environmental factors. Our participants with higher SES reported a better physical and social environment, which may lead to better dietary behaviors. Our findings support the previous study that showed the significant indirect effects of SES on dietary behaviors through perceived environmental factors among women (Inglis, Ball, & Crawford, 2008). The findings of our study suggest that dietary behaviors of socioeconomically disadvantaged adults may be improved by modifying the physical and social environments. For example, healthy dietary behaviors could be adopted or maintained by enhancing perceptions of access to healthy food, identifying where to buy healthy foods, where affordable healthy food might be offered in the community, and how to get to these locations (Gase, Glenn, & Kuo, 2016). In addition, sharing healthy cooking tips with neighbors through community programs or health fair events promoting a healthy community may also improve an individual’s perception of the social environment and in turn, dietary behaviors.
Previous studies have shown that an individual’s perceived environments were more strongly associated with his/her food choices than with objectively measured environments (Brug, 2009; K. Giskes, Van Lenthe, Brug, Mackenbach, & Turrell, 2007). However, enhancing an individual’s perceived environment without improving the physical environment, such as increasing the number of accessible supermarkets and available transportation, may be difficult to achieve. Future interventions for promoting healthy dietary behaviors should take into account the improvement of physical environments in the community and perceptions of environments together.
It is also important to understand the relationship between an individual’ s perceived environment and objectively measured environment by examining the role of each environment from different environmental measurements. For example, in a study where environmental factors were objectively measured based on the number of accessible large supermarkets and local stores, the environmental factors did not show a mediational relationship between SES and diet (Ball, Crawford, & Mishra, 2006a).
Sociocultural factors were not measured in this study; however, sociocultural beliefs and norms are known to play a role in dietary behaviors such as an individual’s food choices, eating, or cooking practices (Airhihenbuwa et al., 1996; Swierad, Vartanian, & King, 2017). Traditional “soul food” was one of the most important cultural factors that compromise healthy food intake in AA communities (Grin, Gayle, Saravia, & Sanders, 2013; Kumanyika et al., 2014; Swierad et al., 2017). In our sensitivity analyses, we examined the potential effect of the unmeasured sociocultural factor on each variable—psychological and environmental factors and dietary behaviors. The findings of sensitivity analyses showed that the relationship between the two mediators and dietary behaviors varied based on the regression weight for the relationship between sociocultural factors and each variable. Our findings suggest that SES and cultural factors (e.g., cultural beliefs and norms) may be important correlates of psychological and environmental factors related to dietary behaviors of AAs (Brown et al., 2019; James, 2004; Satia-Abouta et al., 2002). More studies are needed to examine the role of sociocultural factors in the relationship among SES, psychological and environmental factors, and dietary behaviors in AAs.
The conclusions of this study should be considered in light of several limitations. First, we used cross-sectional data from AAs with overweight or obesity in one geographic location. Although the hypothetical model was constructed based on a growing body of literature regarding dietary behaviors and the socioecological model, examining the mediation effect using cross-sectional data can undermine the statistical mediation model’s assumption to establish a causal mechanism and have the potential for biased parameter estimates (Fairchild & McDaniel, 2017; Maxwell & Cole, 2007). Cross-sectional approaches can either over-estimate or under-estimate the mediating effects (Maxwell & Cole, 2007; O’Laughlin, Martin, & Ferrer, 2018). Thus, further research using longitudinal study designs or randomized trials is needed to validate the presumed effects examined in this study. Our findings may not be generalizable to AAs with a healthy BMI or in other geographical areas. This study also included a small proportion of male participants (about 20%), and half of our participants had middle- to higher SES based on their annual household income and education levels. Groups with higher levels of education or income have a better perception of healthy diet and fewer environmental barriers to access healthy foods than disadvantaged groups (Hupkens, 2000; Pechey & Monsivais, 2016). The dietary behaviors of the middle-to-high SES group were also likely to be affected by health beliefs, rather than food cost or economic issues (Hupkens, 2000). Therefore, future studies with more diverse participants are needed to understand the mechanisms of the factors affecting dietary behaviors and to develop interventions reflecting various AA groups’ values and beliefs about dietary behaviors. Third, we examined the unhealthy dietary behaviors by self-report as dependent variables. Although the unhealthy dietary behaviors of AAs are associated with excess weight gain and health problems, future studies with healthy dietary behaviors such as fruit and vegetable consumption and low-fat intake would enhance our understanding of the dietary behaviors and their associated factors. Finally, although the perceived barriers to healthy eating were reported to be reliable and valid in other studies, a low value of Cronbach’s alpha (.64) in our study may have influenced the study findings.
5. Conclusions
Dietary behaviors are one of the important modifiable lifestyle factors associated with obesity-related health burdens in AAs. We found that psychological factors and physical and social environments were significant mediators in the relationship between SES and dietary behaviors among AA men and women with overweight or obesity. Providing interventions targeting psychological factors and physical and social environments may improve the dietary behaviors of AAs with low SES. In addition, the present study must be administered to and validated with a diverse and geographically representative sample of AAs in light of this study’s limitations, including the cross-sectional data. Future studies should include more public health programs and relevant policies that aim to improve neighborhood environments, as well as individuals’ psychological well-being in order to promote healthy dietary behaviors in socioeconomically disadvantaged groups.
Funding:
This research was supported by the National Institutes of Health (grant numbers K23NR014661) and the National Research Foundation of Korea (grant numbers NRF-2016R1A6A3A03010309).
Footnotes
Declaration of Conflicting Interests: The authors declare that they have no conflicts of interest with respect to the research, authorship, and/or publication of this article.
Conflict of interests:
The authors declare no conflicts of interest.
References
- Airhihenbuwa CO, Kumanyika S, Agurs TD, Lowe A, Saunders D, & Morssink CB (1996). Cultural aspects of African American eating patterns. Ethnicity & Health, 1(3), 245–260. 10.1080/13557858.1996.9961793 [DOI] [PubMed] [Google Scholar]
- An R (2014). Prevalence and Trends of Adult Obesity in the US, 1999–2012. ISRN Obesity, 2014, 1–6. 10.1155/2014/185132 [DOI] [PMC free article] [PubMed] [Google Scholar]
- Anne M, Socio-economic AM, Turrell G, & Kavanagh AM (2006). Author / s : Socio-economic pathways to diet : modelling the association between socio-economic Date : Citation : Publication Status : Persistent Link : File Description : Socio-economic pathways to diet : modelling the association between socio-economic. 9(March), 375–383. 10.1079/PHN2005850 [DOI] [PubMed] [Google Scholar]
- Backholer K, Spencer E, Gearon E, Magliano DJ, Mcnaughton SA, Shaw JE, & Peeters A (2016). The association between socio-economic position and diet quality in Australian adults. Public Health Nutrition, 19(3), 477–485. 10.1017/S1368980015001470 [DOI] [PMC free article] [PubMed] [Google Scholar]
- Ball K, Crawford D, & Mishra G (2006a). Socio-economic inequalities in women’s fruit and vegetable intakes: a multilevel study of individual, social and environmental mediators. Public Health Nutrition, 9(5), 623–630. 10.1079/PHN2005897 [DOI] [PubMed] [Google Scholar]
- Ball K, Crawford D, & Mishra G (2006b). Socio-economic inequalities in women’s fruit and vegetable intakes: a multilevel study of individual, social and environmental mediators. Public Health Nutrition, 9(05), 623–630. 10.1079/PHN2005897 [DOI] [PubMed] [Google Scholar]
- Beaulac J, Kristjansson E, & Cummins S (2009). A systematic review of food deserts, 1966–2007. Preventing Chronic Disease, 6(3). [PMC free article] [PubMed] [Google Scholar]
- Beydoun M. a, & Wang Y (2008). How do socio-economic status, perceived economic barriers and nutritional benefits affect quality of dietary intake among US adults? European Journal of Clinical Nutrition, 62(3), 303–313. 10.1038/sj.ejcn.1602700 [DOI] [PMC free article] [PubMed] [Google Scholar]
- Brown AGM, Houser RF, Mattei J, Lichtenstein AH, & Folta SC (2019). Qualitative exploration of cultural factors influencing diet among African-, Caribbean- and US-born Blacks living in the northeast USA. Journal of Nutritional Science, 1–11. 10.1017/jns.2019.19 [DOI] [PMC free article] [PubMed] [Google Scholar]
- Brug J (2009). Determinants of healthy eating: Motivation, abilities and environmental opportunities. Family Practice, 25(SUPPL. 1), 50–55. 10.1093/fampra/cmn063 [DOI] [PubMed] [Google Scholar]
- Byrne BM (2016). Structural Equation Modeling With AMOS: Basic Concepts, Applications, and Programming, Third Edition (3rd editio). Routledge. [Google Scholar]
- Carter MA, Dubois L, Tremblay MS, Taljaard M, & Jones BL (2012). Trajectories of Childhood Weight Gain: The Relative Importance of Local Environment versus Individual Social and Early Life Factors. PLoS ONE, 7(10). 10.1371/journal.pone.0047065 [DOI] [PMC free article] [PubMed] [Google Scholar]
- Cheung GW, & Lau RS (2008). Testing Mediation and Suppression Effects of Latent Variables:Bootstrapping With Structural Equation Models. Organizational Research Methods, 11(852), 1–30. 10.1177/1094428107300343 [DOI] [Google Scholar]
- Collection S (2016). Associations between socio-economic status and dietary patterns in US black and white adults. 8(5), 583–592. 10.1002/aur.1474.Replication [DOI] [PMC free article] [PubMed] [Google Scholar]
- Denney JT, Kimbro RT, Heck K, & Cubbin C (2017). Social Cohesion and Food Insecurity: Insights from the Geographic Research on Wellbeing (GROW) Study. Maternal and Child Health Journal, 21(2), 343–350. 10.1007/s10995-016-2119-5 [DOI] [PMC free article] [PubMed] [Google Scholar]
- Echeverria SE, Diez-Roux AV, & Link BG (2004). Reliability of self-reported neighborhood characteristics. Journal of Urban Health, 81(4), 682–701. 10.1093/jurban/jth151 [DOI] [PMC free article] [PubMed] [Google Scholar]
- Fairchild AJ, & McDaniel HL (2017). Statistical Commentary Best (but oft-forgotten) practices: mediation analysis 1,2. Am J Clin Nutr, 105, 1259–1271. 10.3945/ajcn.117.152546.Am [DOI] [PMC free article] [PubMed] [Google Scholar]
- Francis DK, Van den Broeck J, Younger N, McFarlane S, Rudder K, Gordon-Strachan G, … Wilks R (2009). Fast-food and sweetened beverage consumption: association with overweight and high waist circumference in adolescents. Public Health Nutrition, 12(8), 1106–1114. 10.1017/S1368980009004960 [DOI] [PubMed] [Google Scholar]
- Franko DL, Cousineau TM, Rodgers RF, Roehrig JP, & Hoffman JA (2013). Social-Cognitive Correlates of Fruit and Vegetable Consumption in Minority and Non-Minority Youth. Journal of Nutrition Education and Behavior, 45(2), 96–101. 10.1016/j.jneb.2011.11.006 [DOI] [PMC free article] [PubMed] [Google Scholar]
- Gase LN, Glenn B, & Kuo T (2016). Self-Efficacy as a Mediator of the Relationship Between the Perceived Food Environment and Healthy Eating in a Low Income Population in Los Angeles County. Journal of Immigrant and Minority Health, 18(2), 345–352. 10.1007/s10903-015-0186-0 [DOI] [PMC free article] [PubMed] [Google Scholar]
- Gibson S, & Neate D (2007). Sugar intake, soft drink consumption and body weight among British children: Further analysis of National Diet and Nutrition Survey data with adjustment for under-reporting and physical activity. International Journal of Food Sciences and Nutrition, 58(6), 445–460. 10.1080/09637480701288363 [DOI] [PubMed] [Google Scholar]
- Giskes K, Van Lenthe FJ, Brug J, Mackenbach JP, & Turrell G (2007). Socioeconomic inequalities in food purchasing: The contribution of respondent-perceived and actual (objectively measured) price and availability of foods. Preventive Medicine, 45(1), 41–48. 10.1016/j.ypmed.2007.04.007 [DOI] [PubMed] [Google Scholar]
- Giskes Katrina, Kamphuis CBM, van Lenthe FJ, Kremers S, Droomers M, & Brug J (2007). A systematic review of associations between environmental factors, energy and fat intakes among adults: is there evidence for environments that encourage obesogenic dietary intakes? Public Health Nutrition, 10(10), 1005–1017. 10.1017/S1368980007665525 [DOI] [PubMed] [Google Scholar]
- Grin BM, Gayle TL, Saravia DC, & Sanders LM (2013). Use of farmers markets by mothers of WIC recipients, Miami-Dade County, Florida, 2011. Preventing Chronic Disease, 10, E95–E95. 10.5888/pcd10.120178 [DOI] [PMC free article] [PubMed] [Google Scholar]
- Halbert CH, Bellamy S, Briggs V, Bowman M, Delmoor E, Kumanyika S, … Johnson JC (2014). Collective efficacy and obesity-related health behaviors in a community sample of African Americans. Journal of Community Health, 39(1), 124–131. 10.1007/s10900-013-9748-z [DOI] [PMC free article] [PubMed] [Google Scholar]
- Hancock GR, & Freeman MJ (2001). Power and sample size for the root mean square error of approximation test of not close fit in structural equation modeling. Educational and Psychological Measurement, 61(5), 741–758. 10.1177/00131640121971491 [DOI] [Google Scholar]
- Harring JR, McNeish DM, & Hancock GR (2017). Using Phantom Variables in Structural Equation Modeling to Assess Model Sensitivity to External Misspecification. Psychological Methods, 22(4), 616–631. 10.1037/met0000103 [DOI] [PubMed] [Google Scholar]
- Hiza HAB, Casavale KO, Guenther PM, & Davis CA (2013). Diet Quality of Americans Differs by Age, Sex, Race/Ethnicity, Income, and Education Level. Journal of the Academy of Nutrition and Dietetics, 113(2), 297–306. 10.1016/j.jand.2012.08.011 [DOI] [PubMed] [Google Scholar]
- Hupkens CL (2000). The explanatory value of permissiveness and health and cost considerations. European Journal of Public Health, 10(2), 108–113. [Google Scholar]
- Inglis V, Ball K, & Crawford D (2008). Socioeconomic variations in women’s diets: what is the role of perceptions of the local food environment? Journal of Epidemiology & Community Health, 62(3), 191–197. 10.1136/jech.2006.059253 [DOI] [PubMed] [Google Scholar]
- Ishii K, Shibata A, & Oka K (2010). Environmental, psychological, and social influences on physical activity among Japanese adults: structural equation modeling analysis. Int J Behav Nutr Phys Act, 7, 61. 10.1186/1479-5868-7-61 [DOI] [PMC free article] [PubMed] [Google Scholar]
- James DCS (2004). Factors influencing food choices, dietary intake, and nutrition-related attitudes among African Americans: Application of a culturally sensitive model. Ethnicity and Health, 9(4), 349–367. 10.1080/1355785042000285375 [DOI] [PubMed] [Google Scholar]
- Kim G-S (2010). Analysis structural equation modeling. Seoul: Hannarae. [Google Scholar]
- Kinard BR, & Webster C (2012). Factors influencing unhealthy eating behaviour in US adolescents. International Journal of Consumer Studies, 36(1), 23–29. 10.1111/j.1470-6431.2011.01005.x [DOI] [Google Scholar]
- Kirkpatrick SI, Dodd KW, Reedy J, & Krebs-Smith SM (2012). Income and Race/Ethnicity Are Associated with Adherence to Food-Based Dietary Guidance among US Adults and Children. Journal of the Academy of Nutrition and Dietetics, 112(5), 624–635.e6. 10.1016/j.jand.2011.11.012 [DOI] [PMC free article] [PubMed] [Google Scholar]
- Kumanyika SK, Whitt-Glover MC, & Haire-Joshu D (2014). What works for obesity prevention and treatment in black Americans? Research directions. Obesity Reviews, 15(October), 204–212. 10.1111/obr.12213 [DOI] [PubMed] [Google Scholar]
- Larson NI, Story MT, & Nelson MC (2009). Neighborhood Environments. Disparities in Access to Healthy Foods in the U.S. American Journal of Preventive Medicine, 36(1), 74–81.e10. 10.1016/j.amepre.2008.09.025 [DOI] [PubMed] [Google Scholar]
- Lomax RG, & Schumacker RE (2004). A beginner’s guide to structural equation modeling (2nd editio). Mahwah, New Jersey London: LAWRENCE ERLBAUM ASSOCIATES. [Google Scholar]
- Lu N, Samuels ME, & Huang KC (2002). Dietary behavior in relation to socioeconomic characteristics and self-perceived health status. Journal of Health Care for the Poor and Underserved, 13(2), 241–257. 10.1353/hpu.2010.0567 [DOI] [PubMed] [Google Scholar]
- MacCallum RC, Browne MW, & Sugawara HM (1996). Power analysis and determination of sample size for covariance structure modeling. Psychological Methods, 1(2), 130. [Google Scholar]
- Macho S, & Ledermann T (2011). Estimating, testing, and comparing specific effects in structural equation models: the phantom model approach. Psychological Methods, 16(1), 34–43. 10.1037/a0021763 [DOI] [PubMed] [Google Scholar]
- MacKinnon DP (2008). Introduction to statistical mediation analysis. APA Handbook of Research Methods in Psychology Vol 2 Research Designs Quantitative Qualitative Neuropsychological and Biological. 10.1037/13620-018 [DOI] [Google Scholar]
- Maxwell SE, & Cole DA (2007). Bias in cross-sectional analyses of longitudinal mediation. Psychological Methods, 12(1), 23–44. 10.1037/1082-989X.12.1.23 [DOI] [PubMed] [Google Scholar]
- McTigue KM, Chang YF, Eaton C, Garcia L, Johnson KC, Lewis CE, … Kuller LH (2014). Severe obesity, heart disease, and death among white, african american, and hispanic postmenopausal women. Obesity, 22(3), 801–810. 10.1002/oby.20224 [DOI] [PubMed] [Google Scholar]
- Morland KB, Wing S, & Diez Roux AV (2002). The contextual effect of the local food environment on residents’ diets: the atherosclerosis risk in communities study. American Journal of Public Health, 92(11), 1761–1767. 10.2105/AJPH.92.11.1761 [DOI] [PMC free article] [PubMed] [Google Scholar]
- Mujahid MS, Diez Roux AV, Morenoff JD, & Raghunathan T (2007). Assessing the measurement properties of neighborhood scales: From psychometrics to ecometrics. American Journal of Epidemiology, 165(8), 858–867. 10.1093/aje/kwm040 [DOI] [PubMed] [Google Scholar]
- Mujahid MS, Roux AVD, Morenoff JD, Raghunathan TE, Cooper RS, Ni H, & Shea S (2008). Neighborhood characteristics and hypertension. Epidemiology, 590–598. [DOI] [PubMed] [Google Scholar]
- Nelson MC, & Lytle LA (2009). Development and Evaluation of a Brief Screener to Estimate Fast-Food and Beverage Consumption among Adolescents. Journal of the American Dietetic Association, 109(4), 730–734. 10.1016/j.jada.2008.12.027 [DOI] [PMC free article] [PubMed] [Google Scholar]
- O’Laughlin KD, Martin MJ, & Ferrer E (2018). Cross-Sectional Analysis of Longitudinal Mediation Processes. Multivariate Behavioral Research, 53(3), 375–402. 10.1080/00273171.2018.1454822 [DOI] [PubMed] [Google Scholar]
- Pechey R, & Monsivais P (2016). Socioeconomic inequalities in the healthiness of food choices: Exploring the contributions of food expenditures. Preventive Medicine, 88, 203–209. [DOI] [PMC free article] [PubMed] [Google Scholar]
- Preacher KJ, & Hayes AF (2008). Asymptotic and resampling strategies for assessing and comparing indirect effects in multiple mediator models. Behavior Research Methods, 40(3), 879–891. 10.3758/BRM.40.3.879 [DOI] [PubMed] [Google Scholar]
- Raffensperger S, Kuczmarski MF, Hotchkiss L, Cotugna N, Evans MK, & Zonderman AB (2010). Effect of race and predictors of socioeconomic status on diet quality in the HANDLS study sample. Journal of the National Medical Association, 102(10), 923–930. 10.1016/S0027-9684(15)30711-2 [DOI] [PMC free article] [PubMed] [Google Scholar]
- Robinson T (2008). Applying the socio-ecological model to improving fruit and vegetable intake among low-income African Americans. Journal of Community Health, 33(6), 395–406. 10.1007/s10900-008-9109-5 [DOI] [PubMed] [Google Scholar]
- Sallis JF, & Glanz K (2009). Physical activity and food environments: Solutions to the obesity epidemic. Milbank Quarterly, 87(1), 123–154. 10.1111/j.1468-0009.2009.00550.x [DOI] [PMC free article] [PubMed] [Google Scholar]
- Sallis JF, Owen N, & Fisher E (2015). No Title. In 5th edition (Ed.), Health behavior: theory, research, and practice (pp. 43–64). San Francisco: Jossey-Bass. [Google Scholar]
- Satia-Abouta J, Patterson RE, Neuhouser ML, & Elder J (2002). Dietary acculturation: Applications to nutrition research and dietetics. Journal of the American Dietetic Association, Vol. 102, pp. 1105–1118. 10.1016/S0002-8223(02)90247-6 [DOI] [PubMed] [Google Scholar]
- Satia JA, Galanko JA, & Siega-Riz AM (2004). Eating at fast-food restaurants is associated with dietary intake, demographic, psychosocial and behavioural factors among African Americans in North Carolina. Public Health Nutrition, 7(8), 1089–1096. 10.1079/phn2004662 [DOI] [PubMed] [Google Scholar]
- Simsek H, Doganay S, Budak R, & Ucku R (2013). Relationship of socioeconomic status with health behaviors and self-perceived health in the elderly: A community-based study, Turkey. Geriatrics & Gerontology International, 14, 960–968. 10.1111/ggi.12166 [DOI] [PubMed] [Google Scholar]
- Sugisawa H, Nomura T, & Tomonaga M (2015). Psychosocial mediators between socioeconomic status and dietary habits among Japanese older adults. Journal of Nutrition, Health and Aging, 19(2), 130–136. 10.1007/s12603-014-0521-5 [DOI] [PubMed] [Google Scholar]
- Suglia SF, Shelton RC, Hsiao A, Wang YC, Rundle A, & Link BG (2016). Why the Neighborhood Social Environment Is Critical in Obesity Prevention. Journal of Urban Health, 93(1), 206–212. 10.1007/s11524-015-0017-6 [DOI] [PMC free article] [PubMed] [Google Scholar]
- Swierad EM, Vartanian LR, & King M (2017). The influence of ethnic and mainstream cultures on African Americans’ health behaviors: A qualitative study. Behavioral Sciences, 7(3). 10.3390/bs7030049 [DOI] [PMC free article] [PubMed] [Google Scholar]
- Thompson FE, Midthune D, Subar AF, Kipnis V, Kahle LL, & Schatzkin A (2007). {A figure is presented}Development and Evaluation of a Short Instrument to Estimate Usual Dietary Intake of Percentage Energy from Fat. Journal of the American Dietetic Association, 107(5), 760–767. 10.1016/j.jada.2007.02.006 [DOI] [PubMed] [Google Scholar]
- VanderWeele TJ (2016). Mediation Analysis: A Practitioner’s Guide. Annual Review of Public Health, 37, 17–32. 10.1146/annurev-publhealth-032315-021402 [DOI] [PubMed] [Google Scholar]
- Vlismas K, Stavrinos V, & Panagiotakos DB (2009). Socio-economic status, dietary habits and health-related outcomes in various parts of the world: A review. Central European Journal of Public Health, Vol. 17, pp. 55–63. 10.21101/cejph.b0356 [DOI] [PubMed] [Google Scholar]
- Watters JL, & Satia JA (2009). Psychosocial correlates of dietary fat intake in African-American adults: A cross-sectional study. Nutrition Journal, 8(1), 1–9. 10.1186/1475-2891-8-15 [DOI] [PMC free article] [PubMed] [Google Scholar]
- West SG, Finch JF, & Curran PJ (1995). Structural equation models with nonnormal variables: Problems and remedies. Sage. [Google Scholar]
- Whitt-Glover MC, Kumanyika SK, & Haire-Joshu D (2014). Introduction to the special issue on achieving healthy weight in black American communities. Obesity Reviews, 15(October), 1–4. 10.1111/obr.12210 [DOI] [PubMed] [Google Scholar]
- Wilcox S, Sharpe PA, Liese AD, Dunn CG, & Hutto B (2018). Socioeconomic factors associated with diet quality and meeting dietary guidelines in disadvantaged neighborhoods in the Southeast United States. Ethnicity and Health, 0(0), 1–17. 10.1080/13557858.2018.1493434 [DOI] [PMC free article] [PubMed] [Google Scholar]
- Yen WC, Shariff ZM, Kandiah M, & Taib MNM (2014). Stages of change to increase fruit and vegetable intake and its relationships with fruit and vegetable intake and related psychosocial factors. Nutrition Research and Practice, 8(3), 297–303. 10.4162/nrp.2014.8.3.297 [DOI] [PMC free article] [PubMed] [Google Scholar]