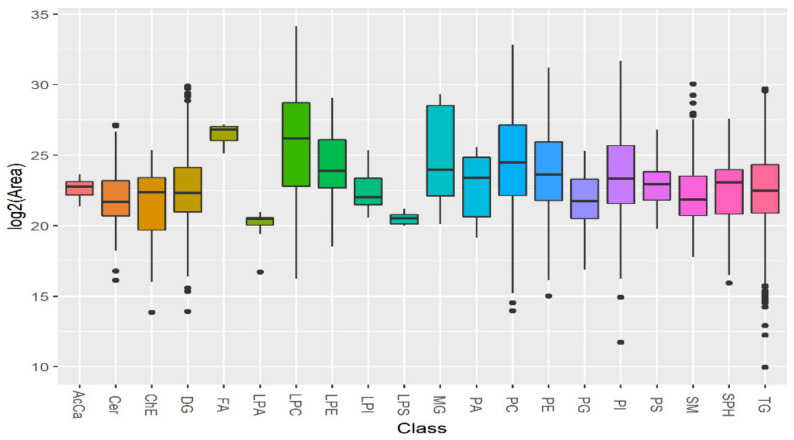
Figure 2.
Leishmania lipidome profile identifies twenty different lipid classes. The signal intensity is represented as the integrated peak area transformed by binary logarithm function in the Y axis. The data from three biological repeats were analyzed. The lipidomic profile obtained by ultra-performance liquid chromatography coupled to tandem mass spectrometry (ULPC-MS/MS) allowed the detection of several lipid classes distributed in the X axis: acyl carnitine (AcCa), ceramide (Cer), cholesterol ester (ChE), diglyceride (DG), fatty acids (FA), lysophosphatidic acid (LPA), lysophosphatidylcholine (LPC), lysophosphatidylethanolamine (LPE), lysophosphatidylinositol (LPI), lysophosphatidylserine (LPS), monoglyceride (MG), phosphatidic acid (PA), phosphatidylcholine (PC), phosphatidylethanolamine (PE), phosphatidylglycerol (PG), phosphatidylinositol (PI), phosphatidylserine (PS), sphingomyelin (SM), sphingosine (SPH) and triglyceride (TG). The chart includes the lipid ions detected in both sensitive and resistant strains, merging lipids detected in positive and negative mode. In a typical boxplot, the vertical lines connect with the minimum and maximum values. The horizontal middle line of the boxes located between quartile 1 and quartile 3, represents the median, while the points at the ends represent the values considered outliers.

