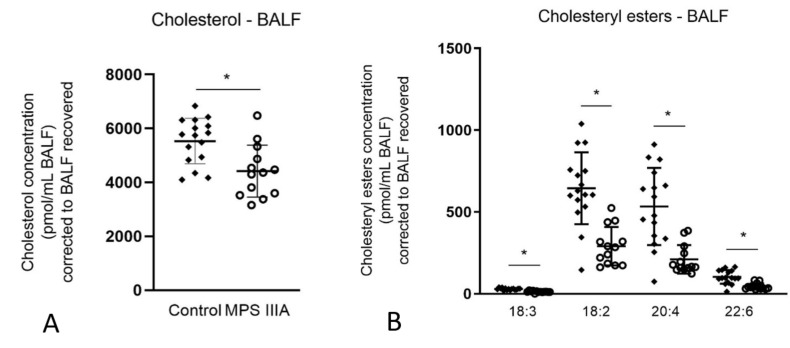
Figure 6.
Cholesterol analysis of BALF (A) and cholesteryl ester analysis of BALF (B). Quantification of cholesterol and the ester molecular species in 20-week control and MPS IIIA BALF were measured by LC MS/MS using an API 4000 QTrap mass spectrometer (ABSciex) coupled with a Prominence HPLC (Shimadzu). Data are expressed as concentration (pmol/mL BALF) to C17 Cholesteryl ester (Sigma C5384) and plotted as mean ± SD; two-tailed Students t-test, * indicates a significant difference, p < 0.0001 between control and MPS IIIA mice, n = 16 control and 13 MPS IIIA samples (A) and n = 15 control and 13 MPS IIIA samples (B).

