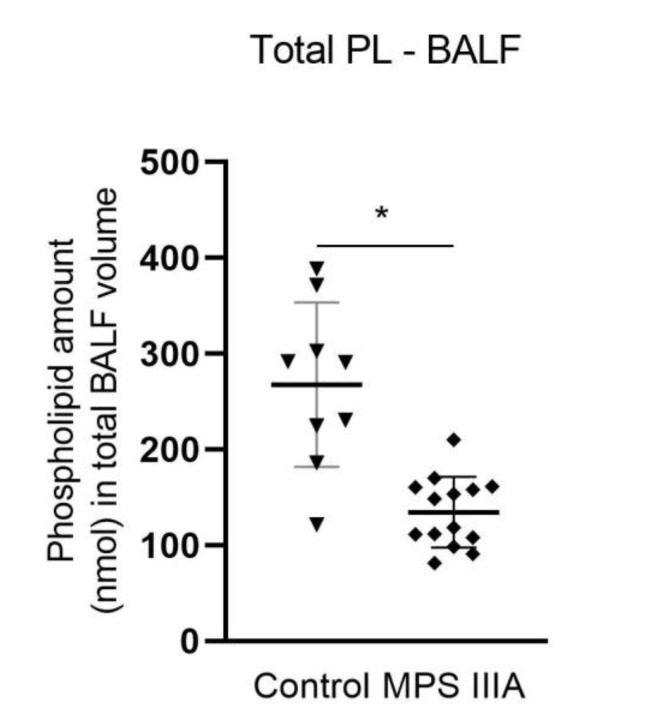
Figure 7.
Total phospholipid pool size analysis in BALF. Quantification of the phospholipid species in control and MPS IIIA BALF. Phospholipids were measured using electrospray ionisation mass spectrometry (ESI-MS) (Waters XEVO TQ-MS). Data are expressed as total phospholipids (nmol) in the total corrected BALF volume and plotted as mean ± SD; two-tailed Students t-test, * indicates a significant difference, p < 0.0001 between control and MPS IIIA mice; n = 9 control and 14 MPS IIIA samples.

