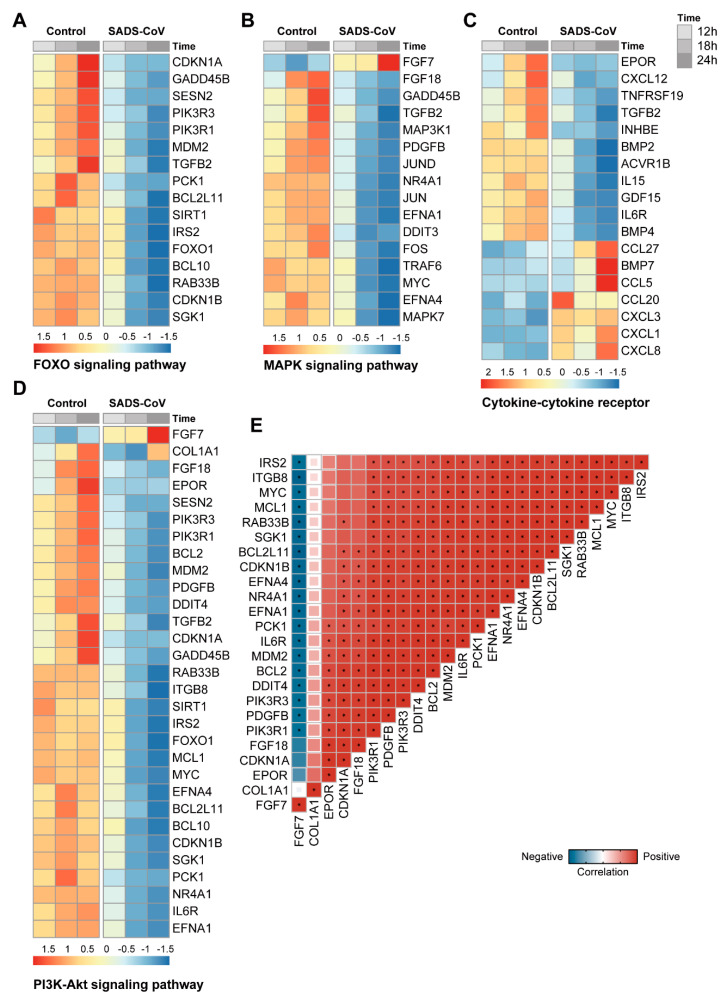
Figure 6.
(A–D): Heatmap shows the fold change of genes in four KEGG pathways in SADS-CoV-infected cells compared with mock-infected cells at 12, 18, and 24 hpi. (E): Correlation plot shows the correlations between genes enriched in PI3K-Akt signaling pathway. The color and size of square denote the correlation coefficient between two genes and * represents p-value of correlation >0.05.

