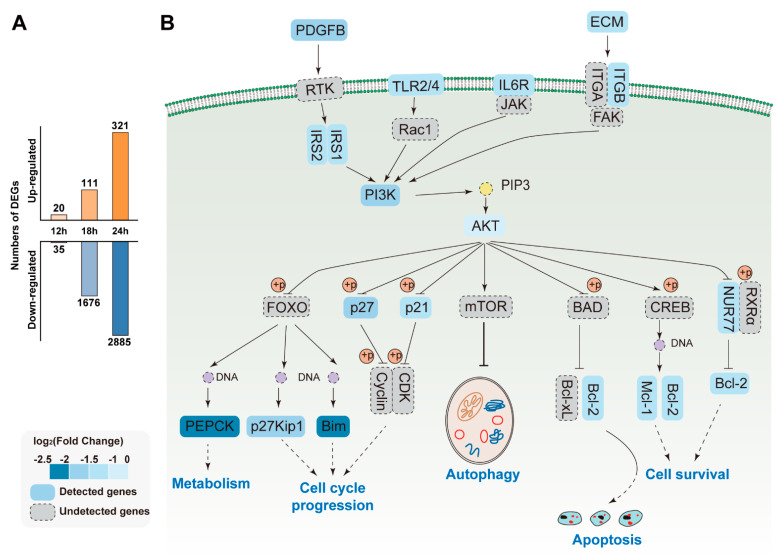
Figure 8.
Signaling pathways affected by SADS-CoV infection. (A) Barplot of DEGs number in SADS-CoV infection cells at three time-points. (B) Schematic representation of the signaling pathways that converge on autophagy, apoptosis, cell cycle progression, and metabolism. The proteins detected in SADS-CoV-infected cells are shown in the solid boxes, whereas the proteins that remained undetected in our study are shown in the dotted boxes. Boxes in different shades of color represent proteins fold change.

